LinkedIn is a vital platform for professional networking and content sharing. To ensure your content resonates with your target audience, it's essential to monitor engagement metrics. Slidebeast simplifies this process by offering automated LinkedIn analytics reports, providing you with the insights needed to refine your content strategy.
Key LinkedIn Metrics to Track for Content Engagement
.webp)
To effectively gauge your LinkedIn content's performance, focus on the following metrics:
-
Impressions: The number of times your content is displayed to users. High impressions indicate good reach, but pairing this with engagement metrics reveals how compelling your content truly is.
-
Clicks: The count of user interactions with links in your posts. A higher number of clicks signifies that your audience finds your content intriguing enough to explore further.
-
Reactions: The total of likes, celebrates, supports, and other reactions your content receives. These reactions provide immediate feedback on how your audience feels about your content.
-
Comments: The number of user responses to your posts. Engaging content encourages discussions, and a higher comment count reflects this.
-
Shares: The frequency with which users share your content with their network. Shares expand your content's reach beyond your immediate followers.
-
Engagement Rate: Calculated as the total engagements (reactions, comments, shares, clicks) divided by the number of impressions. This metric offers a comprehensive view of how well your content resonates with your audience.
Slidebeast allows you to monitor these metrics effortlessly by generating detailed LinkedIn reports in PowerPoint format, enabling easy analysis and sharing.
Setting Up LinkedIn Engagement Reports in Slidebeast
Here's how to set up your LinkedIn engagement reports using Slidebeast:
-
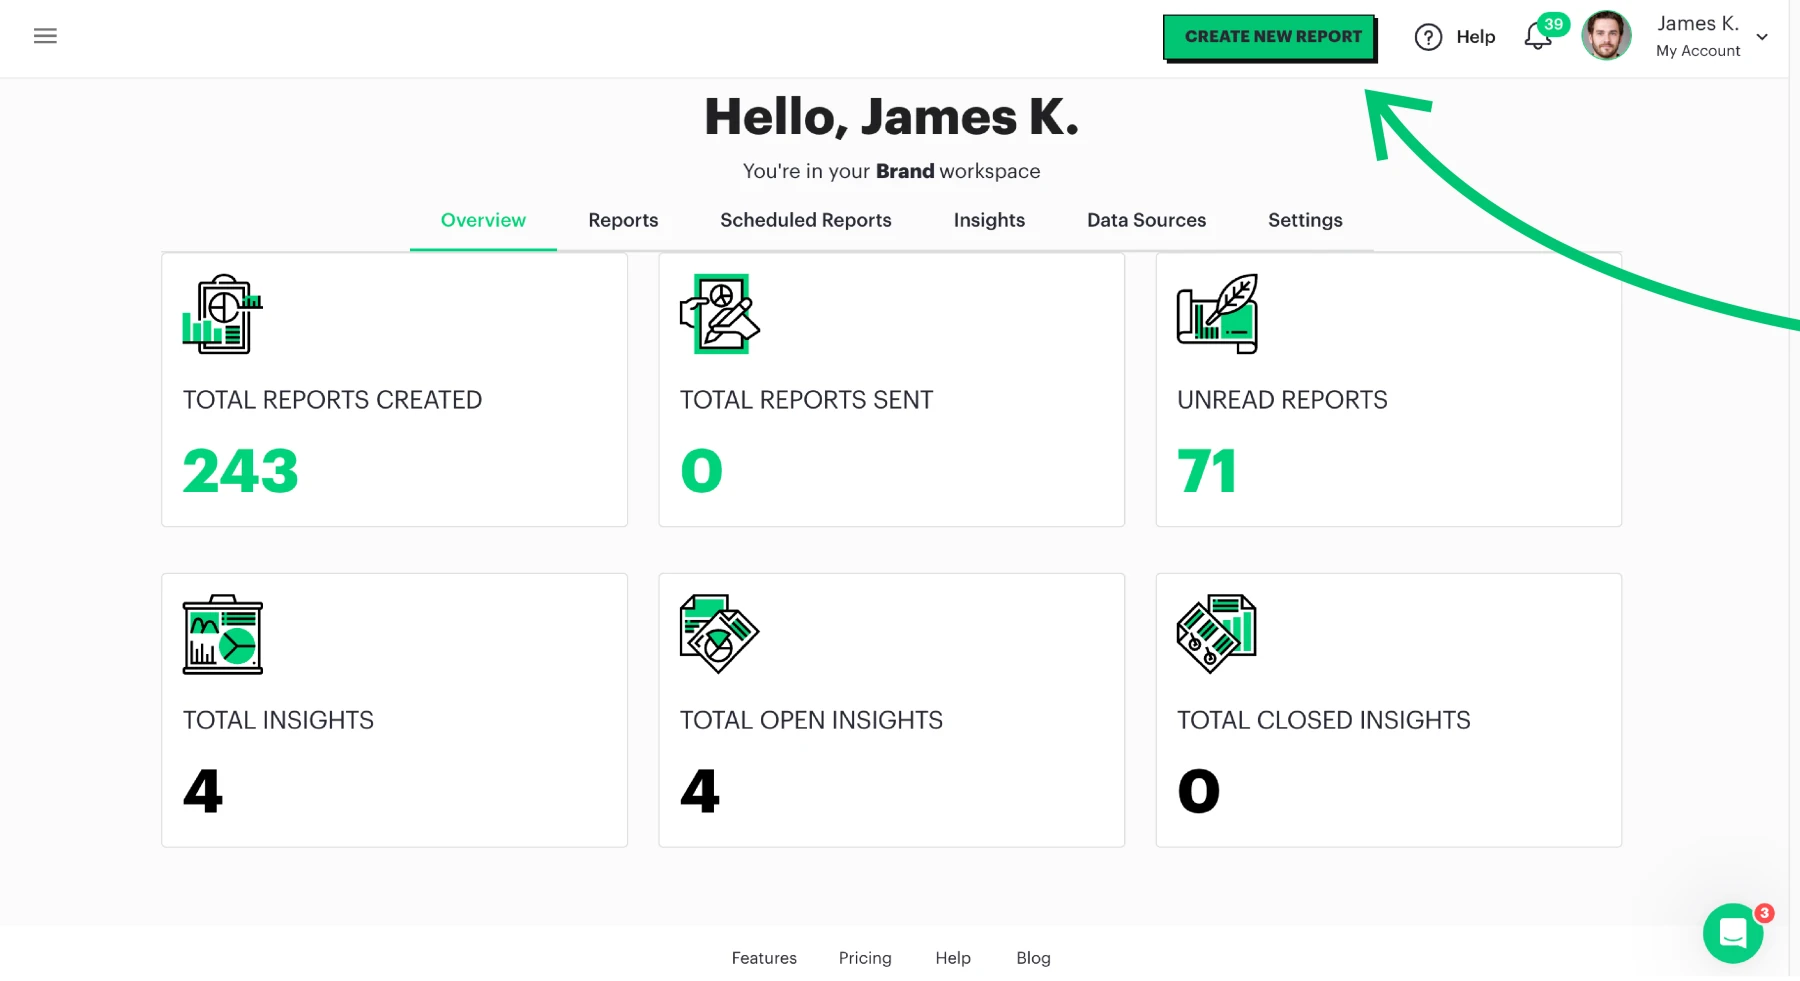
Log In to Slidebeast: Access your account and navigate to the "Create New Report" button.
-
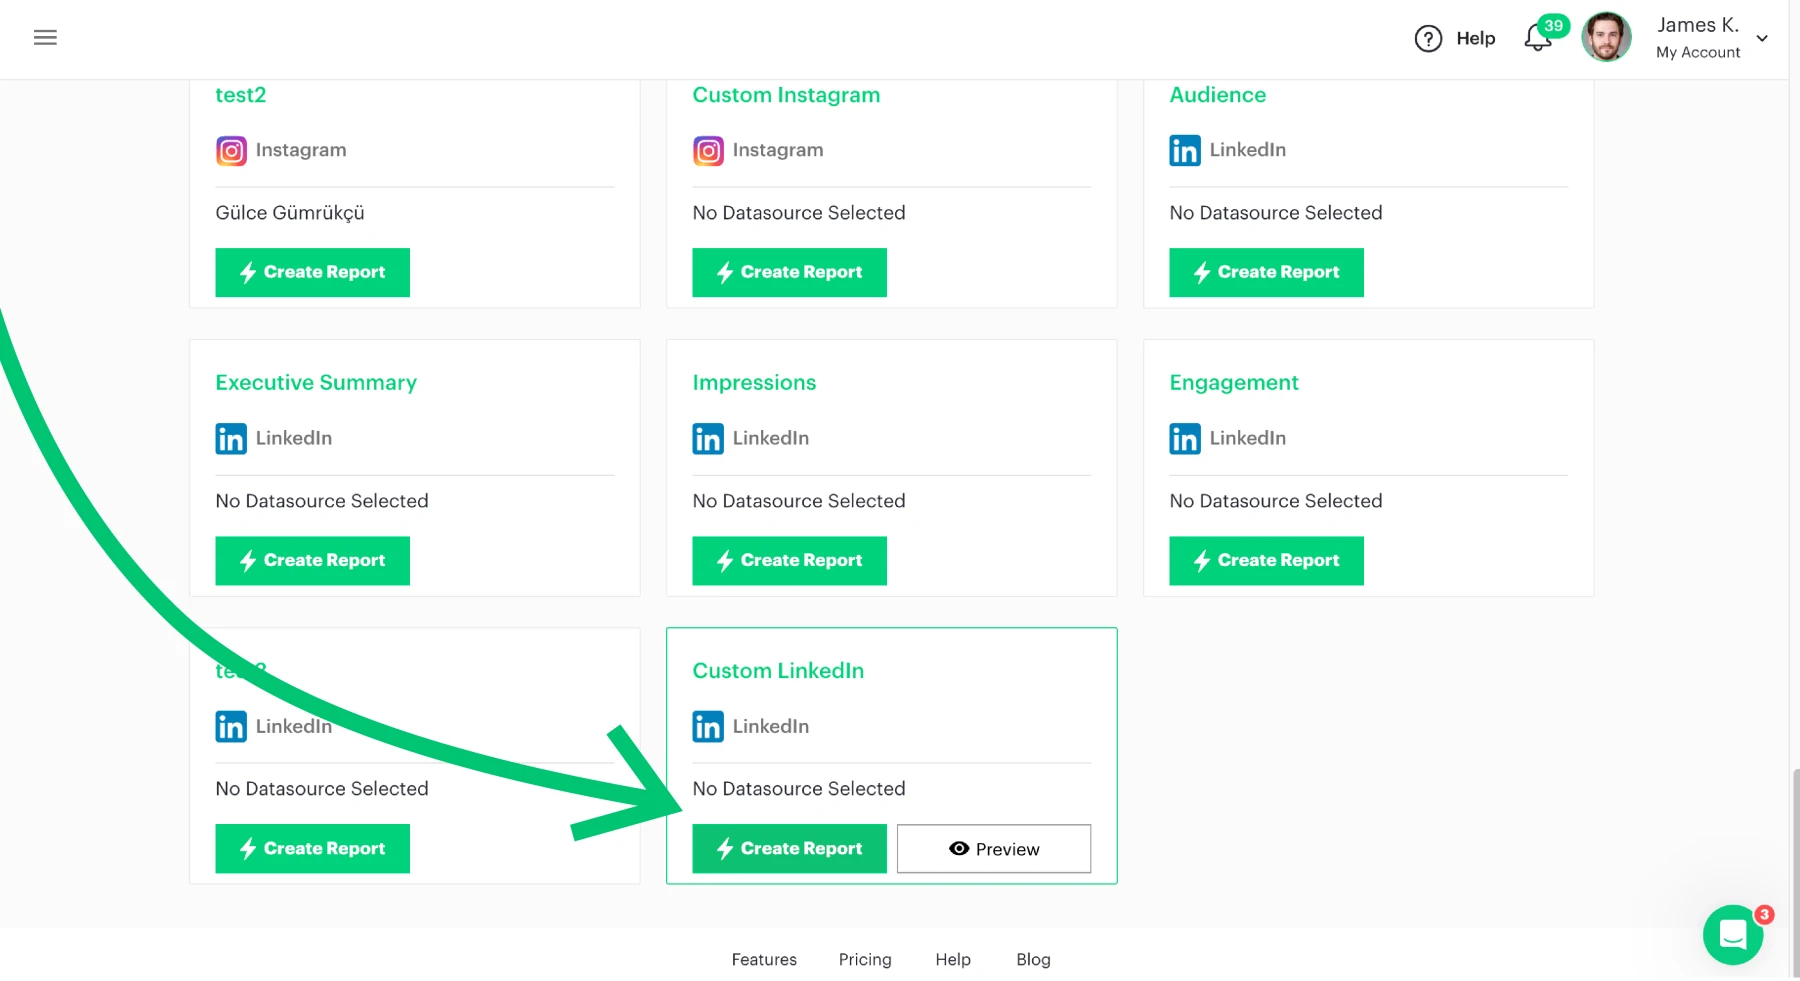
Select a Reporting Template:
- In the "Pre-Made Reports" section, select Custom LinkedIn Report.
- This will lead you to the Create Report Wizard (CRW).
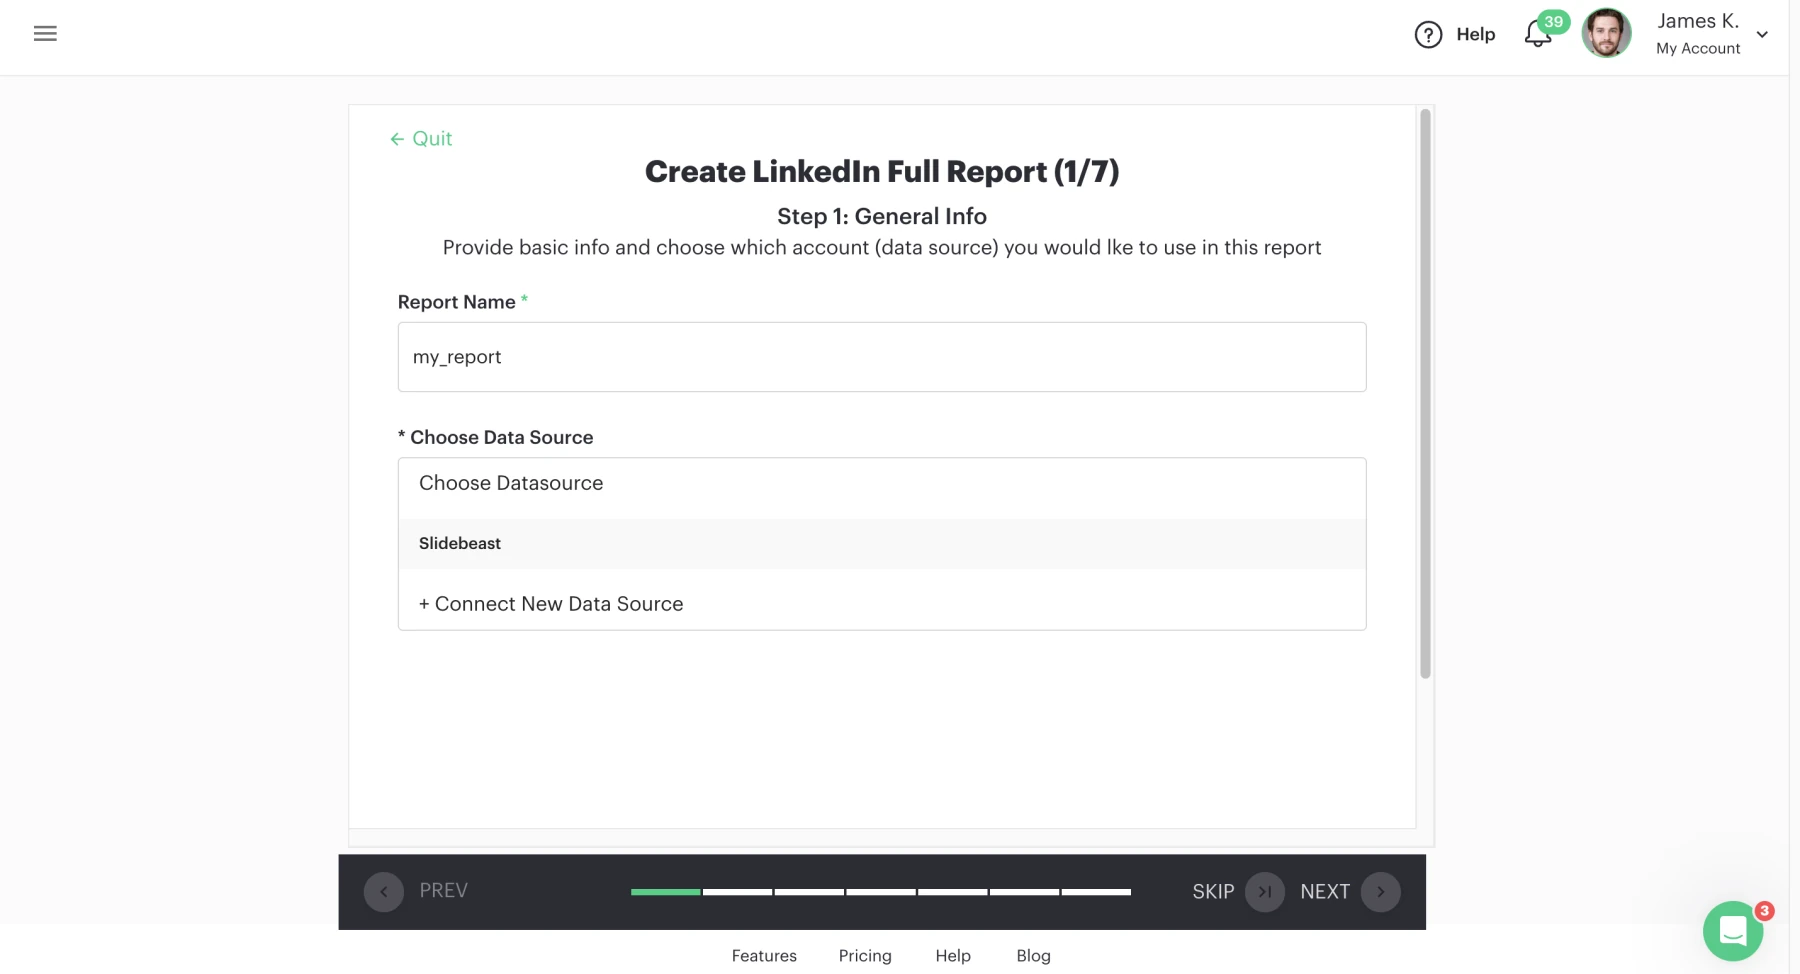
- Name your report, and on the same page, add your LinkedIn connection (or choose an existing one if already set up).
-
Customize Your Report Sections
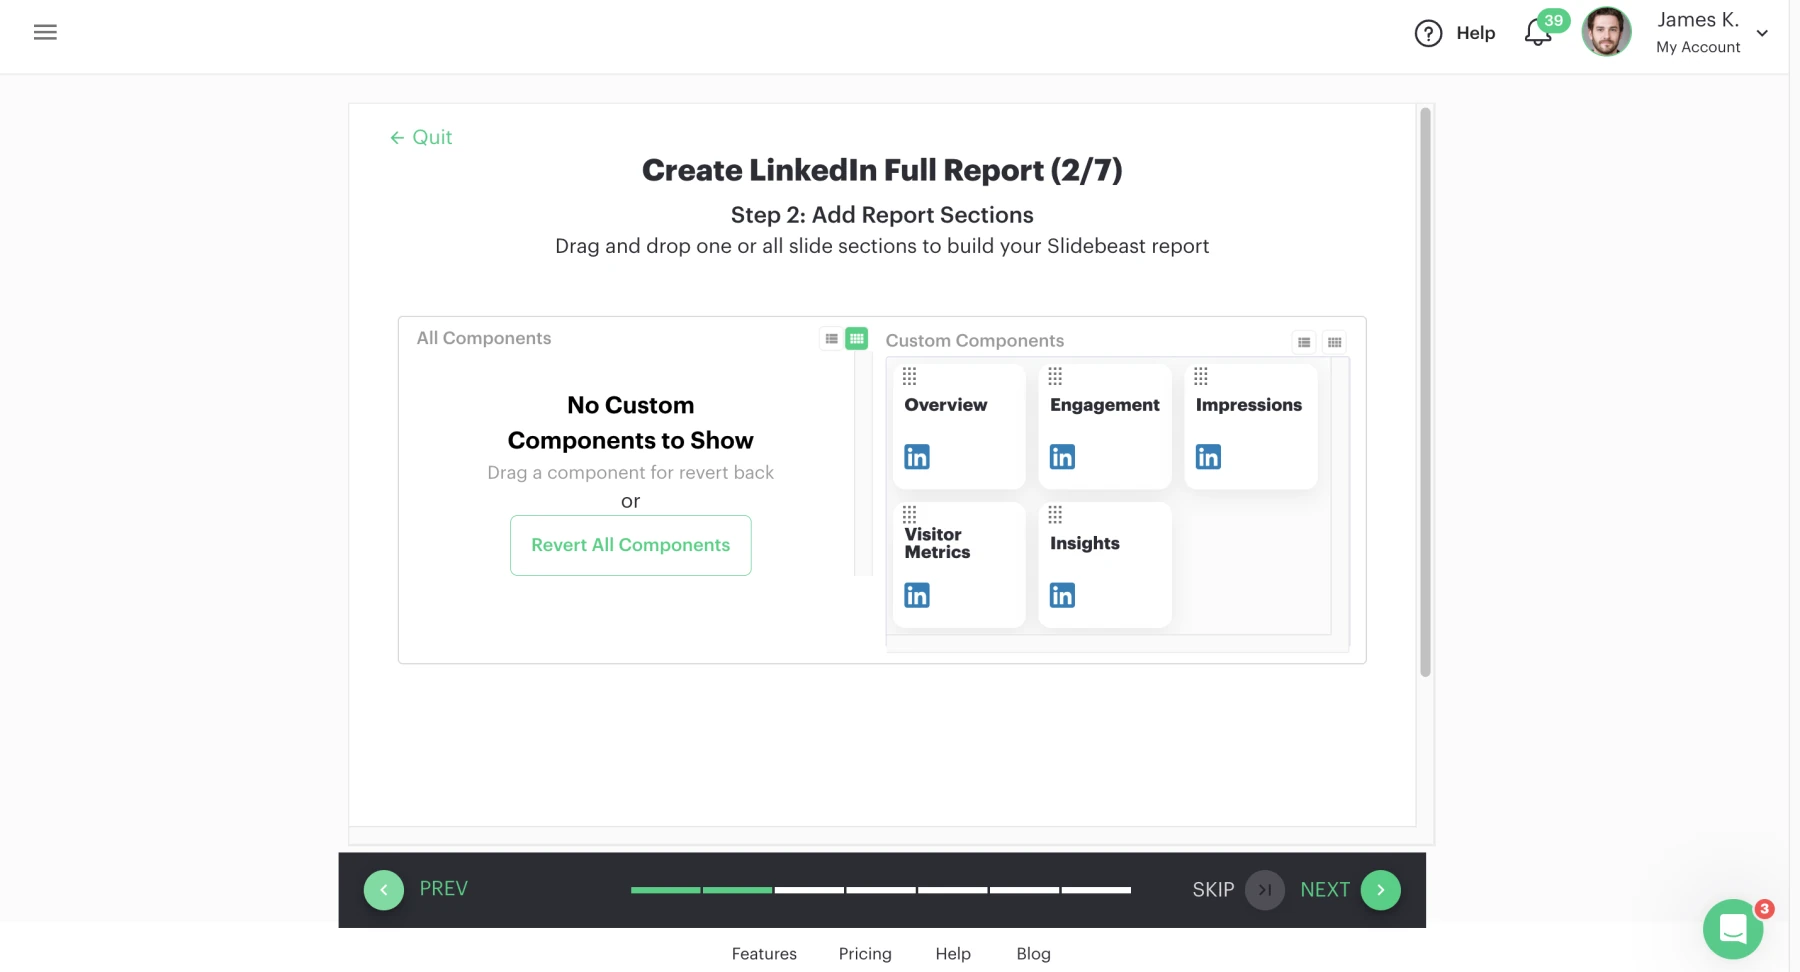
- Select the sections you’d like to include in your report. Available options are:
- Overview
- Impressions
- Engagement
- Visitor Metrics
- Insights
- Simply drag and drop to add sections. You can also use the "Get All Components" button to include all sections and reorder them as needed.
- Select the sections you’d like to include in your report. Available options are:
-
Set the Date Range and Comparison Period
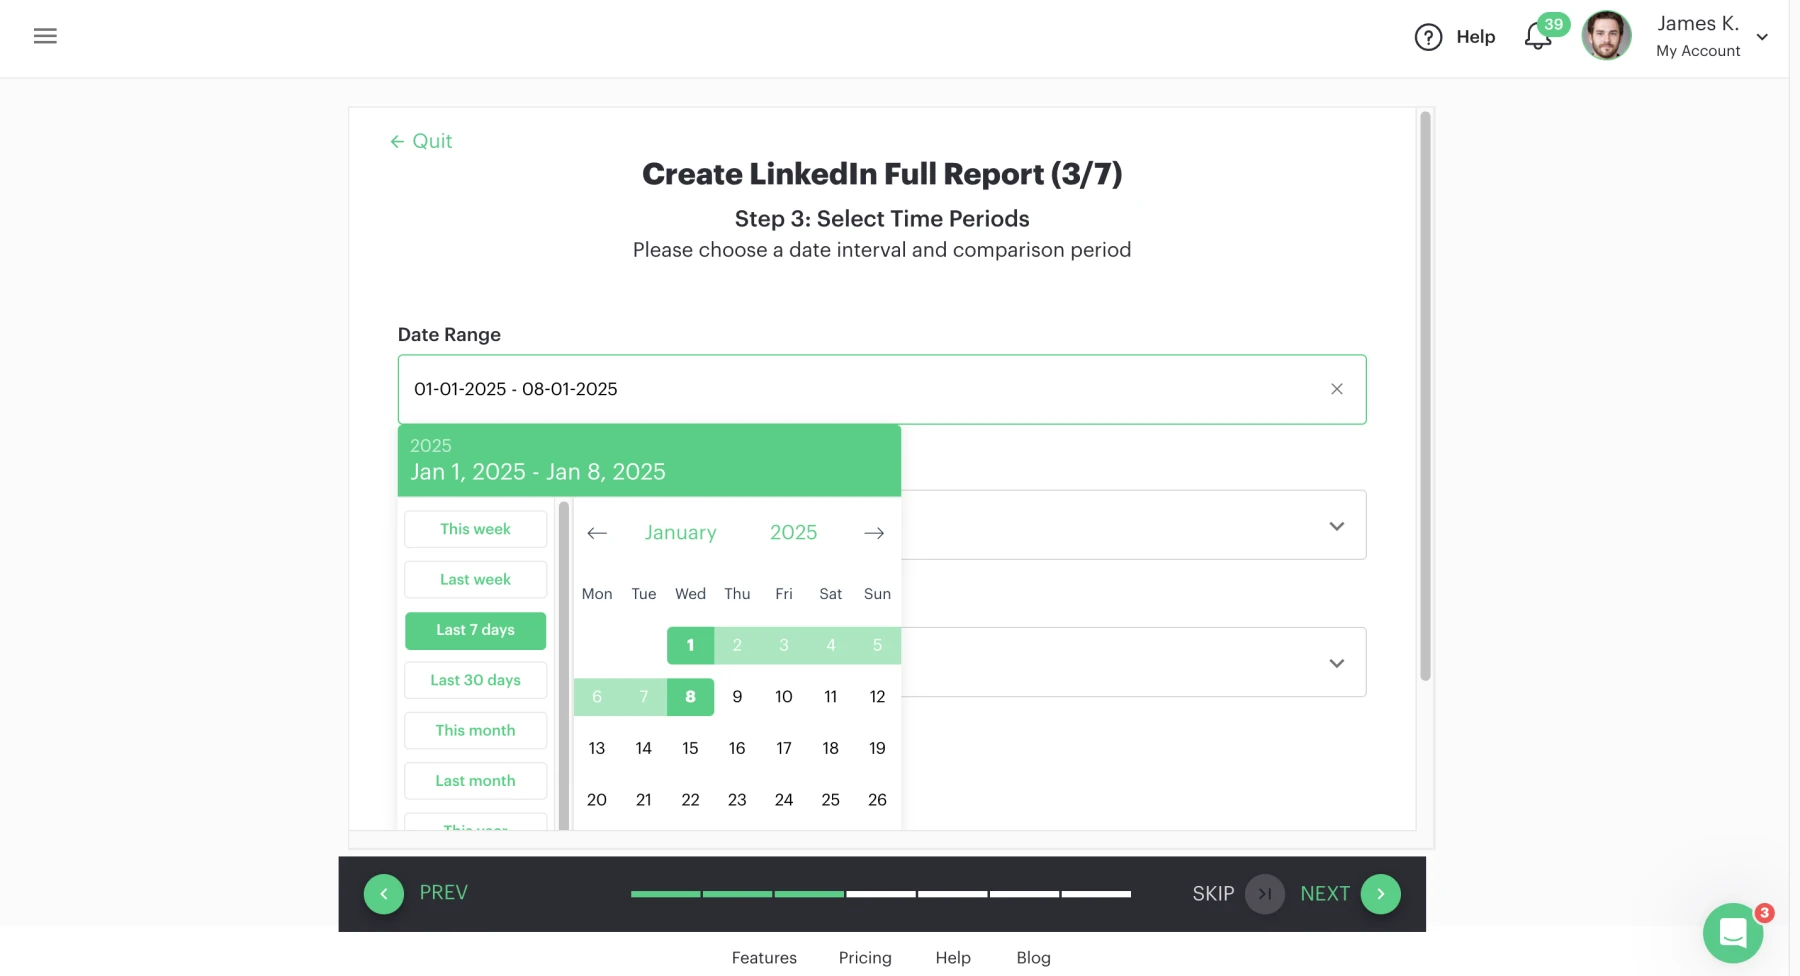
- Choose a date range, such as the last 7 days, last month, or the entire year.
- Select a comparison period to see how performance stacks up against a previous period (e.g., last period or the same time last year).
- Based on your selected date range, choose how data should be broken down:
- Day
- Week
- Month
- Quarter
- Year
-
Apply Styling
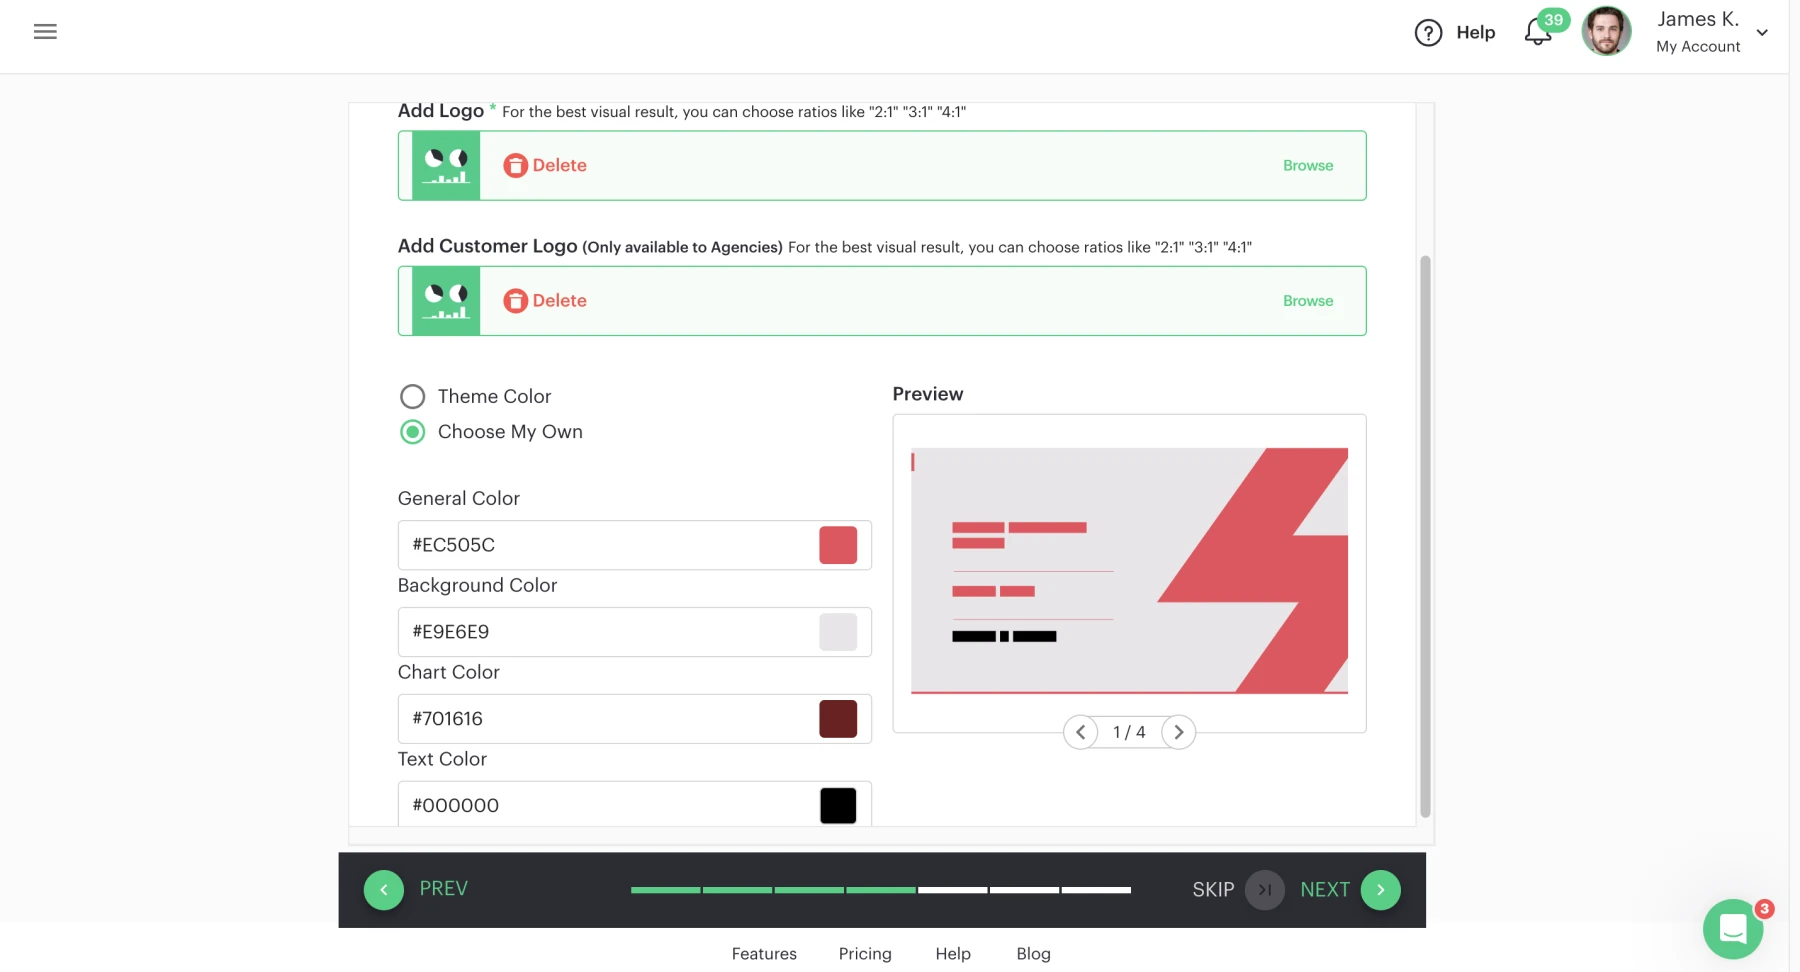
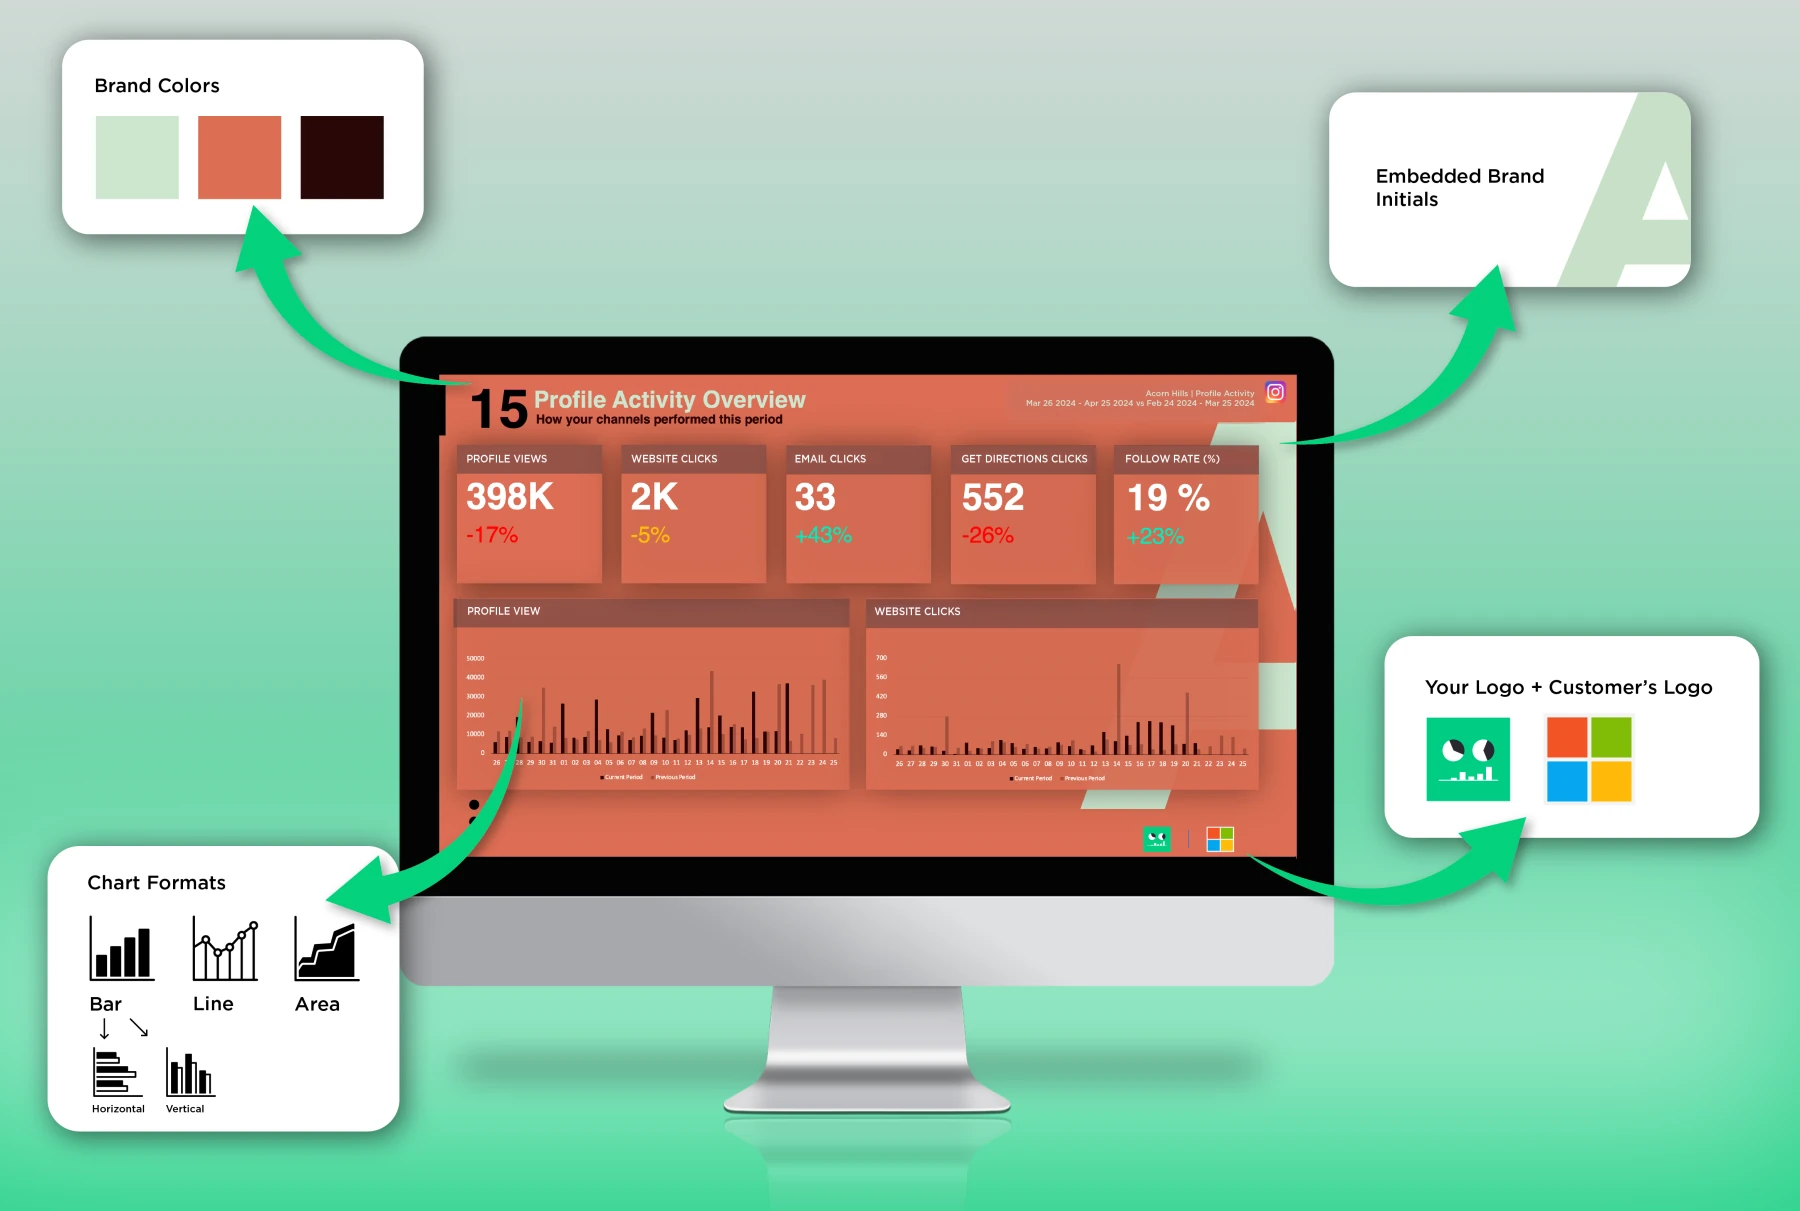
- Add your logo and/or your customer’s logo for a personalized touch.
- Choose a theme color, input your branding preferences (background color, text color, general color, chart color), and ensure your reports match your visual identity.
-
Format Numbers
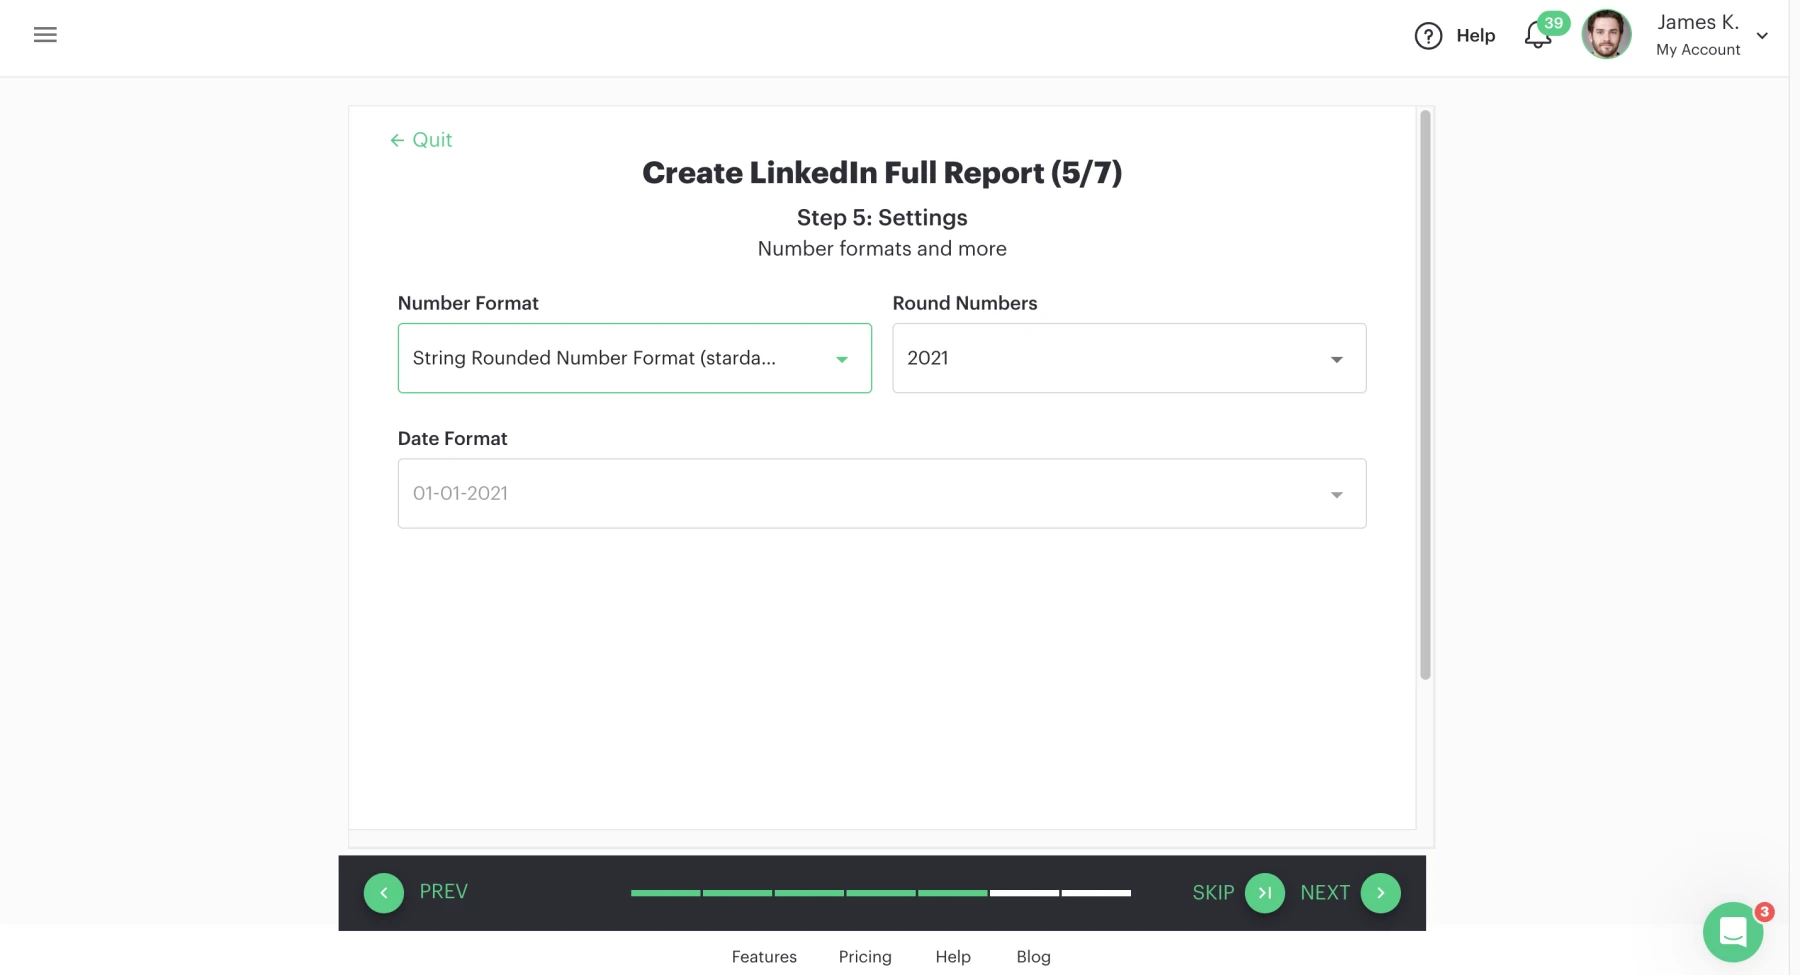
- Decide how you want the numbers displayed: rounded or exact values.
-
Select Chart Type
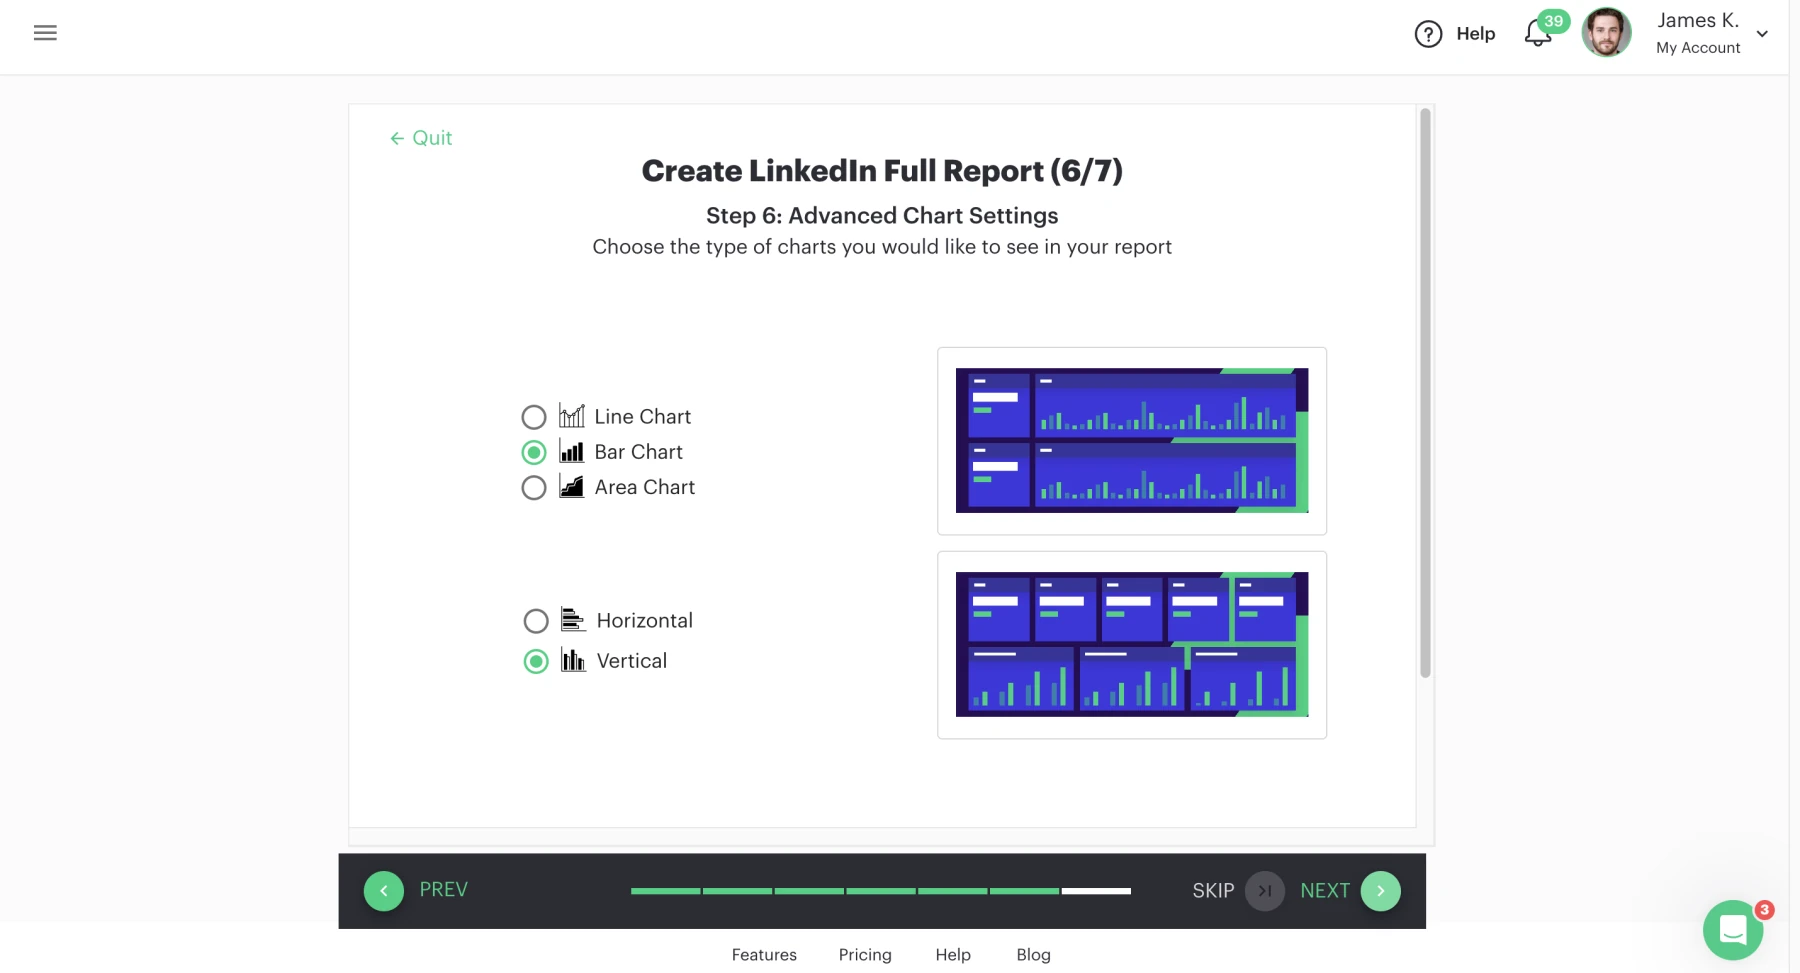
- Pick the chart format that best visualizes your data:
- Line
- Bar (horizontal or vertical)
- Area
- Pick the chart format that best visualizes your data:
-
Generate and Schedule Reports
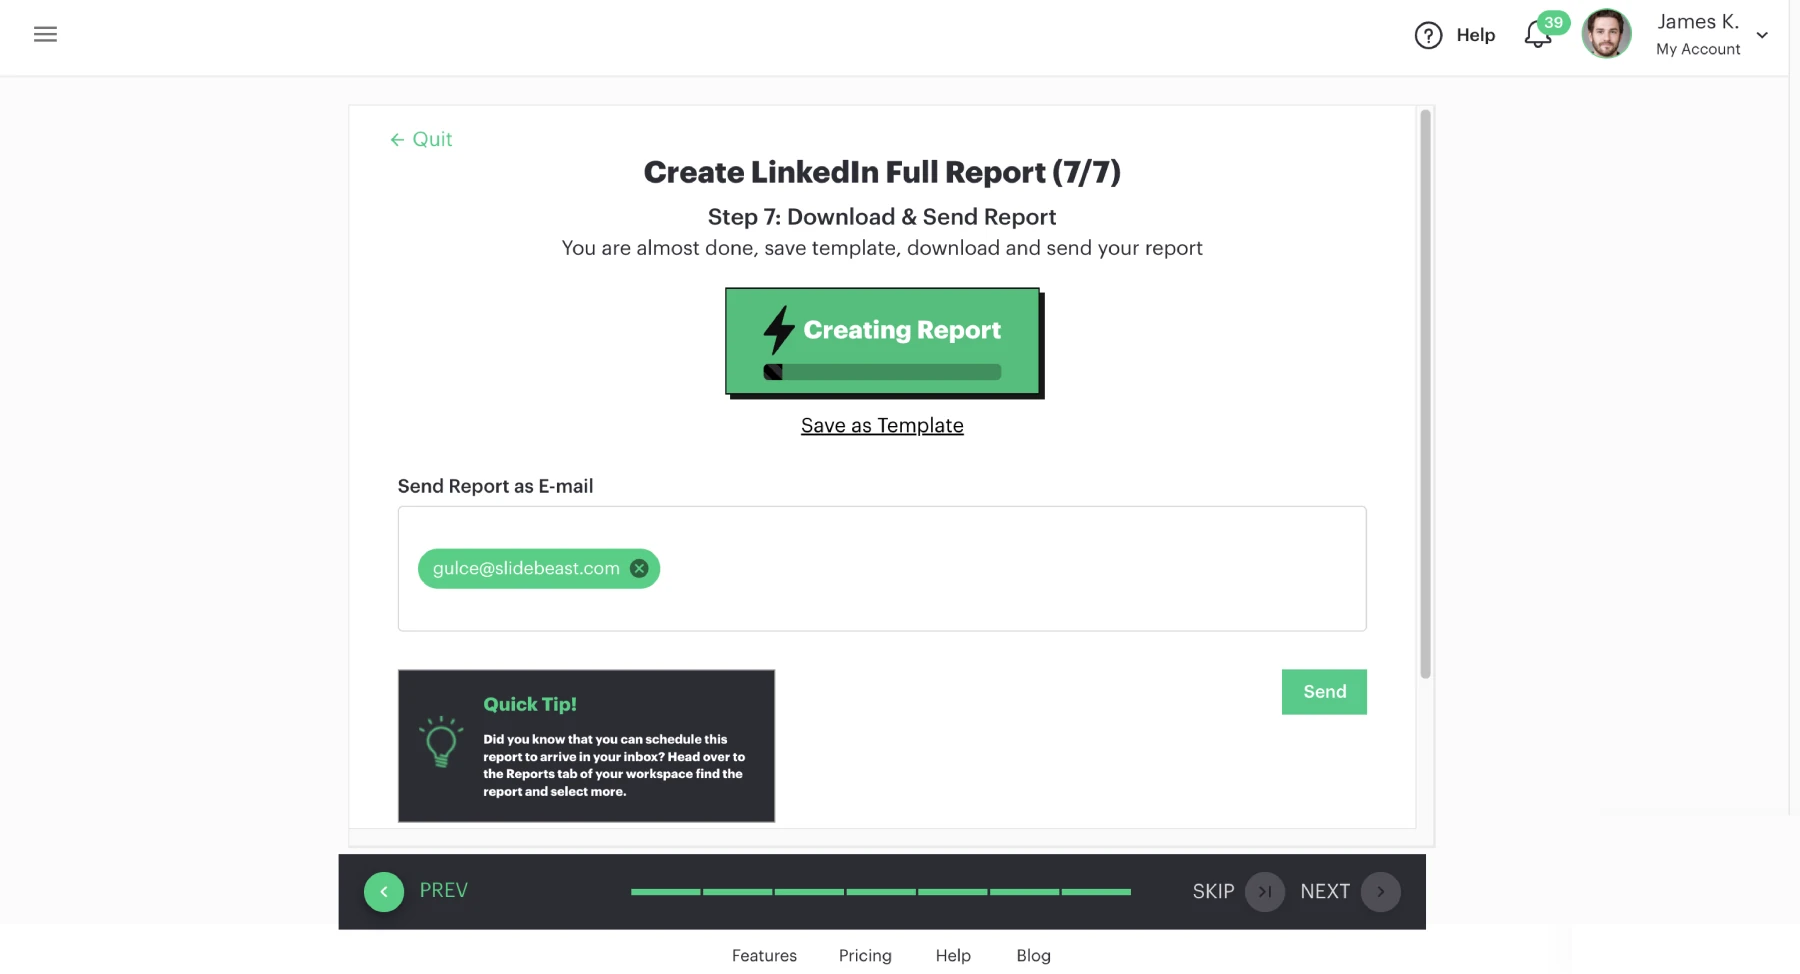
- Click "Create Report" to finalize.
- On the final page, input email addresses for report recipients (you’ll also receive a copy).
By following these steps, Slidebeast helps you transform raw LinkedIn data into polished, insightful reports in minutes.
Understanding Impressions, Shares, Comments, and Clicks
Each metric provides unique insights into your content's performance:
-
Impressions: Indicate how often your content is displayed. High impressions with low engagement may suggest that while your content is being seen, it's not compelling enough to elicit interaction.
-
Shares: Reflect how often your content is disseminated by users, extending its reach. Content with high share counts is typically perceived as valuable or thought-provoking.
-
Comments: Show the level of active engagement and discussion your content generates. A higher number of comments can indicate that your content resonates deeply with your audience, prompting them to express their opinions.
-
Clicks: Measure the effectiveness of your calls to action (CTAs) and the relevance of your content. A low click-through rate might suggest that your CTAs need improvement or that the content isn't aligning with audience interests.
By analyzing these metrics, you can gain a comprehensive understanding of your content's effectiveness and areas for improvement.
Analyzing Engagement Patterns to Improve LinkedIn Strategy
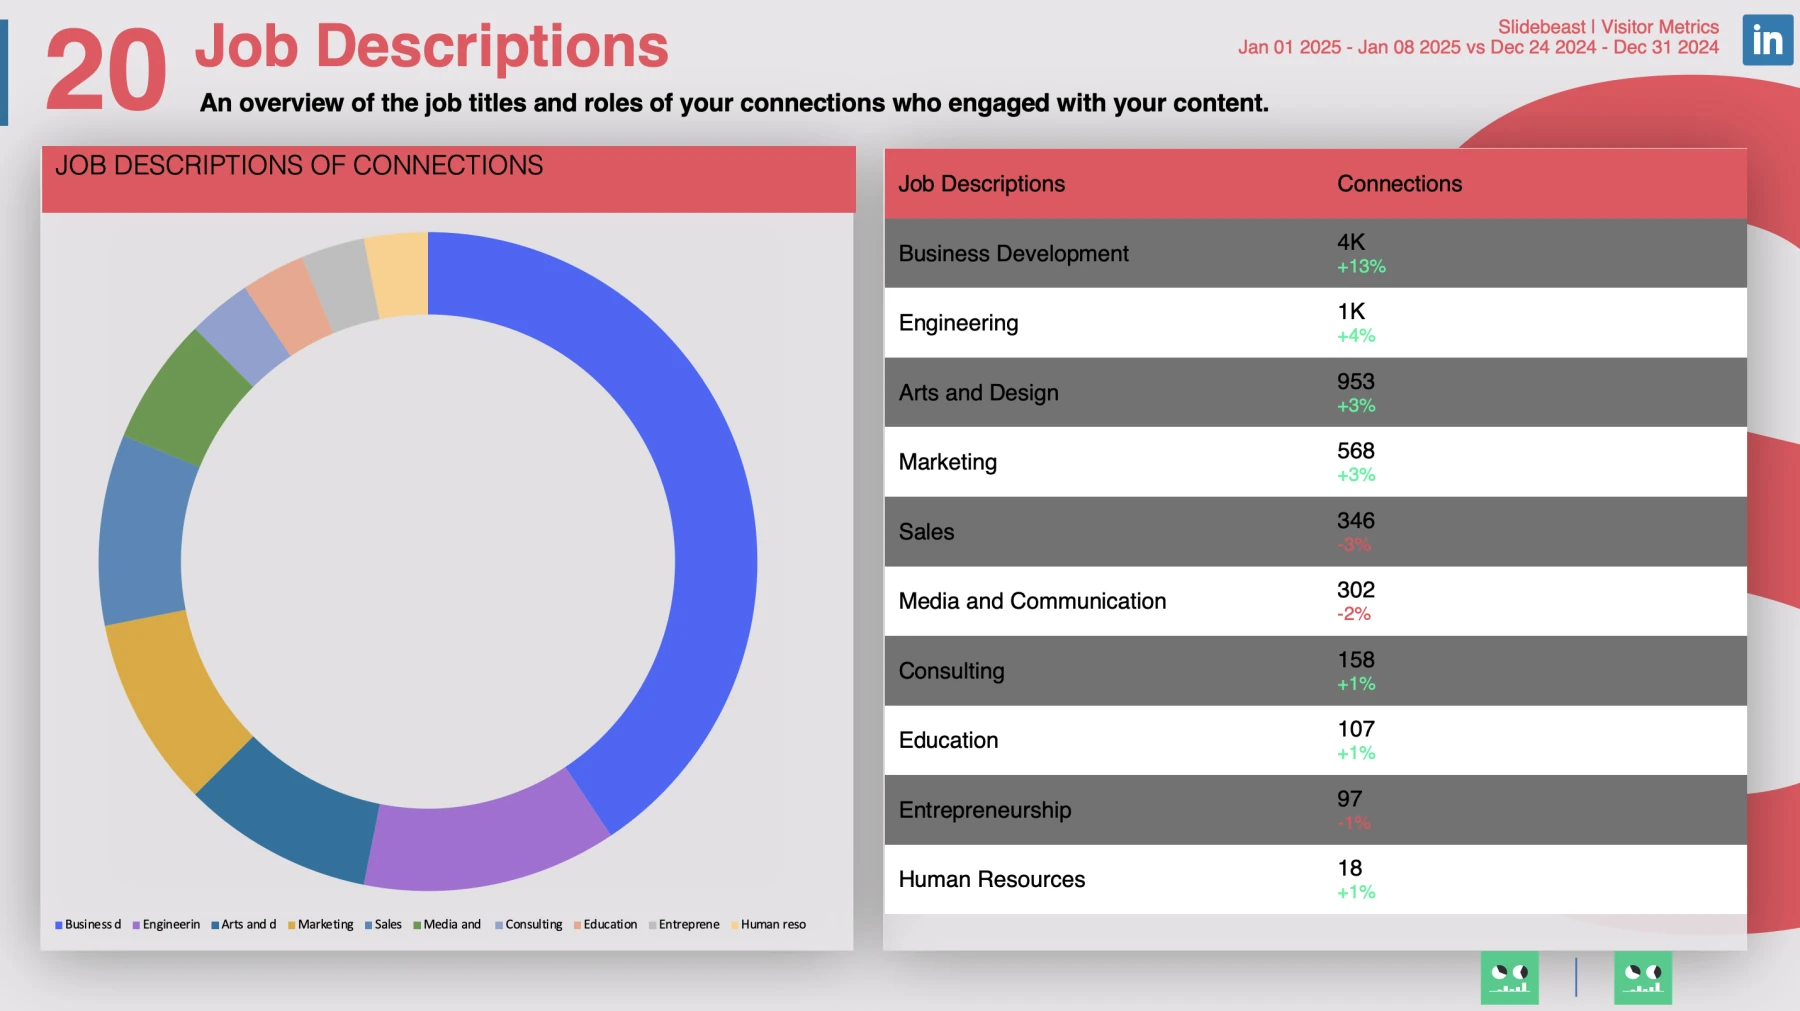
Slidebeast's detailed reports help you identify patterns in your LinkedIn content performance:
-
Optimal Posting Times: Determine when your audience is most active by analyzing engagement metrics over time, allowing you to schedule posts for maximum impact.
-
Content Type Performance: Assess which formats (e.g., articles, videos, images) receive the most engagement, enabling you to tailor your content strategy accordingly.
-
Audience Demographics: Understand the composition of your audience, including job titles, industries, and locations, to create content that appeals directly to them.
These insights enable data-driven decisions to enhance your LinkedIn strategy and foster deeper connections with your audience.
Optimizing Future Content Based on Engagement Insights
The insights gained from Slidebeast’s LinkedIn reports can directly inform your future strategies:
- Replicate High-Performing Posts: Identify the common traits of your top-performing posts (e.g., topic, format, posting time) and replicate those factors.
- Refine Underperforming Content: Analyze posts with low engagement to pinpoint issues, whether it’s weak CTAs, irrelevant topics, or unappealing visuals.
- Experiment with New Formats: Use data to test different content types or approaches, such as carousel posts or short videos.
- Adjust Posting Frequency: Balance quality and quantity based on how your audience responds to your posting schedule.
Measuring and improving content engagement on LinkedIn doesn’t have to be complicated. With Slidebeast, you can streamline the reporting process, uncover actionable insights, and build a winning LinkedIn strategy—all in a matter of minutes.
Take the guesswork out of your LinkedIn content performance. Start your free trial of Slidebeast today!


