Understanding your website’s traffic patterns on an hourly basis can provide invaluable insights, helping you optimize your content delivery and marketing efforts effectively. As Google Analytics has transitioned from Universal Analytics to Google Analytics 4 (GA4), mastering this new platform is essential.
Getting Started with GA4
To begin, log into your Google Analytics 4 account. Navigate to the reporting section accessible from the left-hand menu. This area is your gateway to various reports and insights, including traffic analysis.
Navigating to the Hourly Traffic Report
To effectively analyze hourly traffic data in Google Analytics 4, you'll want to utilize the "Explore" feature. This tool allows you to drill down into specific aspects of your data with great flexibility.
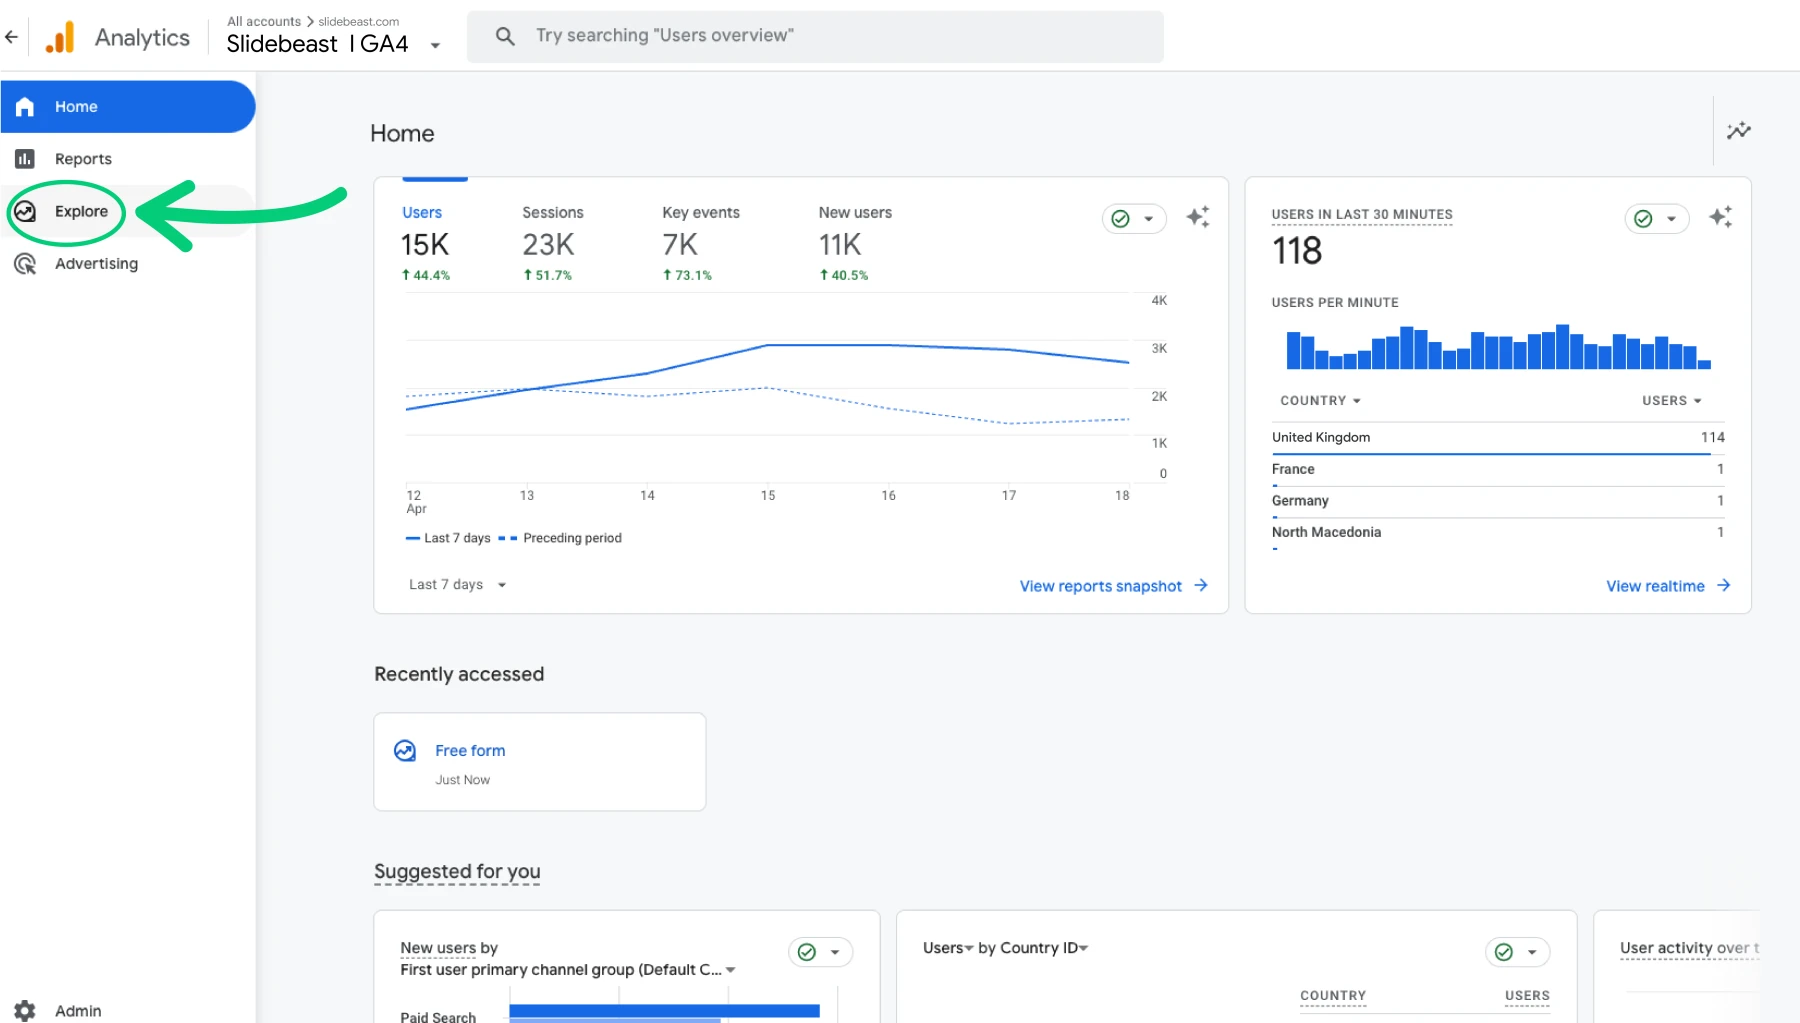
Access the Explore Section
Log into your GA4 property and click on the "Explore" tab on the left-hand menu.
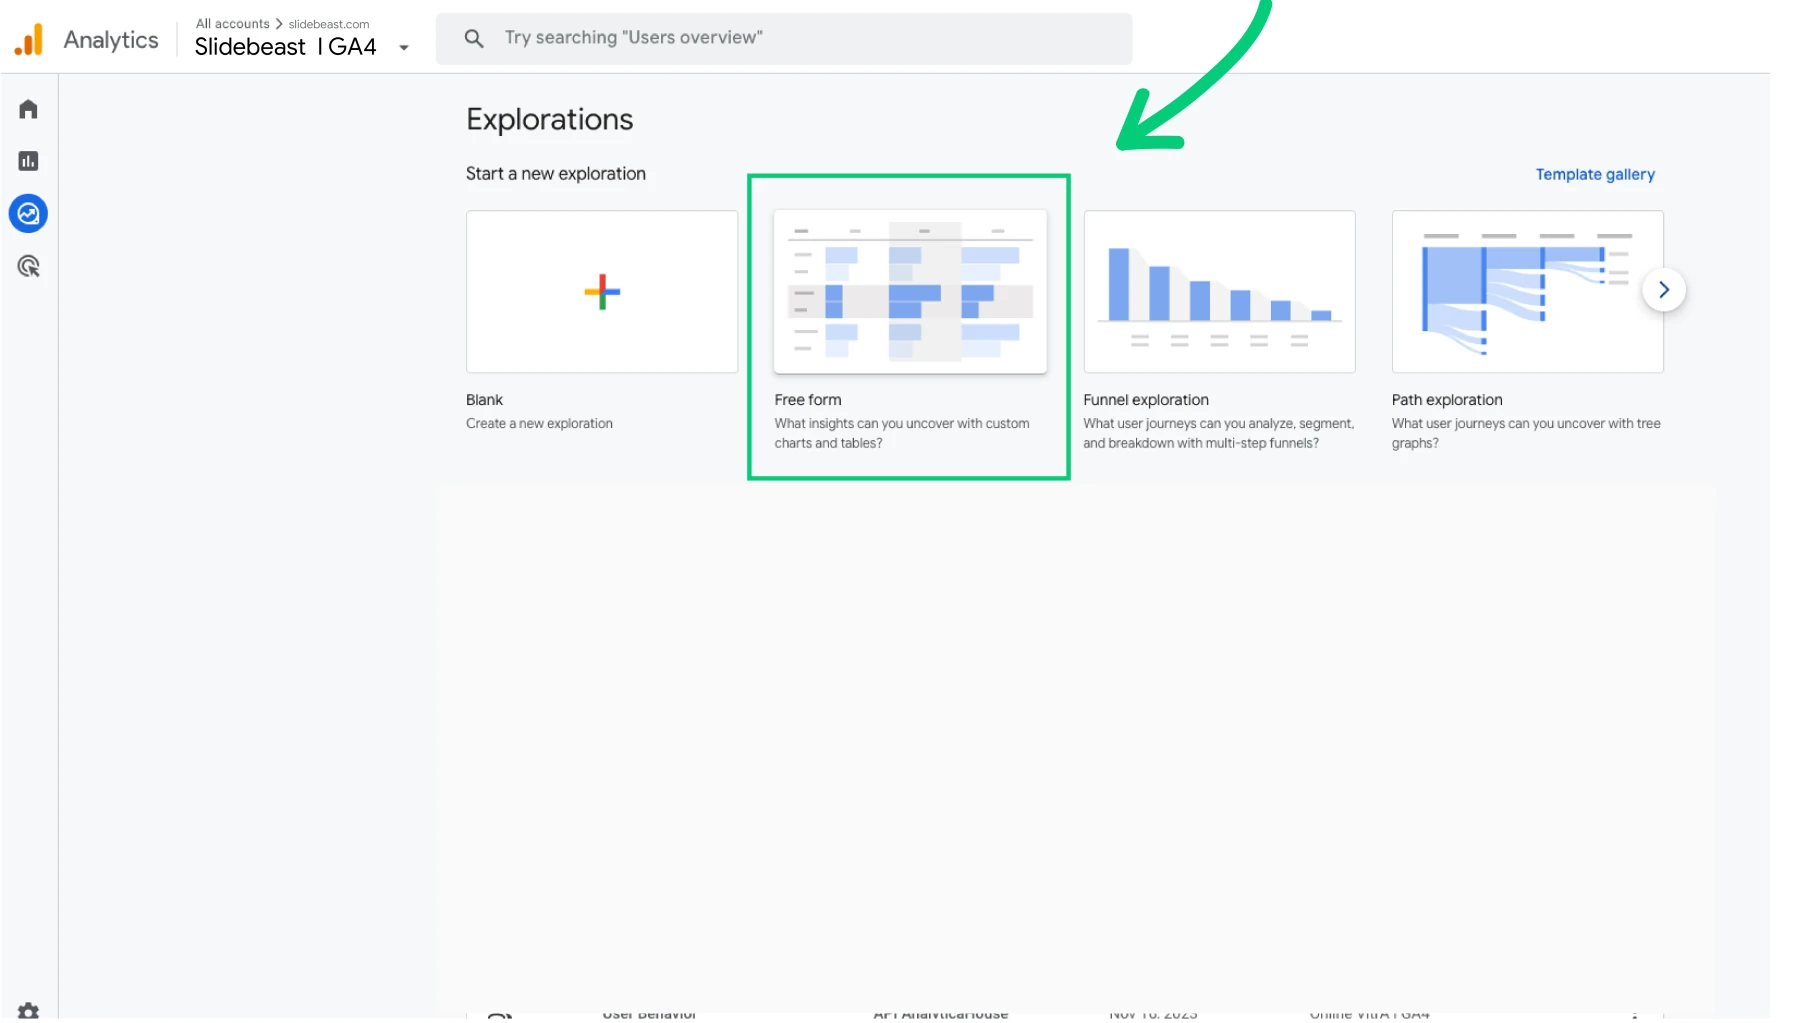
Create a Free Form Report: Select "Free Form" from the options available to start a new exploration.
Set Up Your Dimensions and Metrics
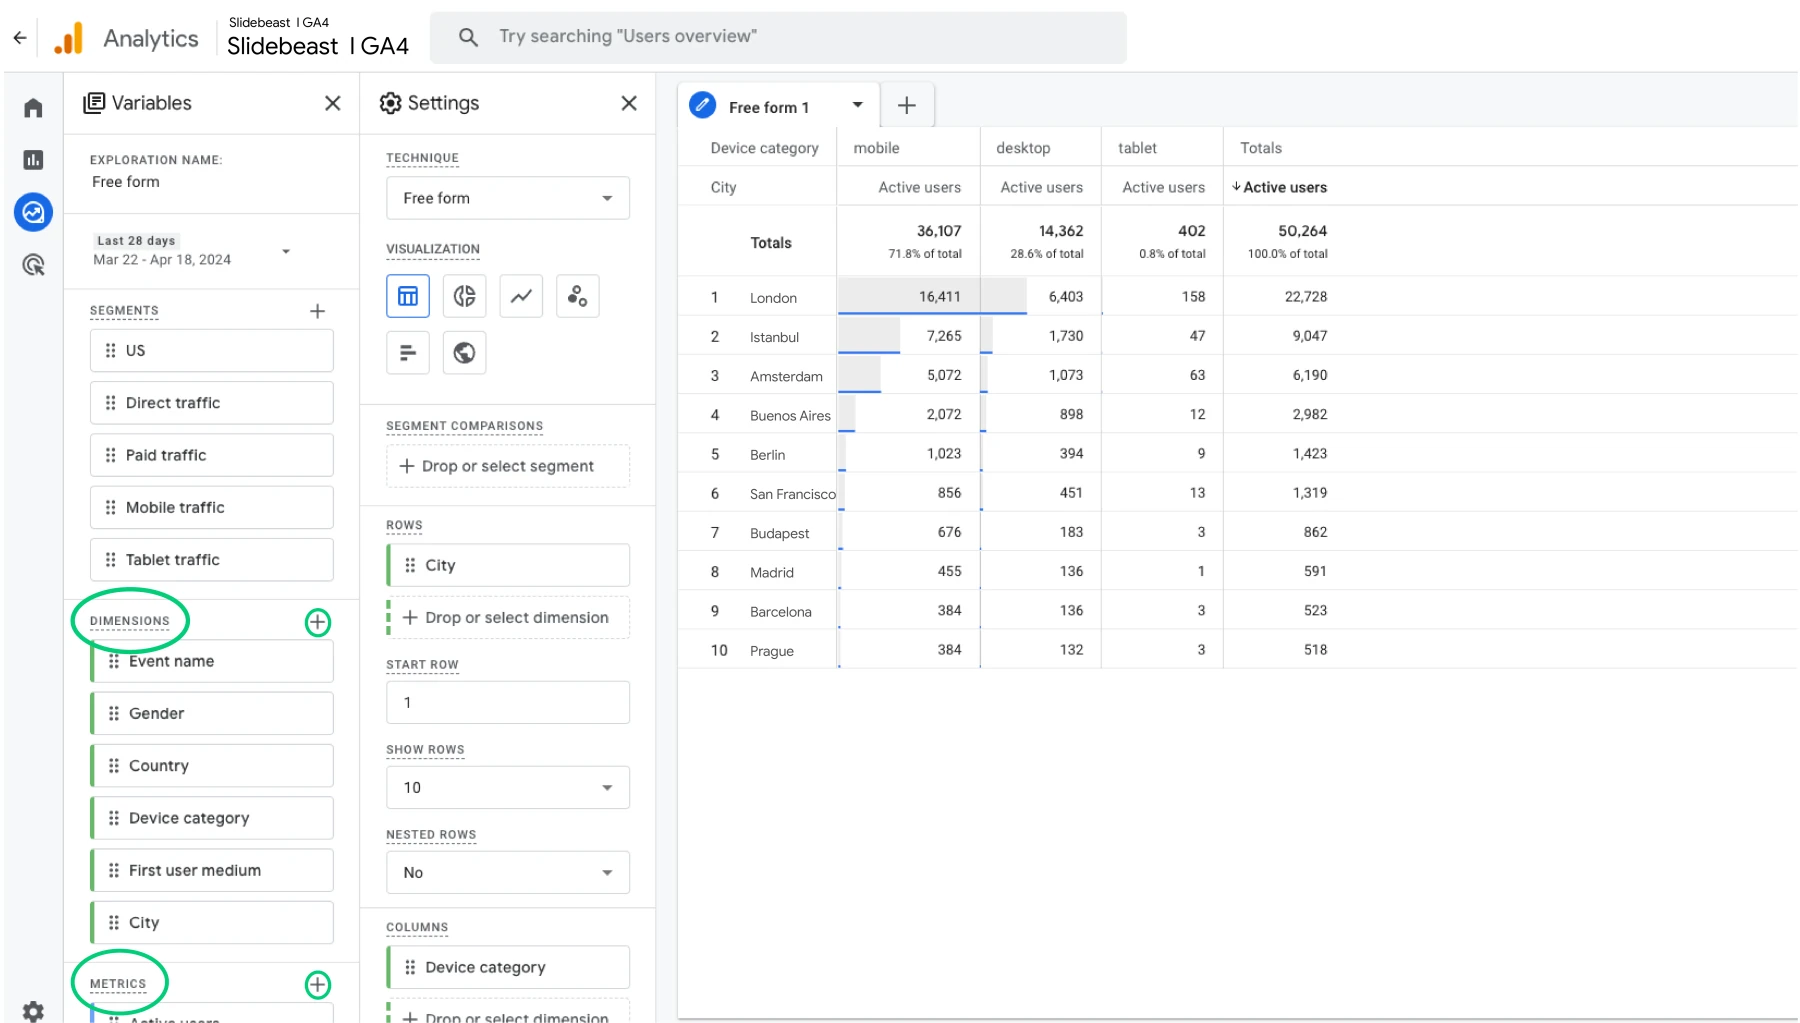
By default, you would have segments, dimensions and metrics you can choose in the left menu.
For dimensions, add "Date and Hour" to view data on an hourly basis. Add "Sessions" as a metric to track the number of sessions during each hour.
To simplify your chart, ensure to remove any unnecessary metrics and dimensions. Then, organize your selected data by dragging the 'Date and Hour' as dimensions and 'Sessions' as metrics into the appropriate rows, columns, and values fields to begin visualizing your data.
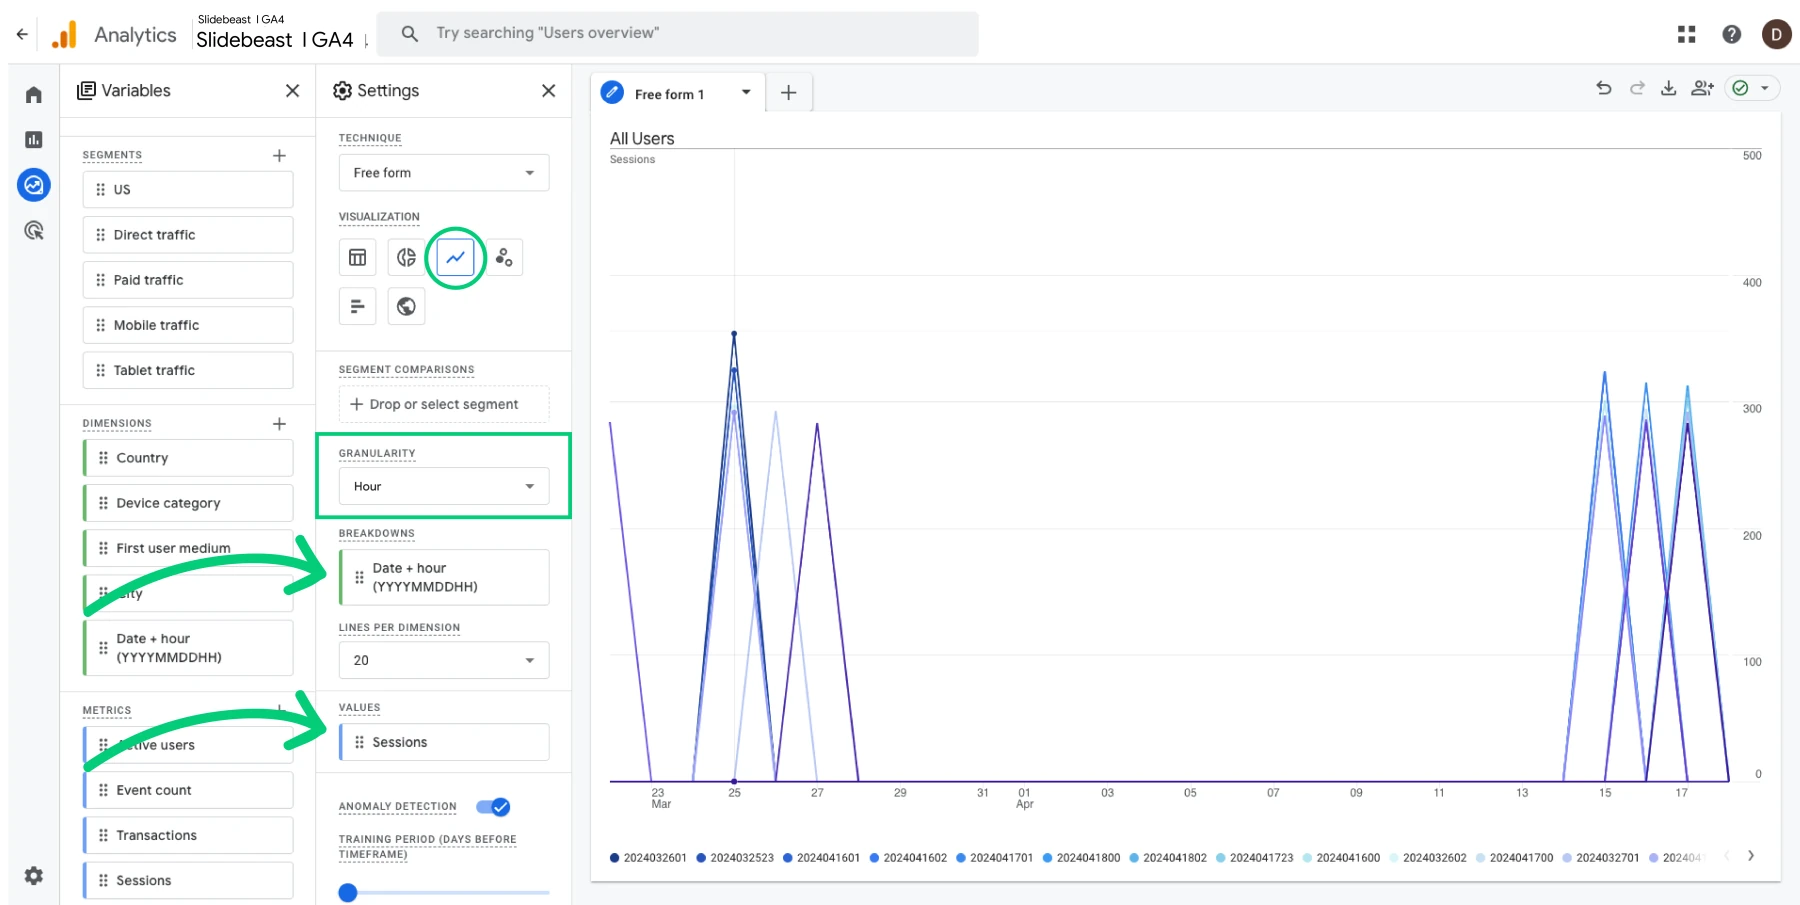
Opt for a line chart to visualize the changes in traffic over time clearly. This will help you see the traffic flow and identify peak hours effectively.
Analyze and Interpret the Data:
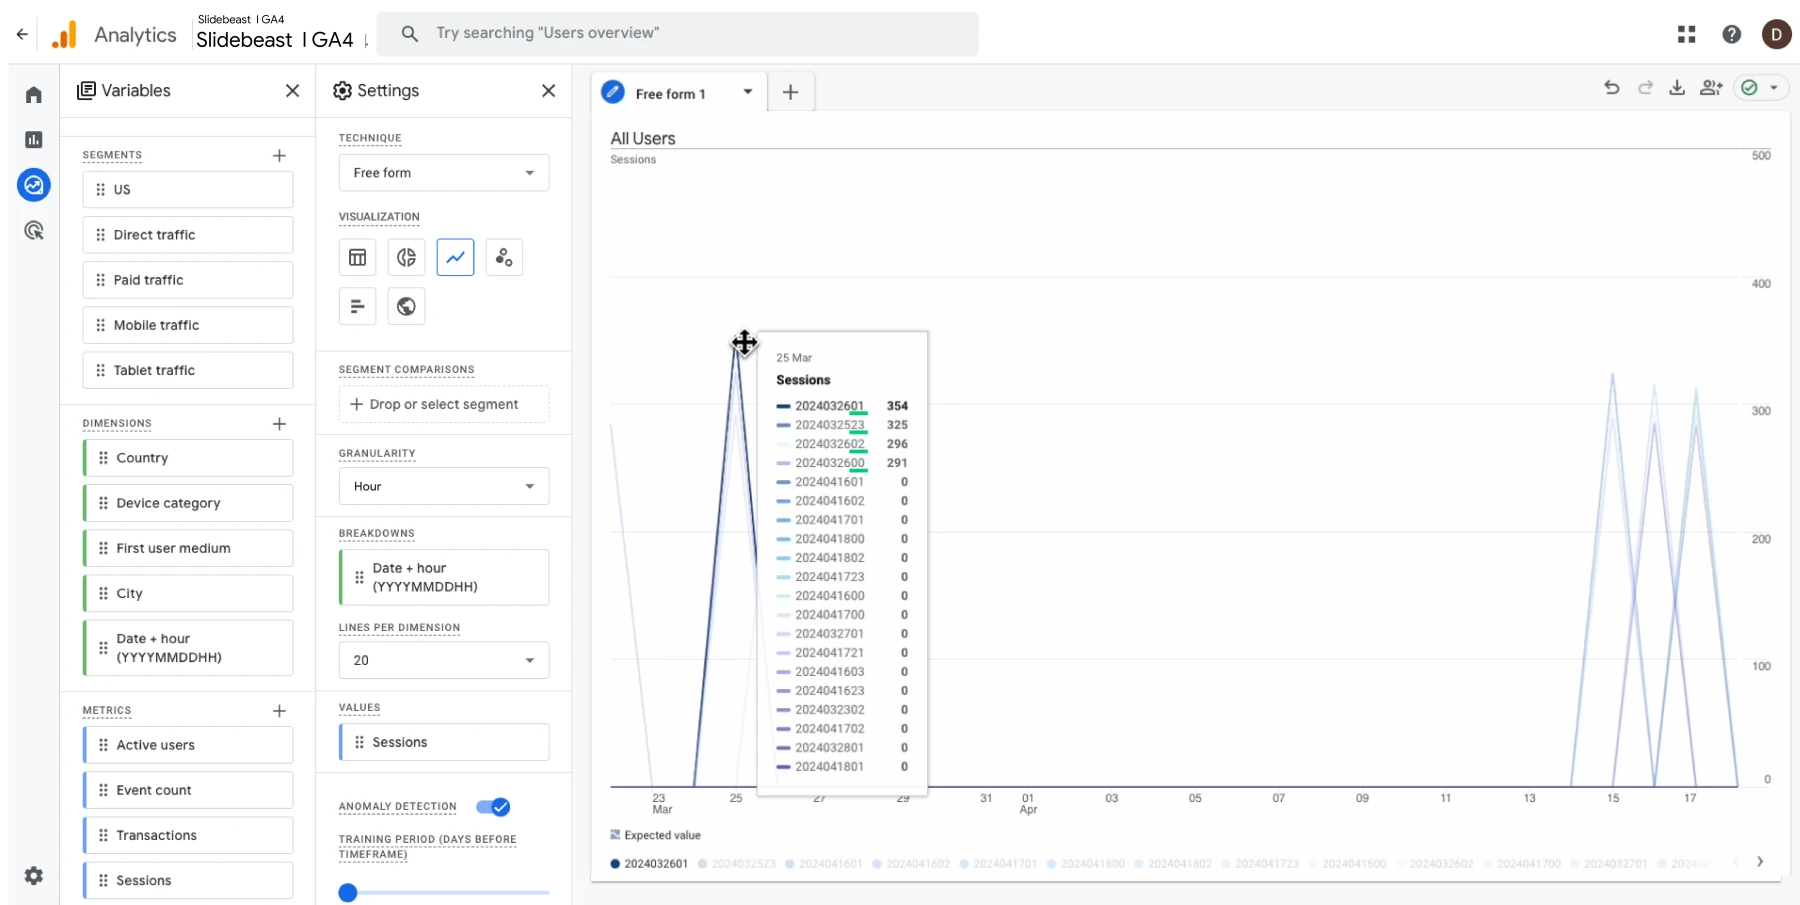
Examine the chart to discern patterns and fluctuations in hourly traffic.
Use this insight to determine optimal times for content updates, advertisements, or other critical web activities.
Analyzing Hourly Traffic Data
The custom graph presents data in a clear, hour-by-hour format. Look for peaks and troughs in the graph to identify when your site experiences the most and the least traffic. Understanding these patterns helps you pinpoint the best times for publishing content or scheduling marketing campaigns.
For more detailed analysis, consider segmenting the traffic by source or user demographics. This can reveal specific trends, like higher morning traffic from social media or evening visits from direct links.
Utilizing the Data for Optimization
With a clear understanding of your site's hourly traffic, tailor your strategies to match user behavior. For instance, if your site garners more visits during the early evenings, schedule important posts or emails around these times to maximize engagement. Similarly, if weekends show a dip, reduce critical activities during these periods.
Slidebeast Day and Time Performance Report
To enhance your data reporting and analysis, Slidebeast offers a versatile solution with its extensive range of pre-made Google Analytics 4 templates and a custom option that allows you to drag and drop report sections. This feature lets you tailor your presentations to meet specific needs, providing a streamlined experience for creating impactful and professional presentations.
Slidebeast not only simplifies the creation of reports but also accelerates the process by providing quick access to a wealth of GA4 data. Whether you're looking at user engagement, e-commerce performance, or traffic sources, Slidebeast can compile all relevant data into a customizable, white-labeled report in seconds. This powerful tool ensures that you have the insights you need at your fingertips, ready to be shared with stakeholders or clients in a visually appealing format.
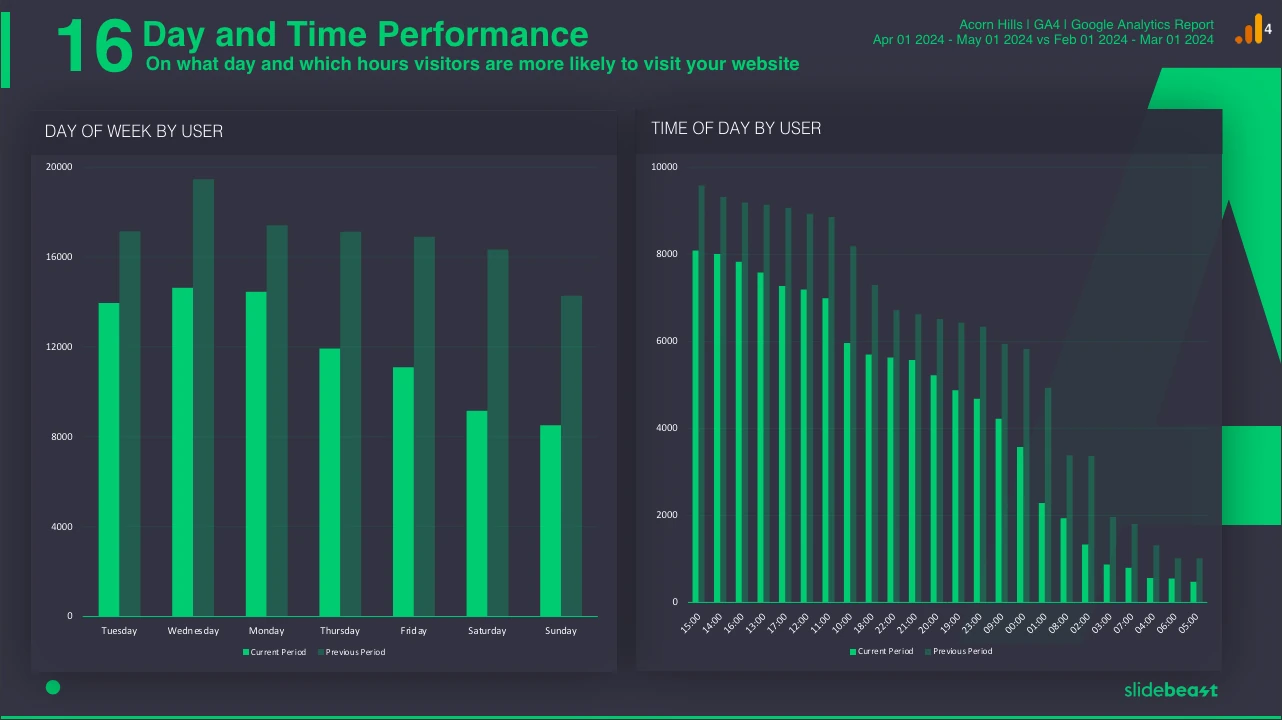
Additionally, we are excited to highlight our new Google Analytics 4 Audience report template, which includes an analysis of Day & Time Performance. This template is designed to help you dive deeper into how your audience interacts with your content throughout different times of the day and week, offering valuable insights that can drive more targeted marketing strategies.
By leveraging Slidebeast's advanced features, you can save significant time on report preparation and focus more on leveraging strategic insights to drive business success. Start your free trial today—no credit card required! Experience firsthand how Slidebeast transforms complex data into customizable, insightful presentations that can propel your business forward.