Google Analytics 4 Reporting Tool
From Startups to Agencies See what Slidebeast’s Google Analytics 4 Reporting can do for you
The most user-friendly solution for creating Google Analytics 4 reports
Slidebeast's Google Analytics 4 reports provide a comprehensive overview of web performance, presenting essential data and visual insights in a structured format, akin to a compelling presentation.
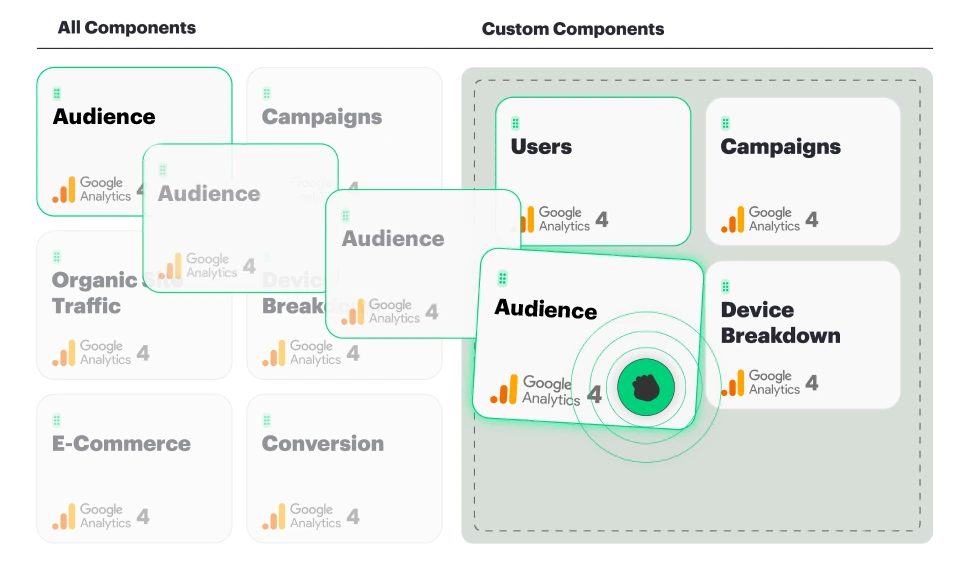
Generating a report is a breeze. Simply drag and drop vital data sets
Tailor your report to meet your specific data requirements such as your Ads or E-commerce business by effortlessly adding or removing sections as needed.
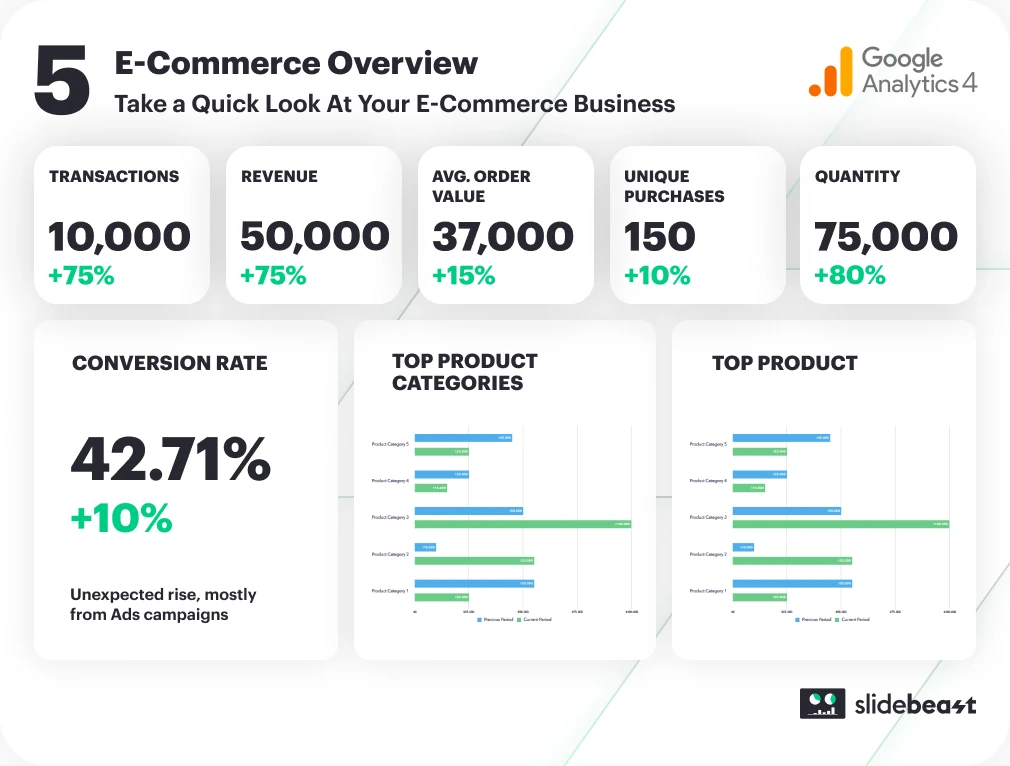
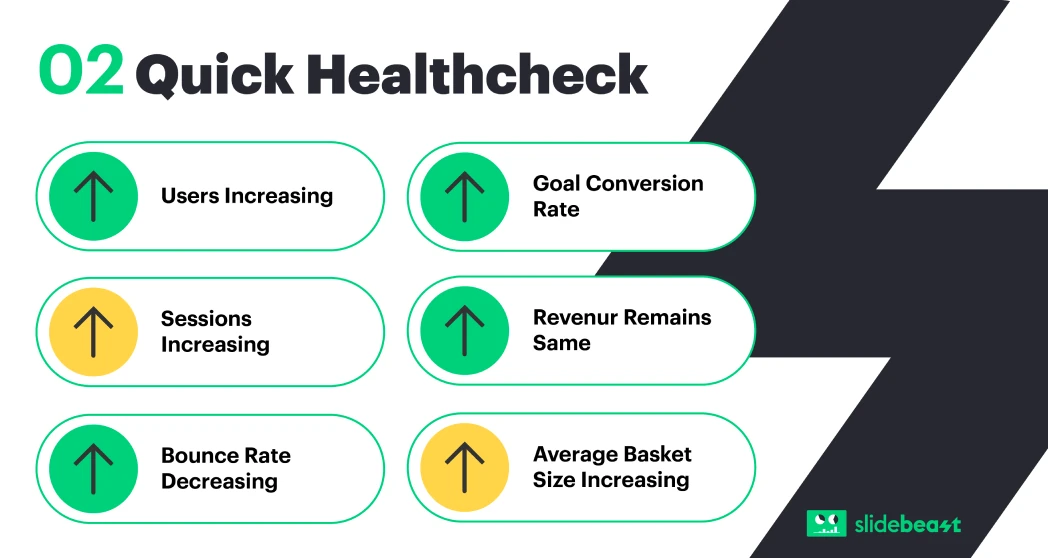
Swiftly assess your performance with a brief snapshot
If you are on the go and do not want to delve into details, Slidebeast provides concise yet comprehensive slides for quick insights
Getting Started with Slidebeast Google Analytics 4 Reporting
Slidebeast does not use blank canvases or dashboards, every report page is pre-structured with Google Analytics 4 data and ready to be downloaded & analyzed.
See how below
Connect your Google Analytics 4 Account
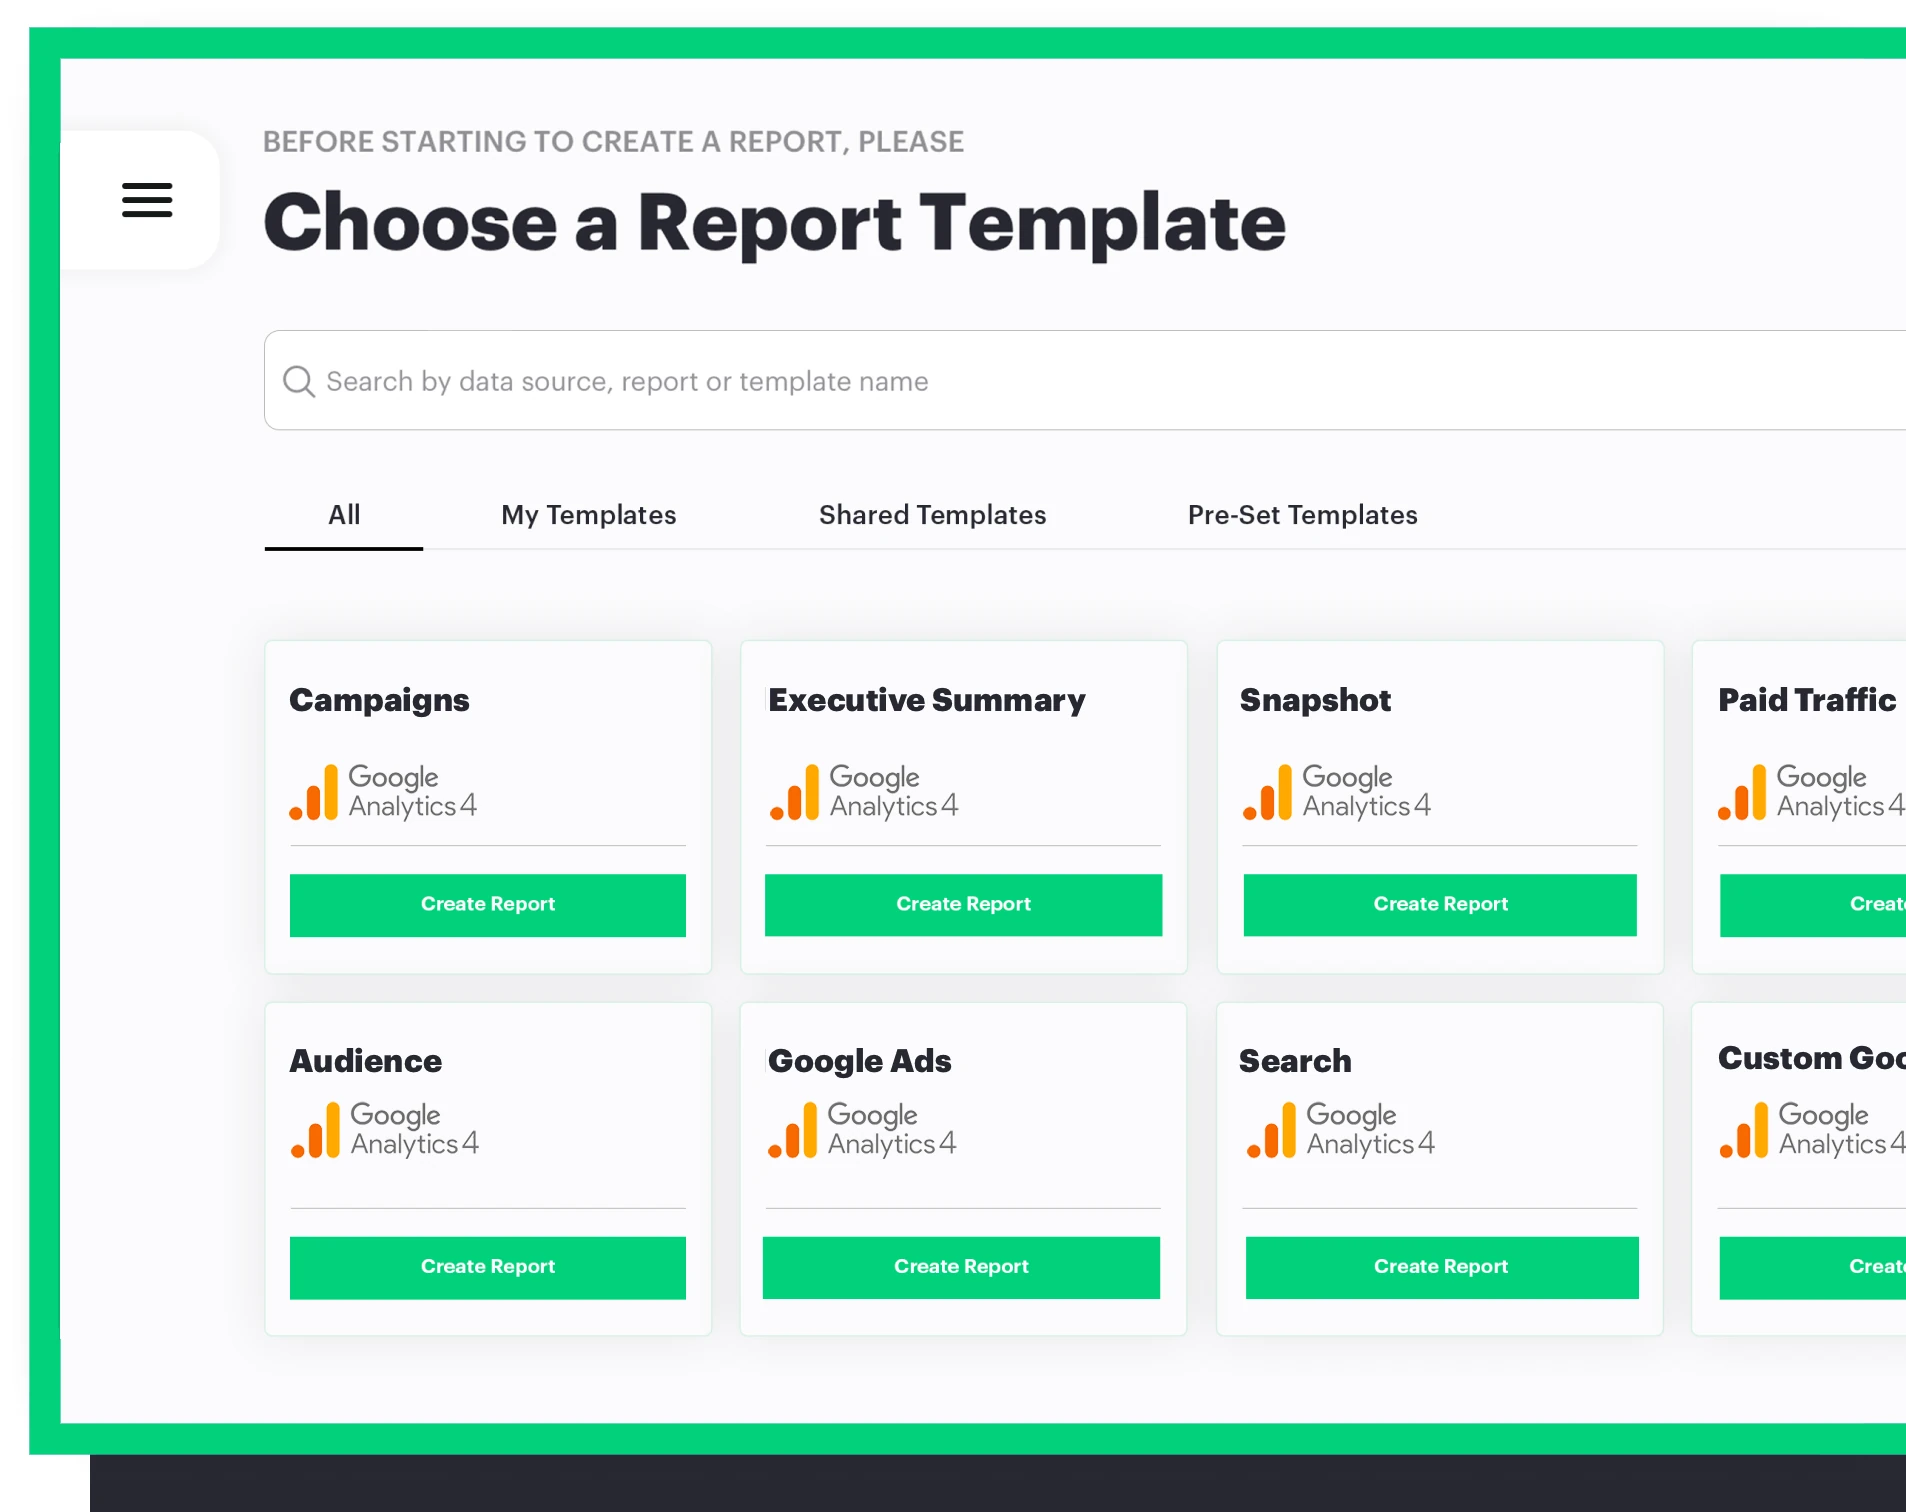
Pick a pre-made reporting template or start from scratch
Follow the Create Report Wizard steps
Download & Schedule your report

Google Analytics 4 Report Sections You Can Get With Slidebeast
We take pride in our reporting approach. Slidebeast provides 15 diverse sets of data sections to ensure you gain all the insights you require for your Google Analytics 4 reporting.
- OVERVIEW
- USERS & BEHAVIOR
- E-COMMERCE
- TRAFFIC QUALITY
- GOOGLE ADS*
- TECHNOLOGY
- SITE CONTENT
- SITE SEARCH
- GOOGLE SEARCH CONSOLE*
- DEMOGRAPHICS
- GEOGRAPHY
- EVENTS
- CAMPAIGNS
- INSIGHTS
- GLOSSARY
*Accounts should be linked to Google Analytics
No time to create a report from scratch?
See Some Powerful Google Analytics 4 Metrics
In each data section, you will find indispensable data that holds significant importance for your business. Rest assured, we've meticulously included every essential detail, leaving no pertinent information overlooked.

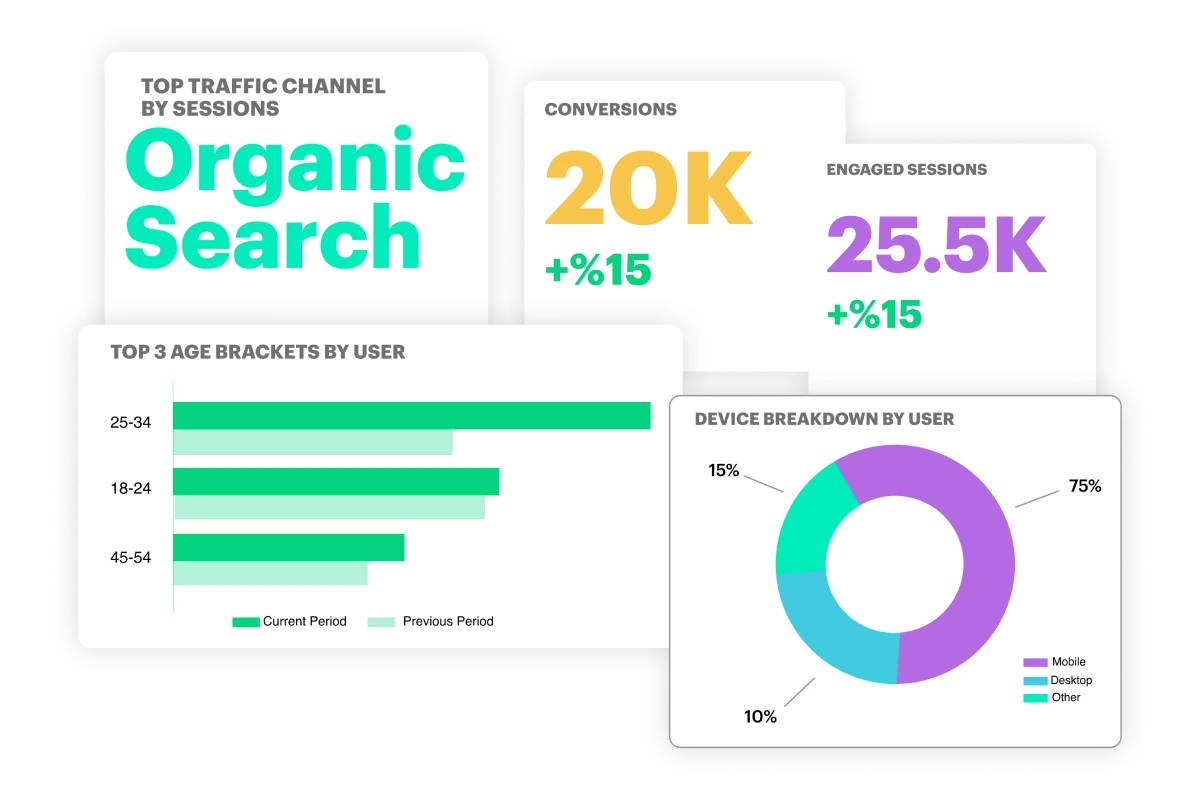
A Quick Look at Performance
- Users, Sessions, Views
- Engagement Rate
- Ad Cost
- Conversions
- New VS Returning User
- Device Breakdown
- Top 3 Interests
- Top Traffic Channels
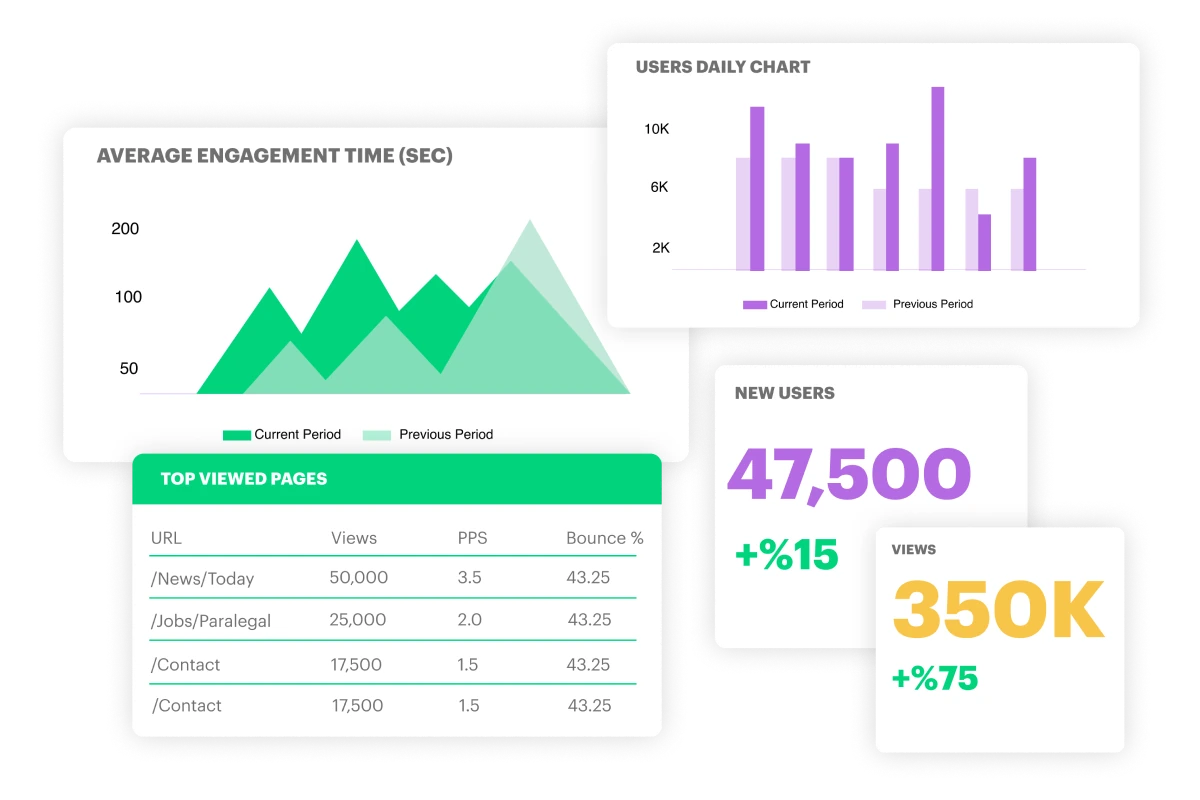
Understanding User Engagement
- Users, New Users
- Sessions
- Engagement Rate
- Views
- Pages Per Session
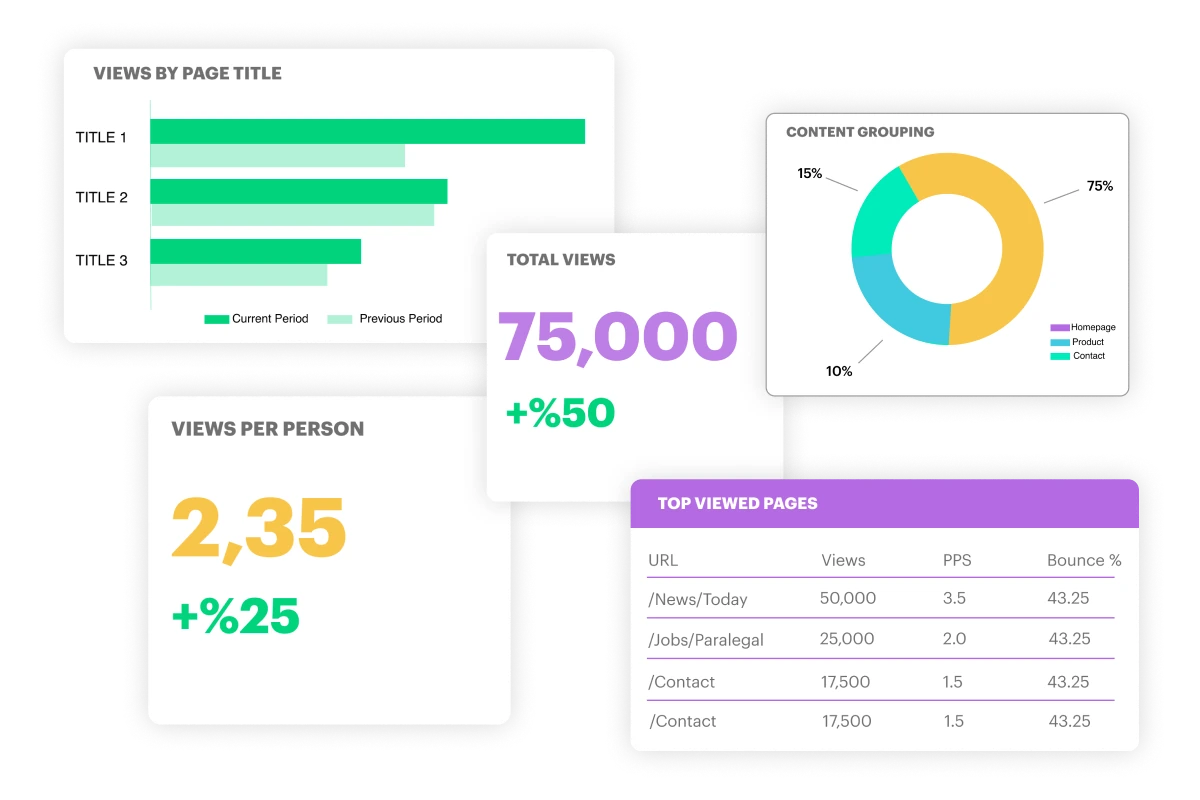
- Content Groups
- Top Viewed Pages and Screens
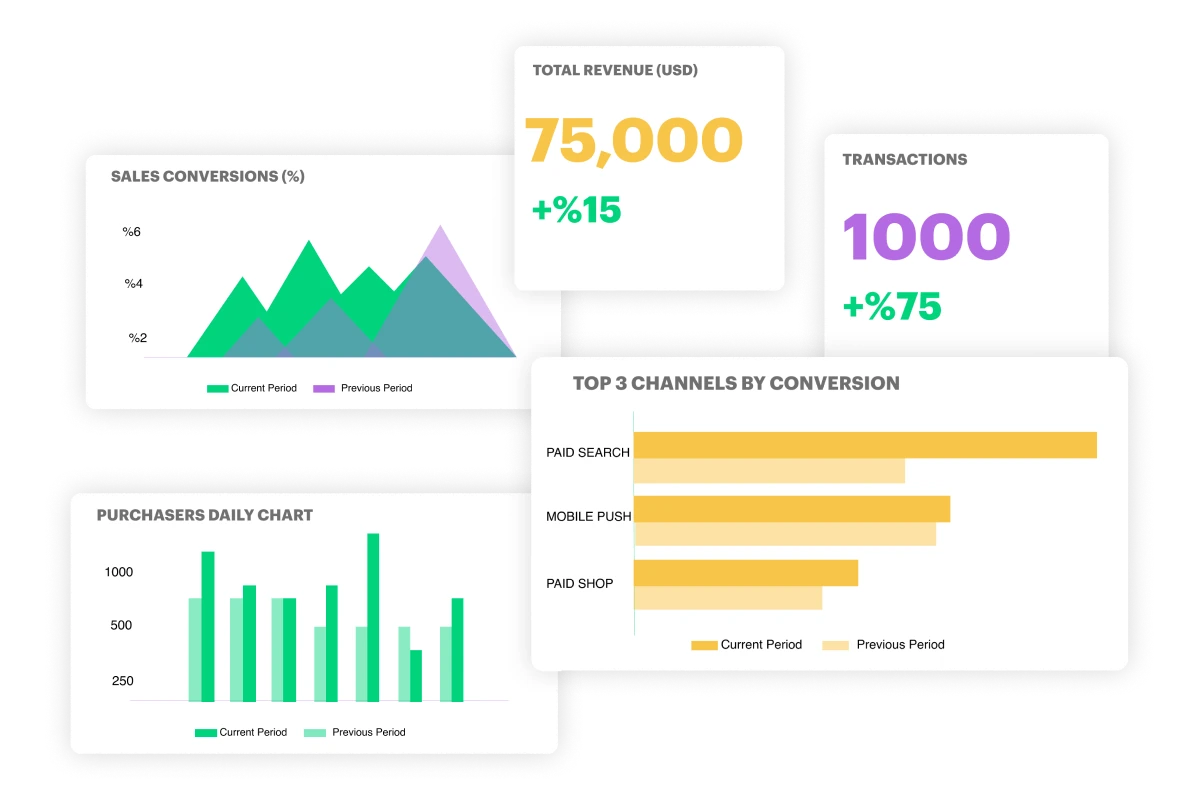
Depths of E-Commerce
- Transactions
- Total Revenue
- Top Devices by Revenue
- Sessions Conversion Rate
- Item Performance
- Brand Performance
- Sales Performance
- Add to Cart
- Promotions
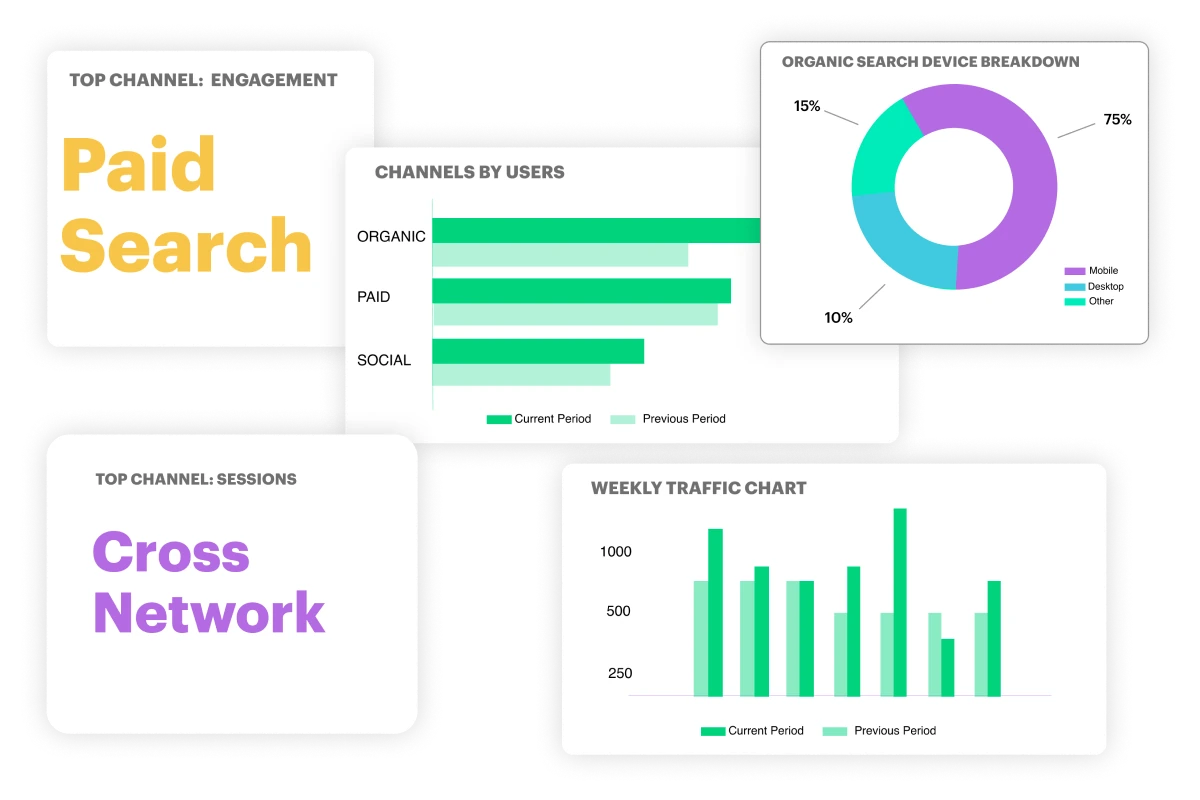
Insights into Site Traffic
- Overview of Default Channels
- Channel Breakdown
- Acquisition Table
- Top Landing Pages
- Organic Traffic Quality
- Organic Landing Pages
- Direct Traffic Quality
- Organic Landing Pages
- Cross Network Traffic Quality
- Paid Queries
Quick Dive into Site Content
- Total Views
- Conversions
- Bounce Rate
- Views Per Session
- Sessions Per User
- Most Visited Pages Top 10
- Most Visited Pages Mobile Top 10
- Most Visited Pages Desktop Top 10
- Most Exited Pages Top 10
Exploring the Audience
- Top Audience
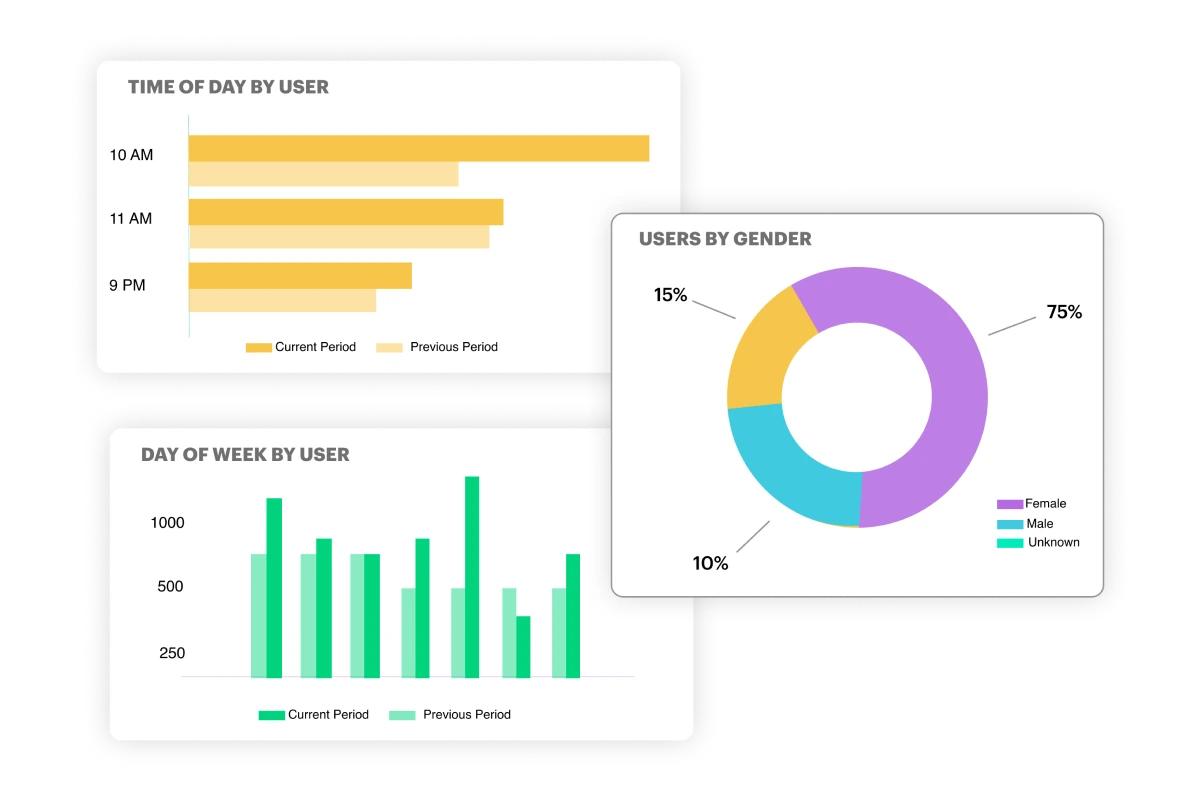
- Users by Age Breakdown
- Users by Gender
- Age Performance
- Gender Performance
- Audience Performance
- Interest Performance
- Day & Time Performance

Create Report Wizard will make everything super easy for you
Create Report Wizard, a tool designed to streamline the report process, helps our clients at every step of the report creating journey, ensuring a seamless and highly efficient experience.
Tailor made reports

Tailor made reports
Get tailor made reports just for you or for your company. Get in touch with us to see how we can make your white label reporting needs possible.
Get in touch