Free Report Sample
a Slidebeast report is made out of different sections and data sets, in order to better understand our approach, download a full demo report and see what we can offer
DOWNLOAD ALL REPORTS


Slide Breakdown
Slidebeast presentations are made in sections. Each section represents a specific data group and you can easily customize these sections according to your needs.
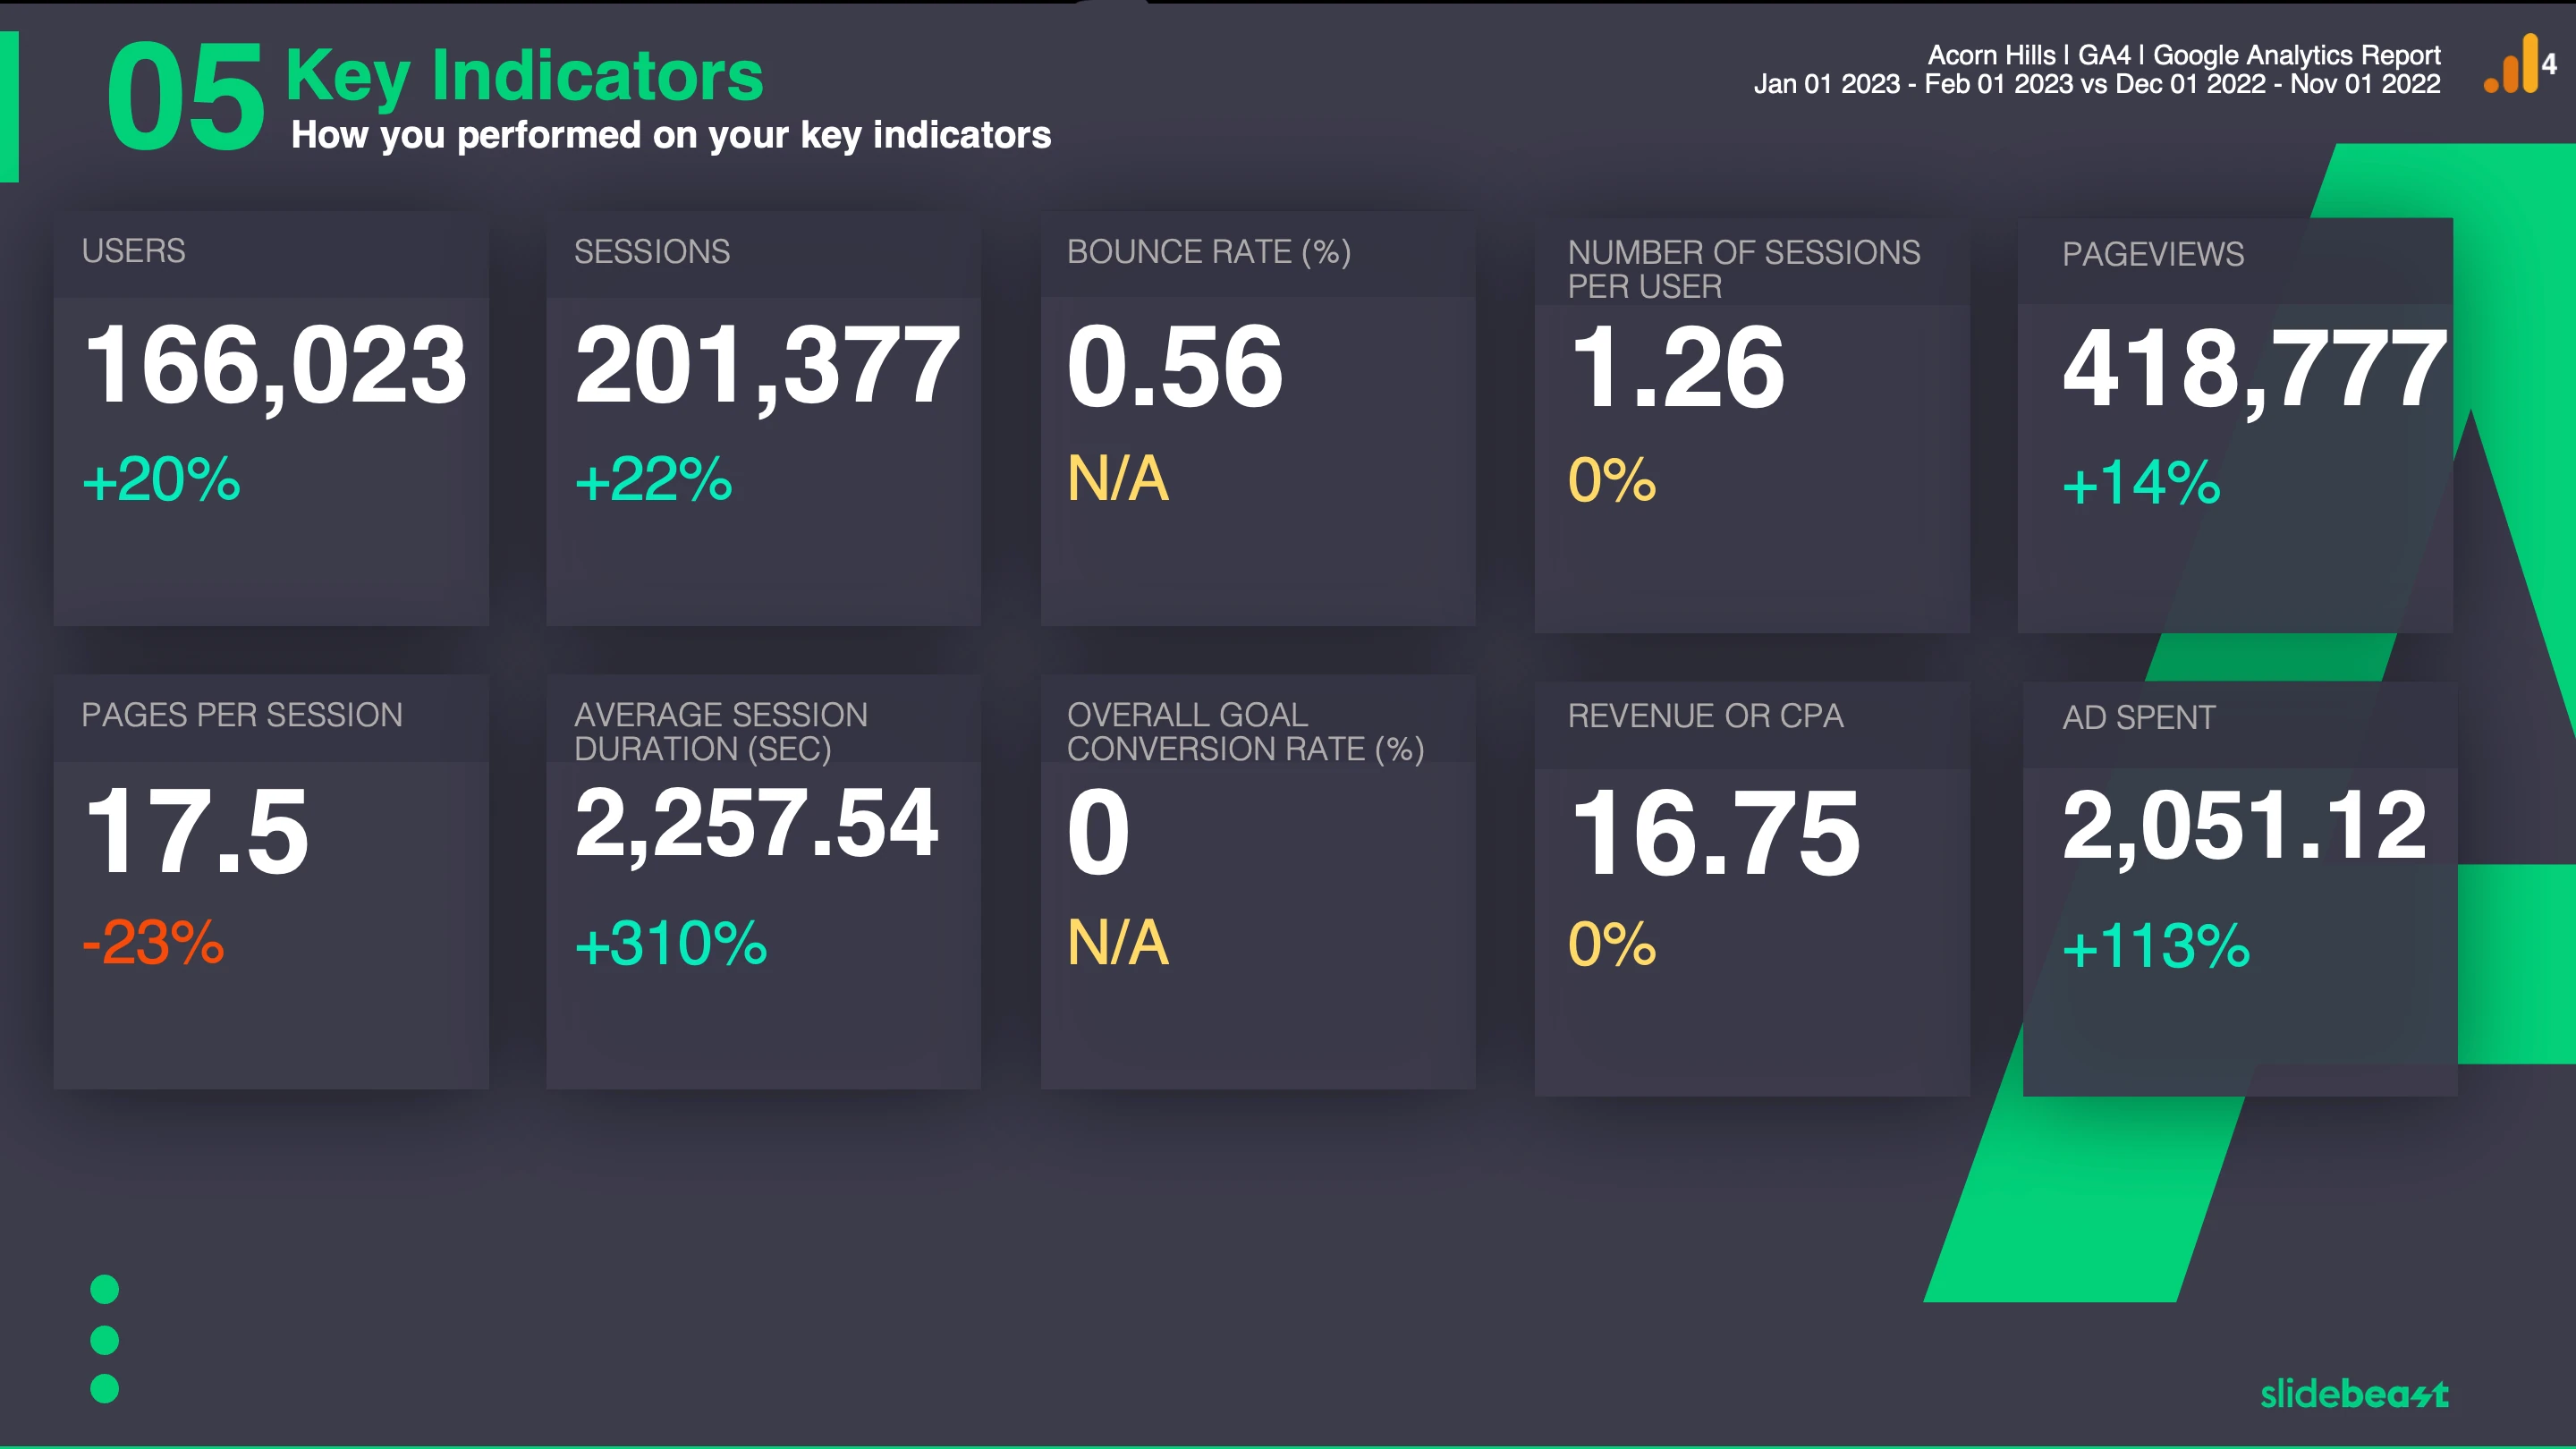
The first section of the Google Analytics 4 report. Made out of 6 different slides. As its name suggests, this section acts an overview of the period.
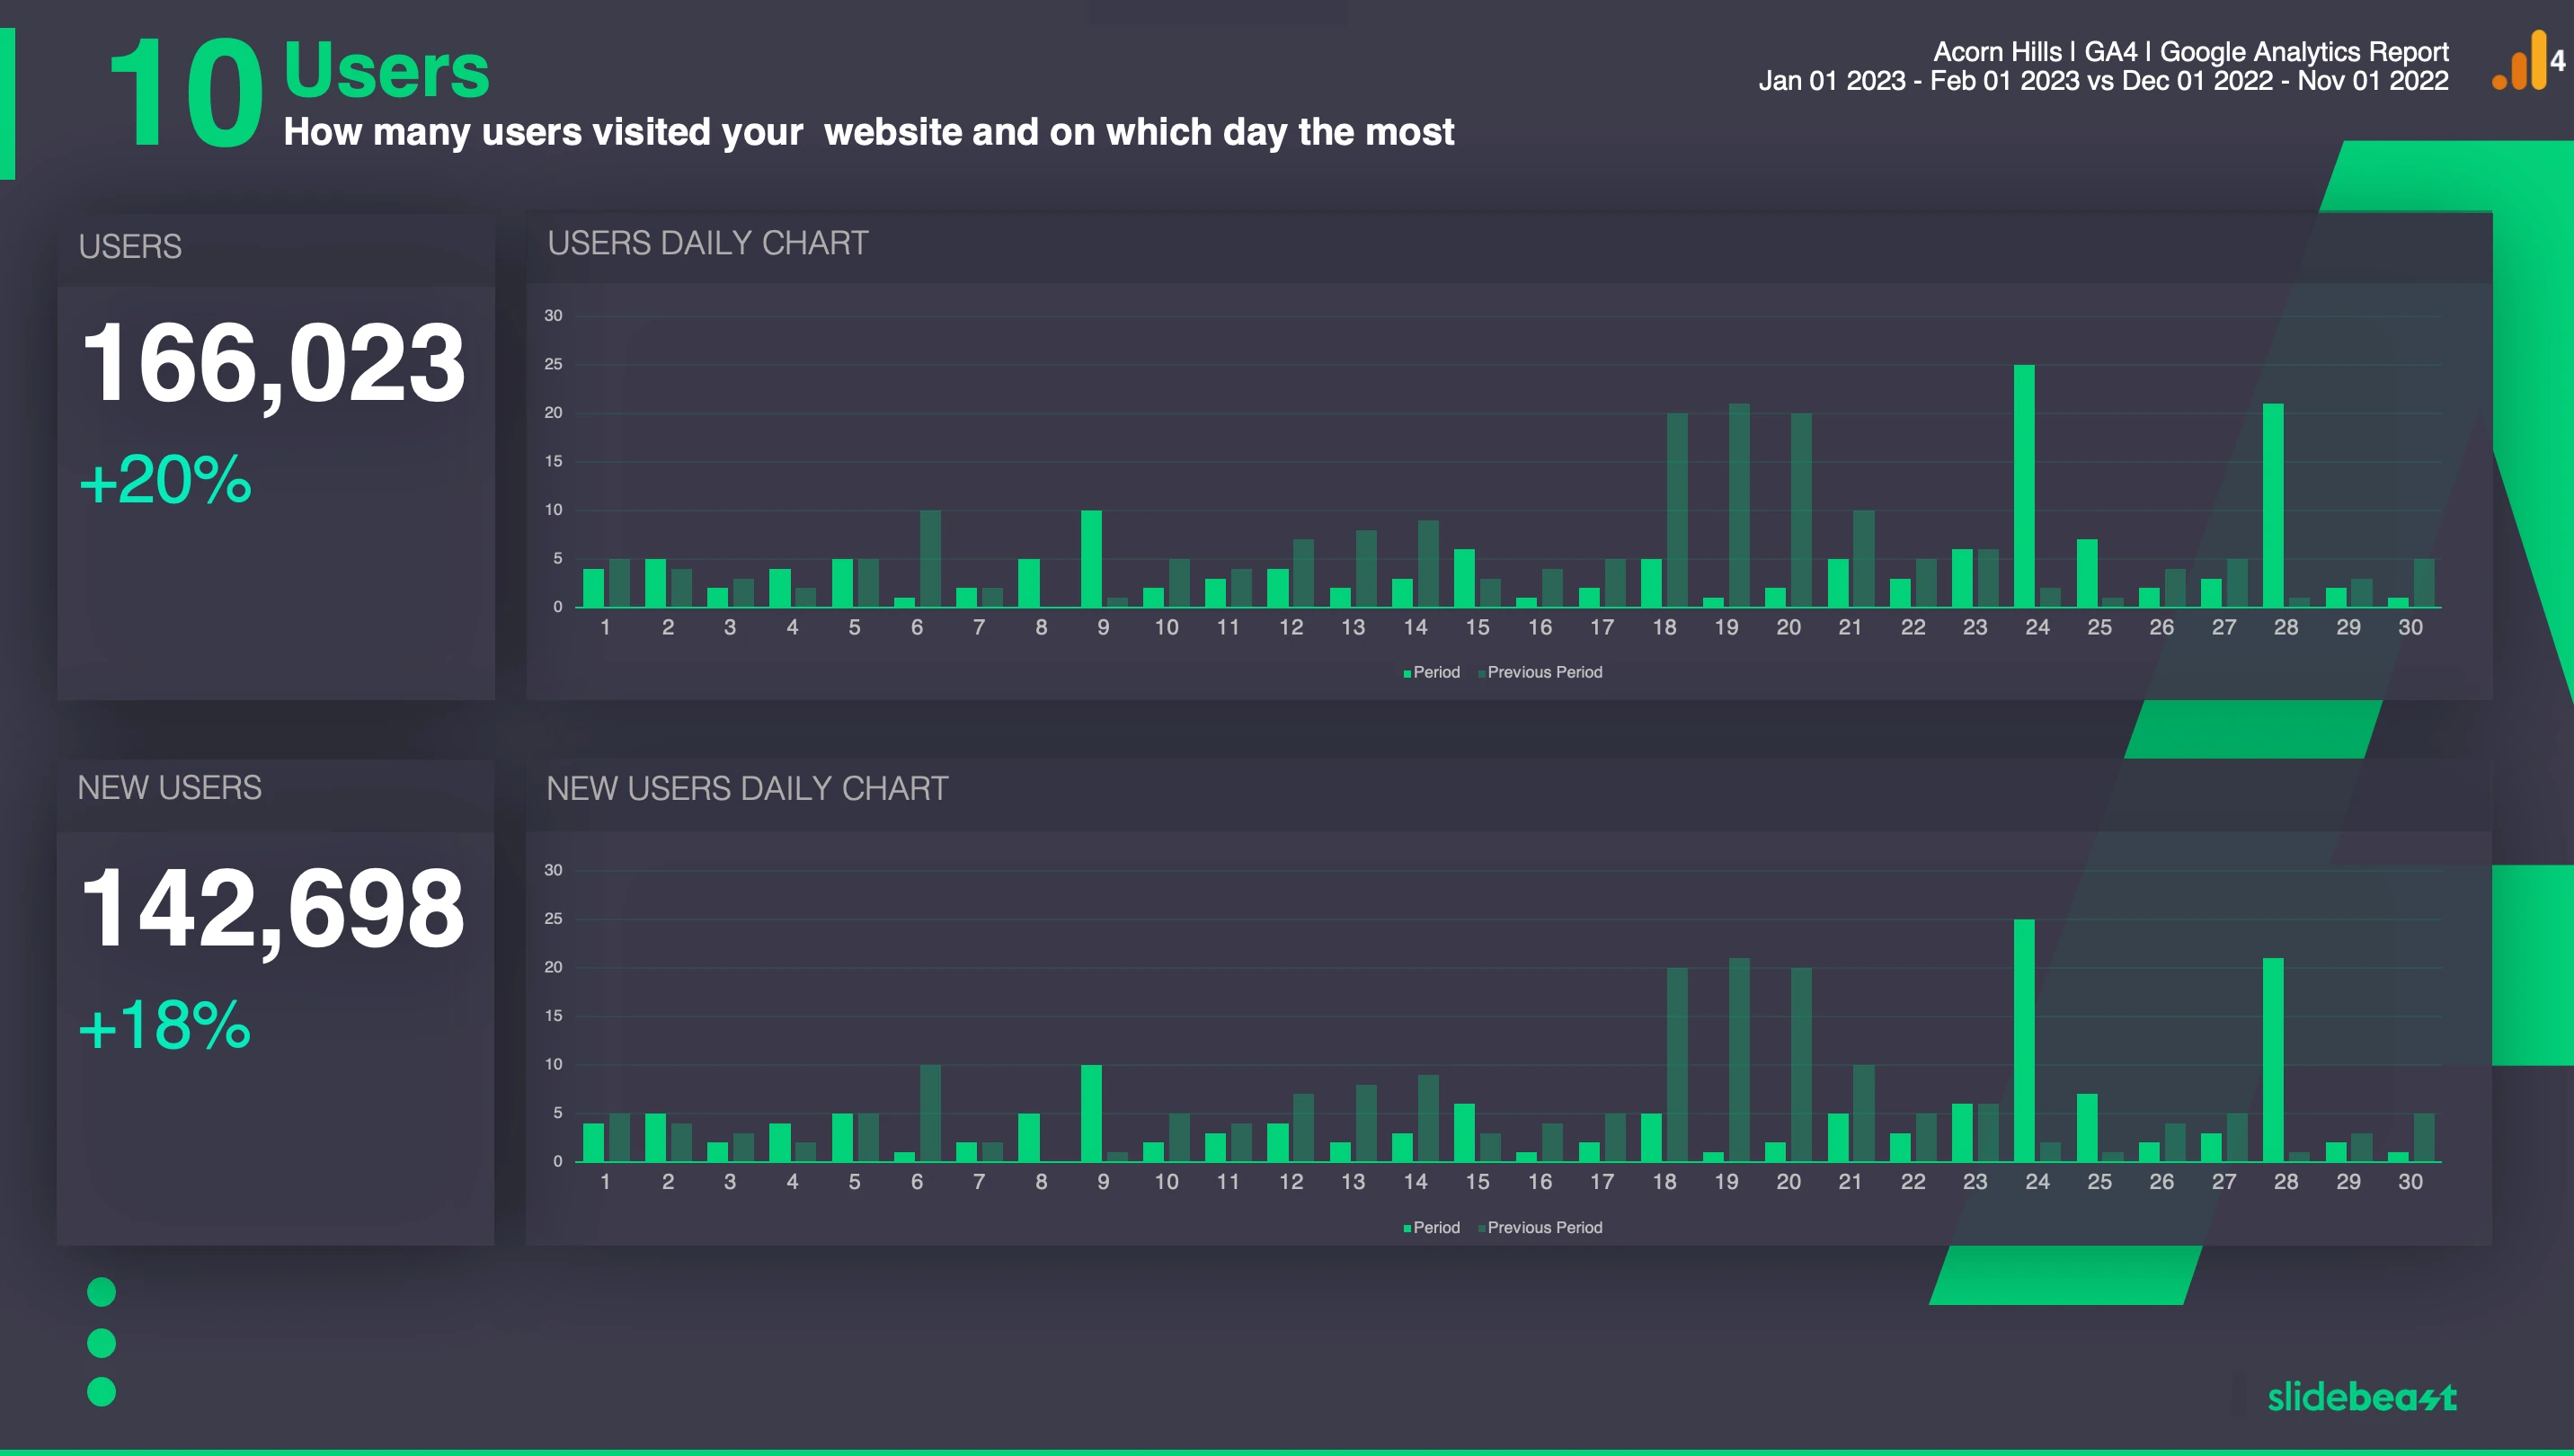
Made of 4 slides, Users and Behavior section focuses on major indicators relating to site visitors and their in site behaviors.
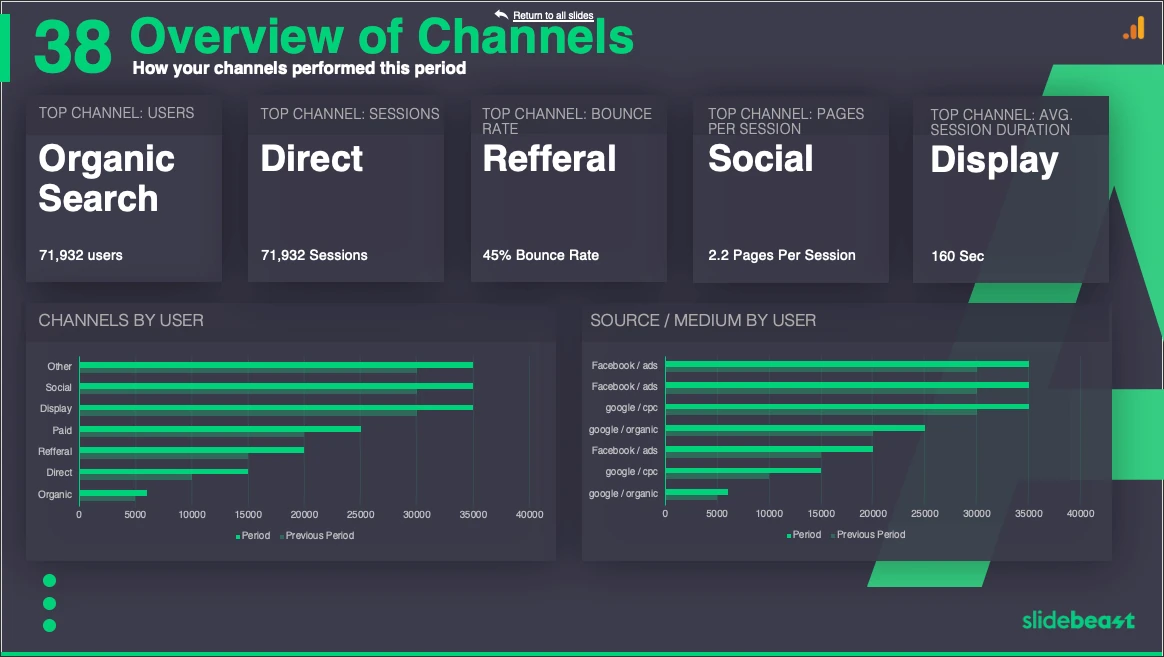
All traffic channels under one roof. Depending on the activity total slides in this section can go up to 22.
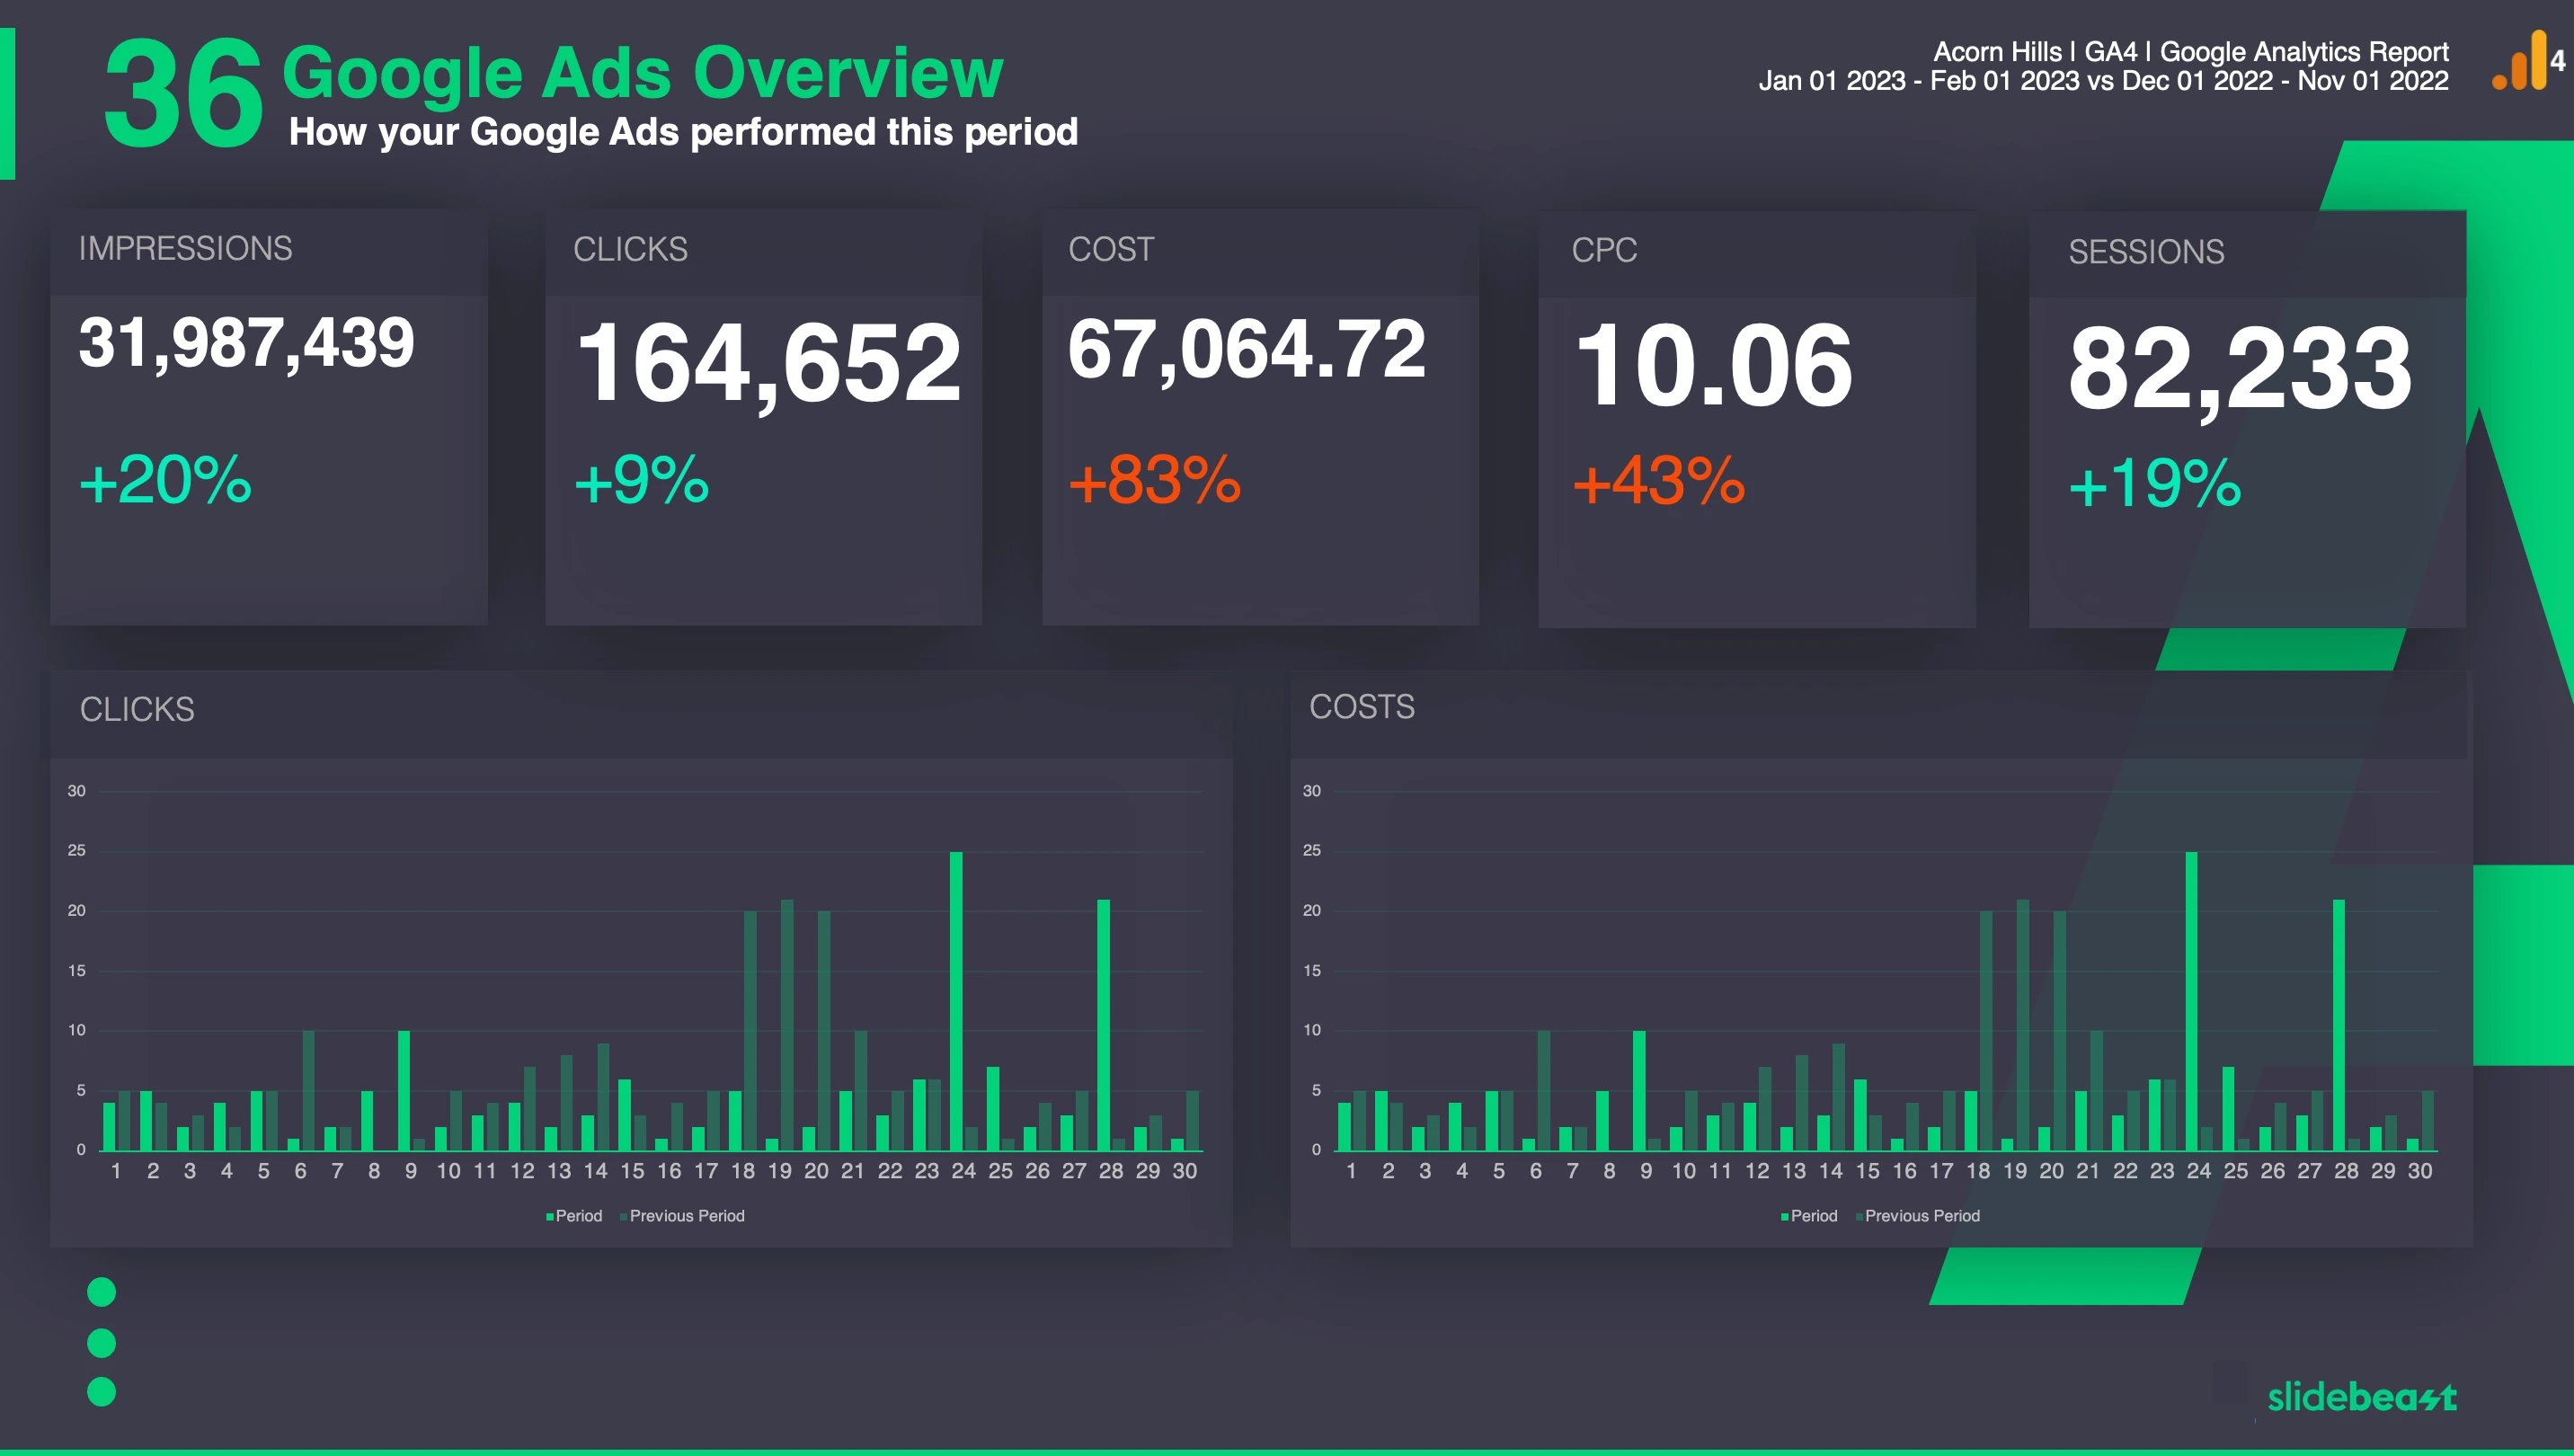
Google Ads section of the report is available only if the Google Analytics and Google Ads accounts are linked. From Ads Audience to Top Ads Campaigns, a total of 6 powerful slides.
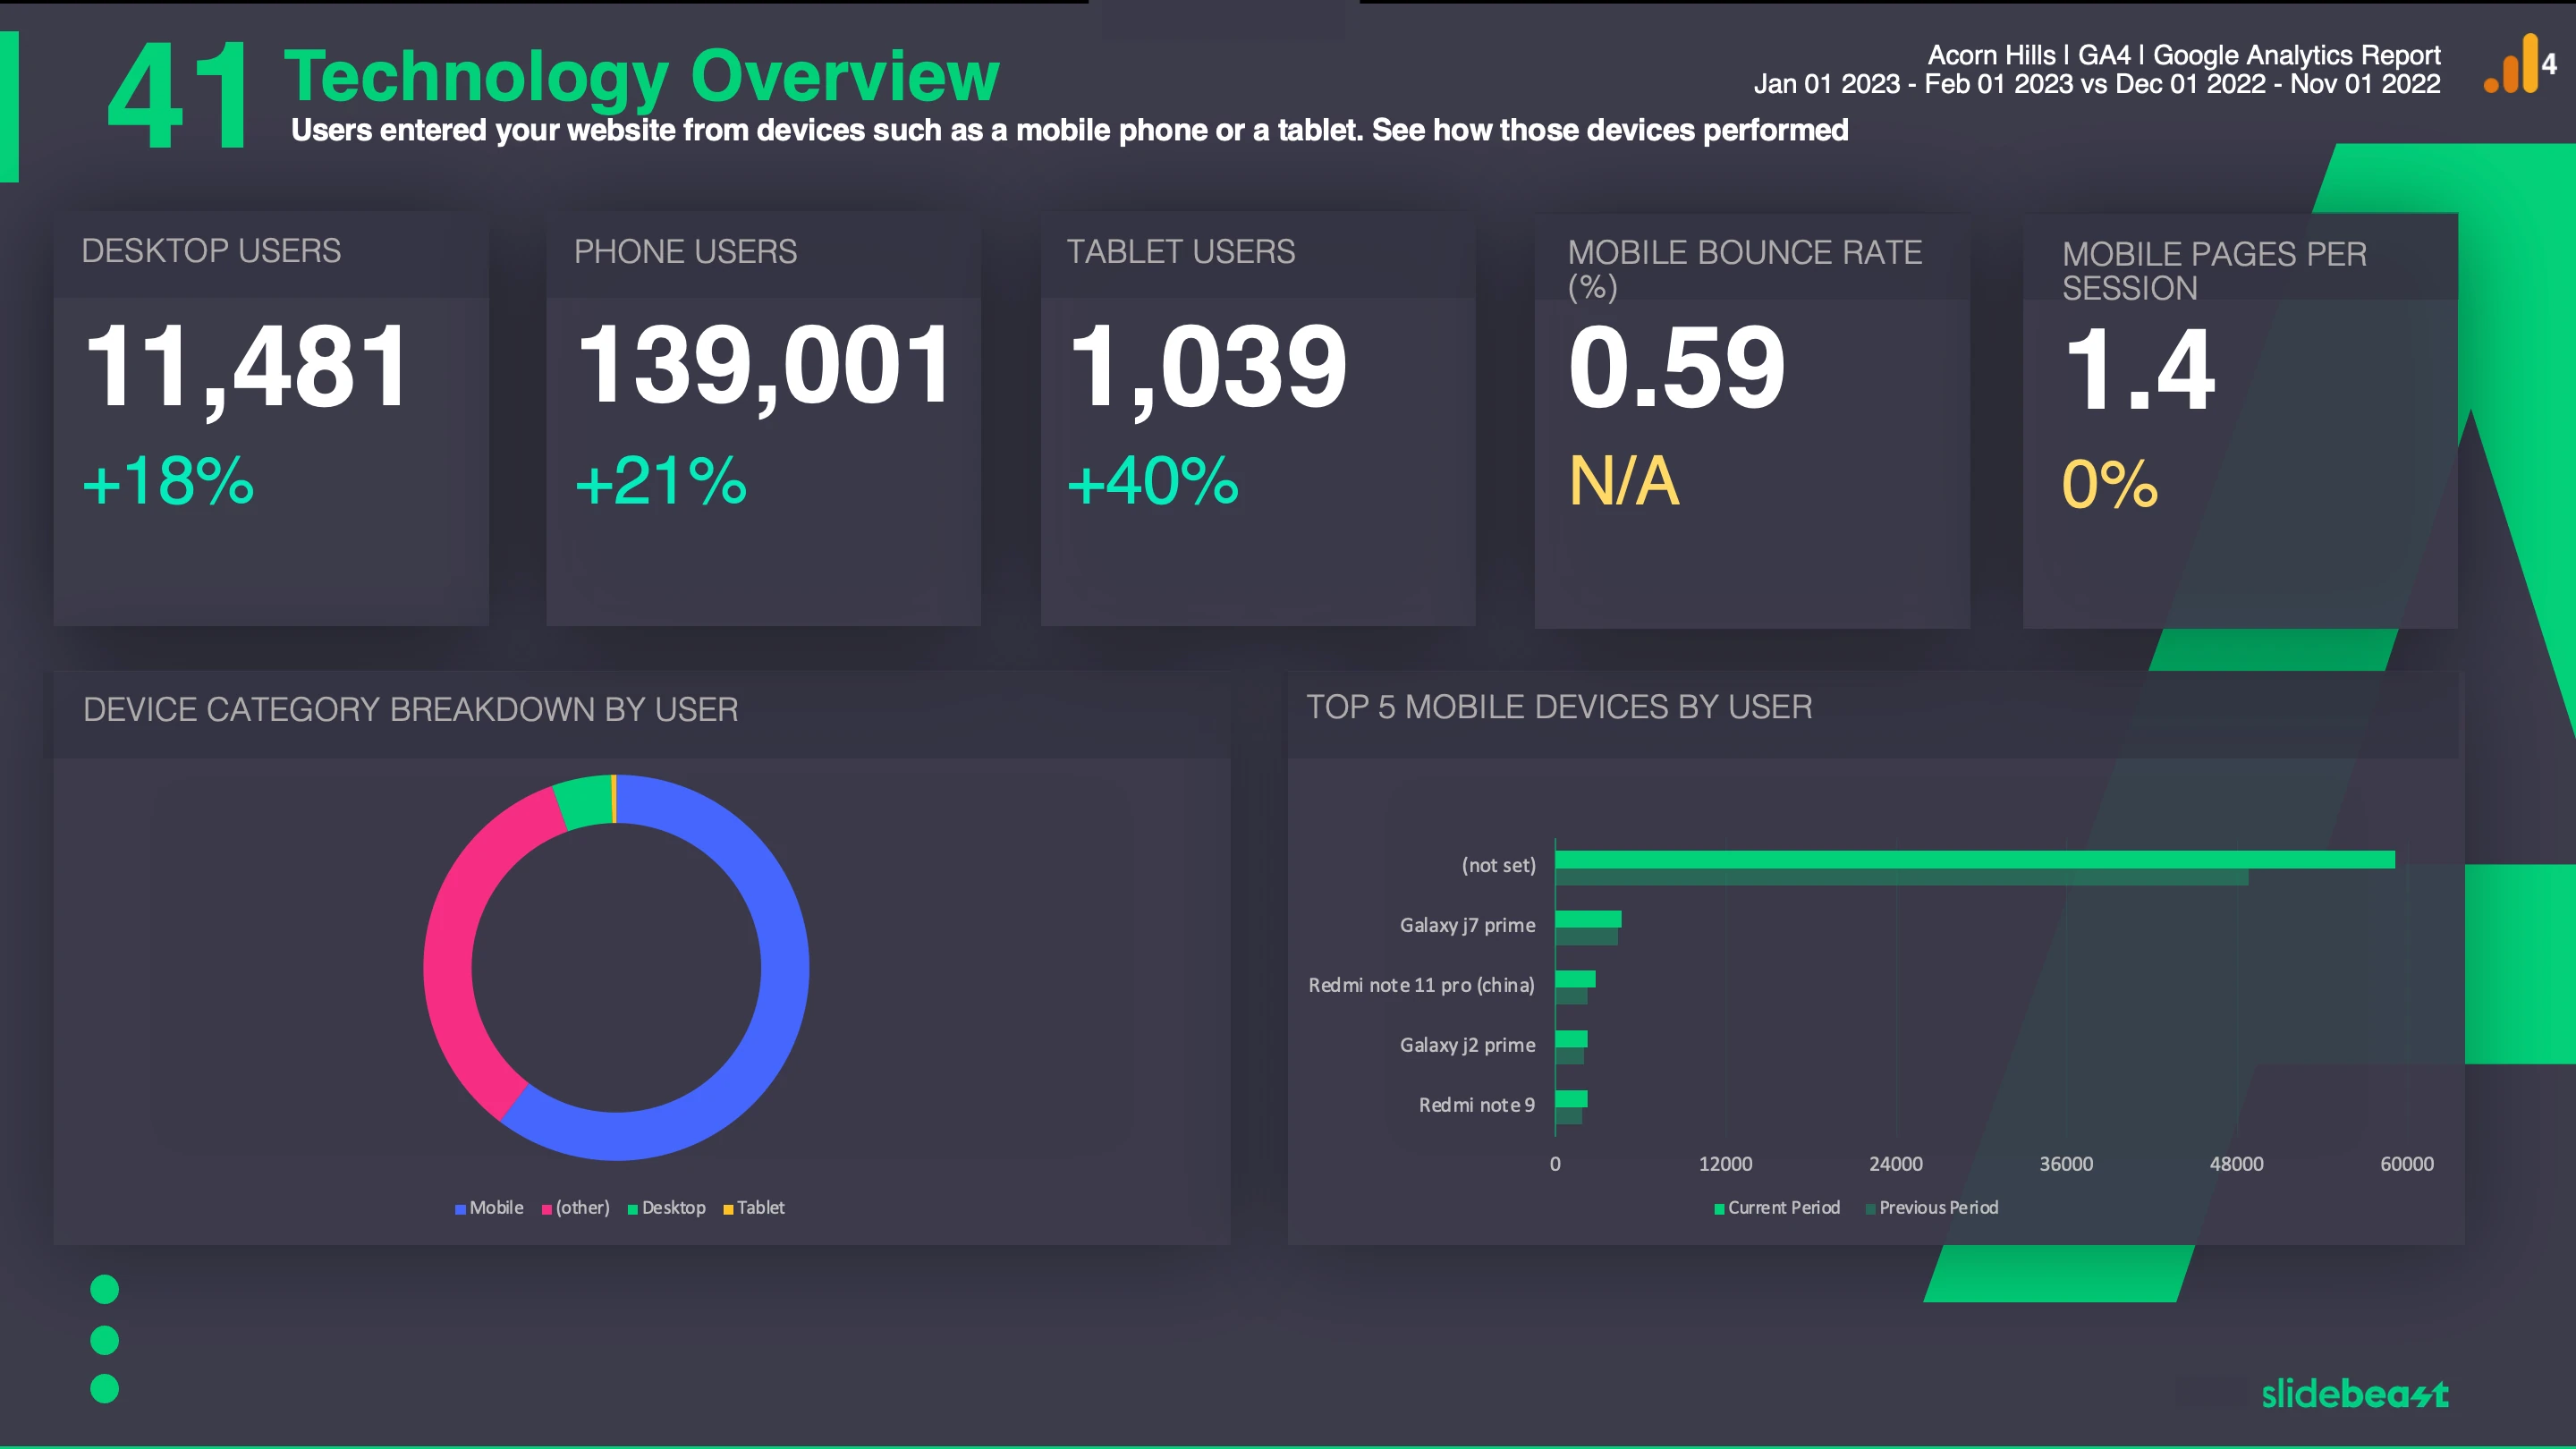
Technology section focuses mainly on device (mobile in particular) performances. A total of 6 slides.
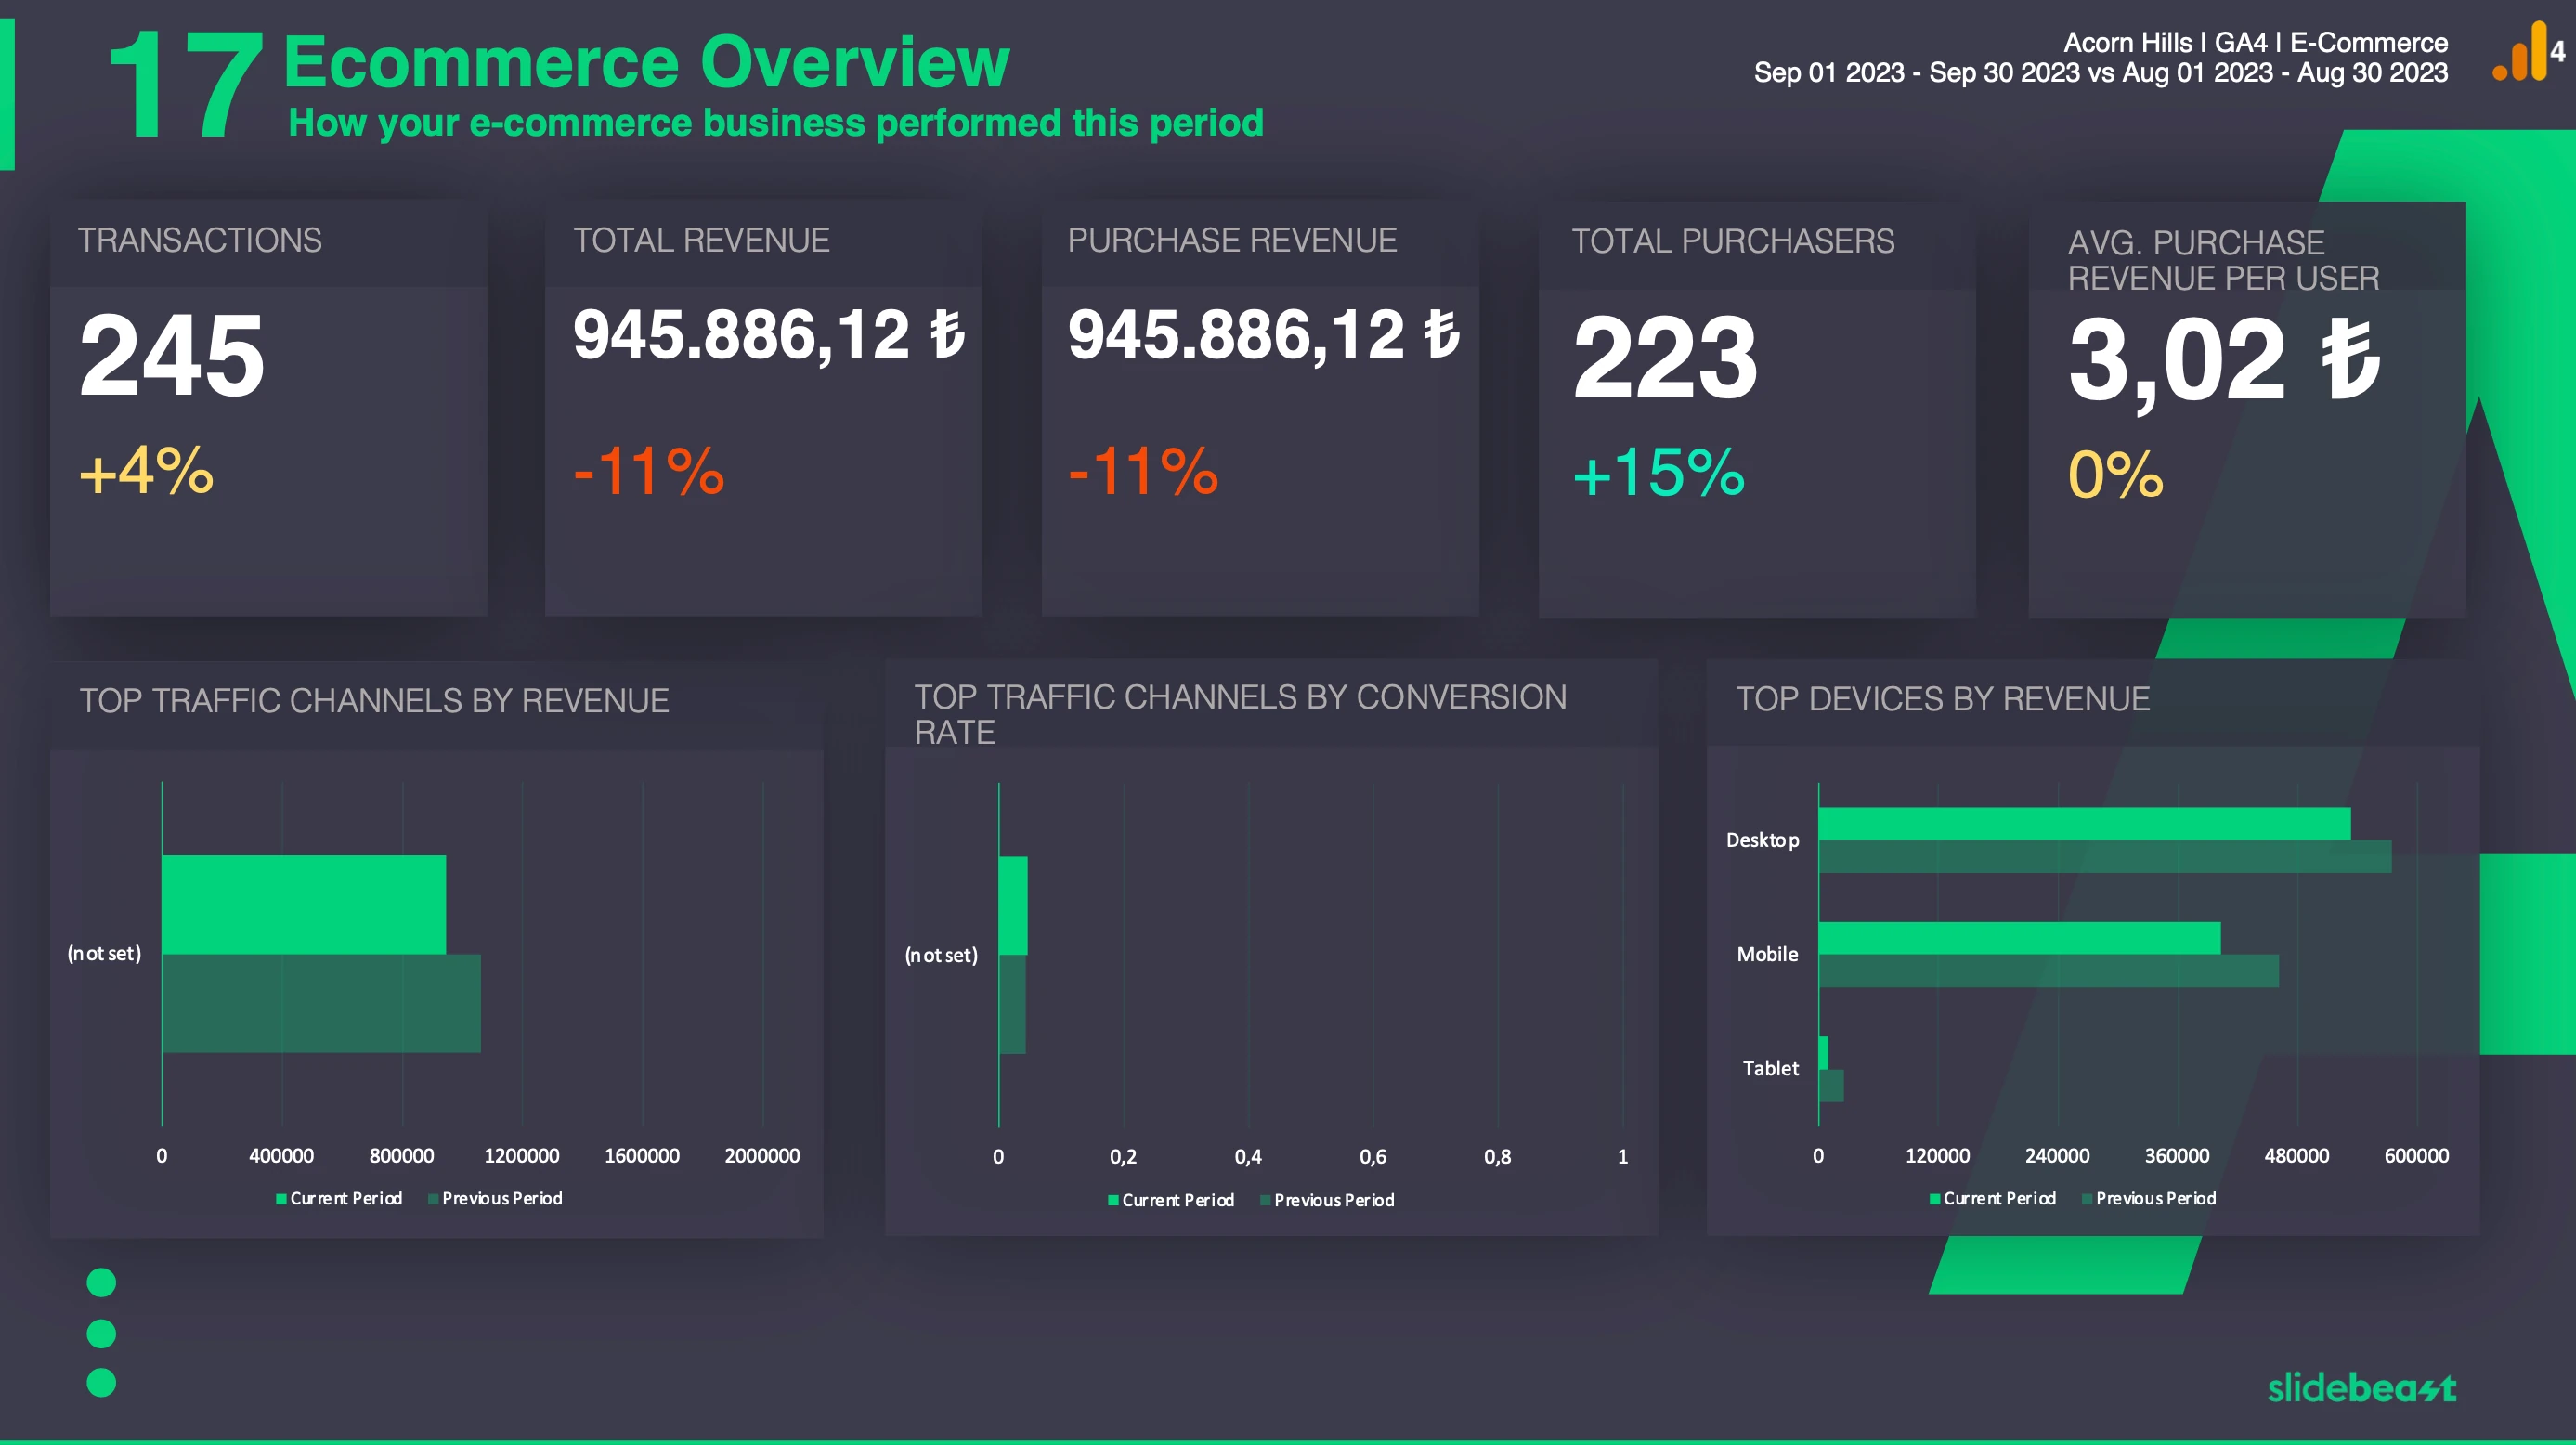
Spanning 14 slides, the E-commerce section provides a comprehensive analysis of sales metrics, user purchase journeys by device specifics, and promotional impacts on transactional outcomes.
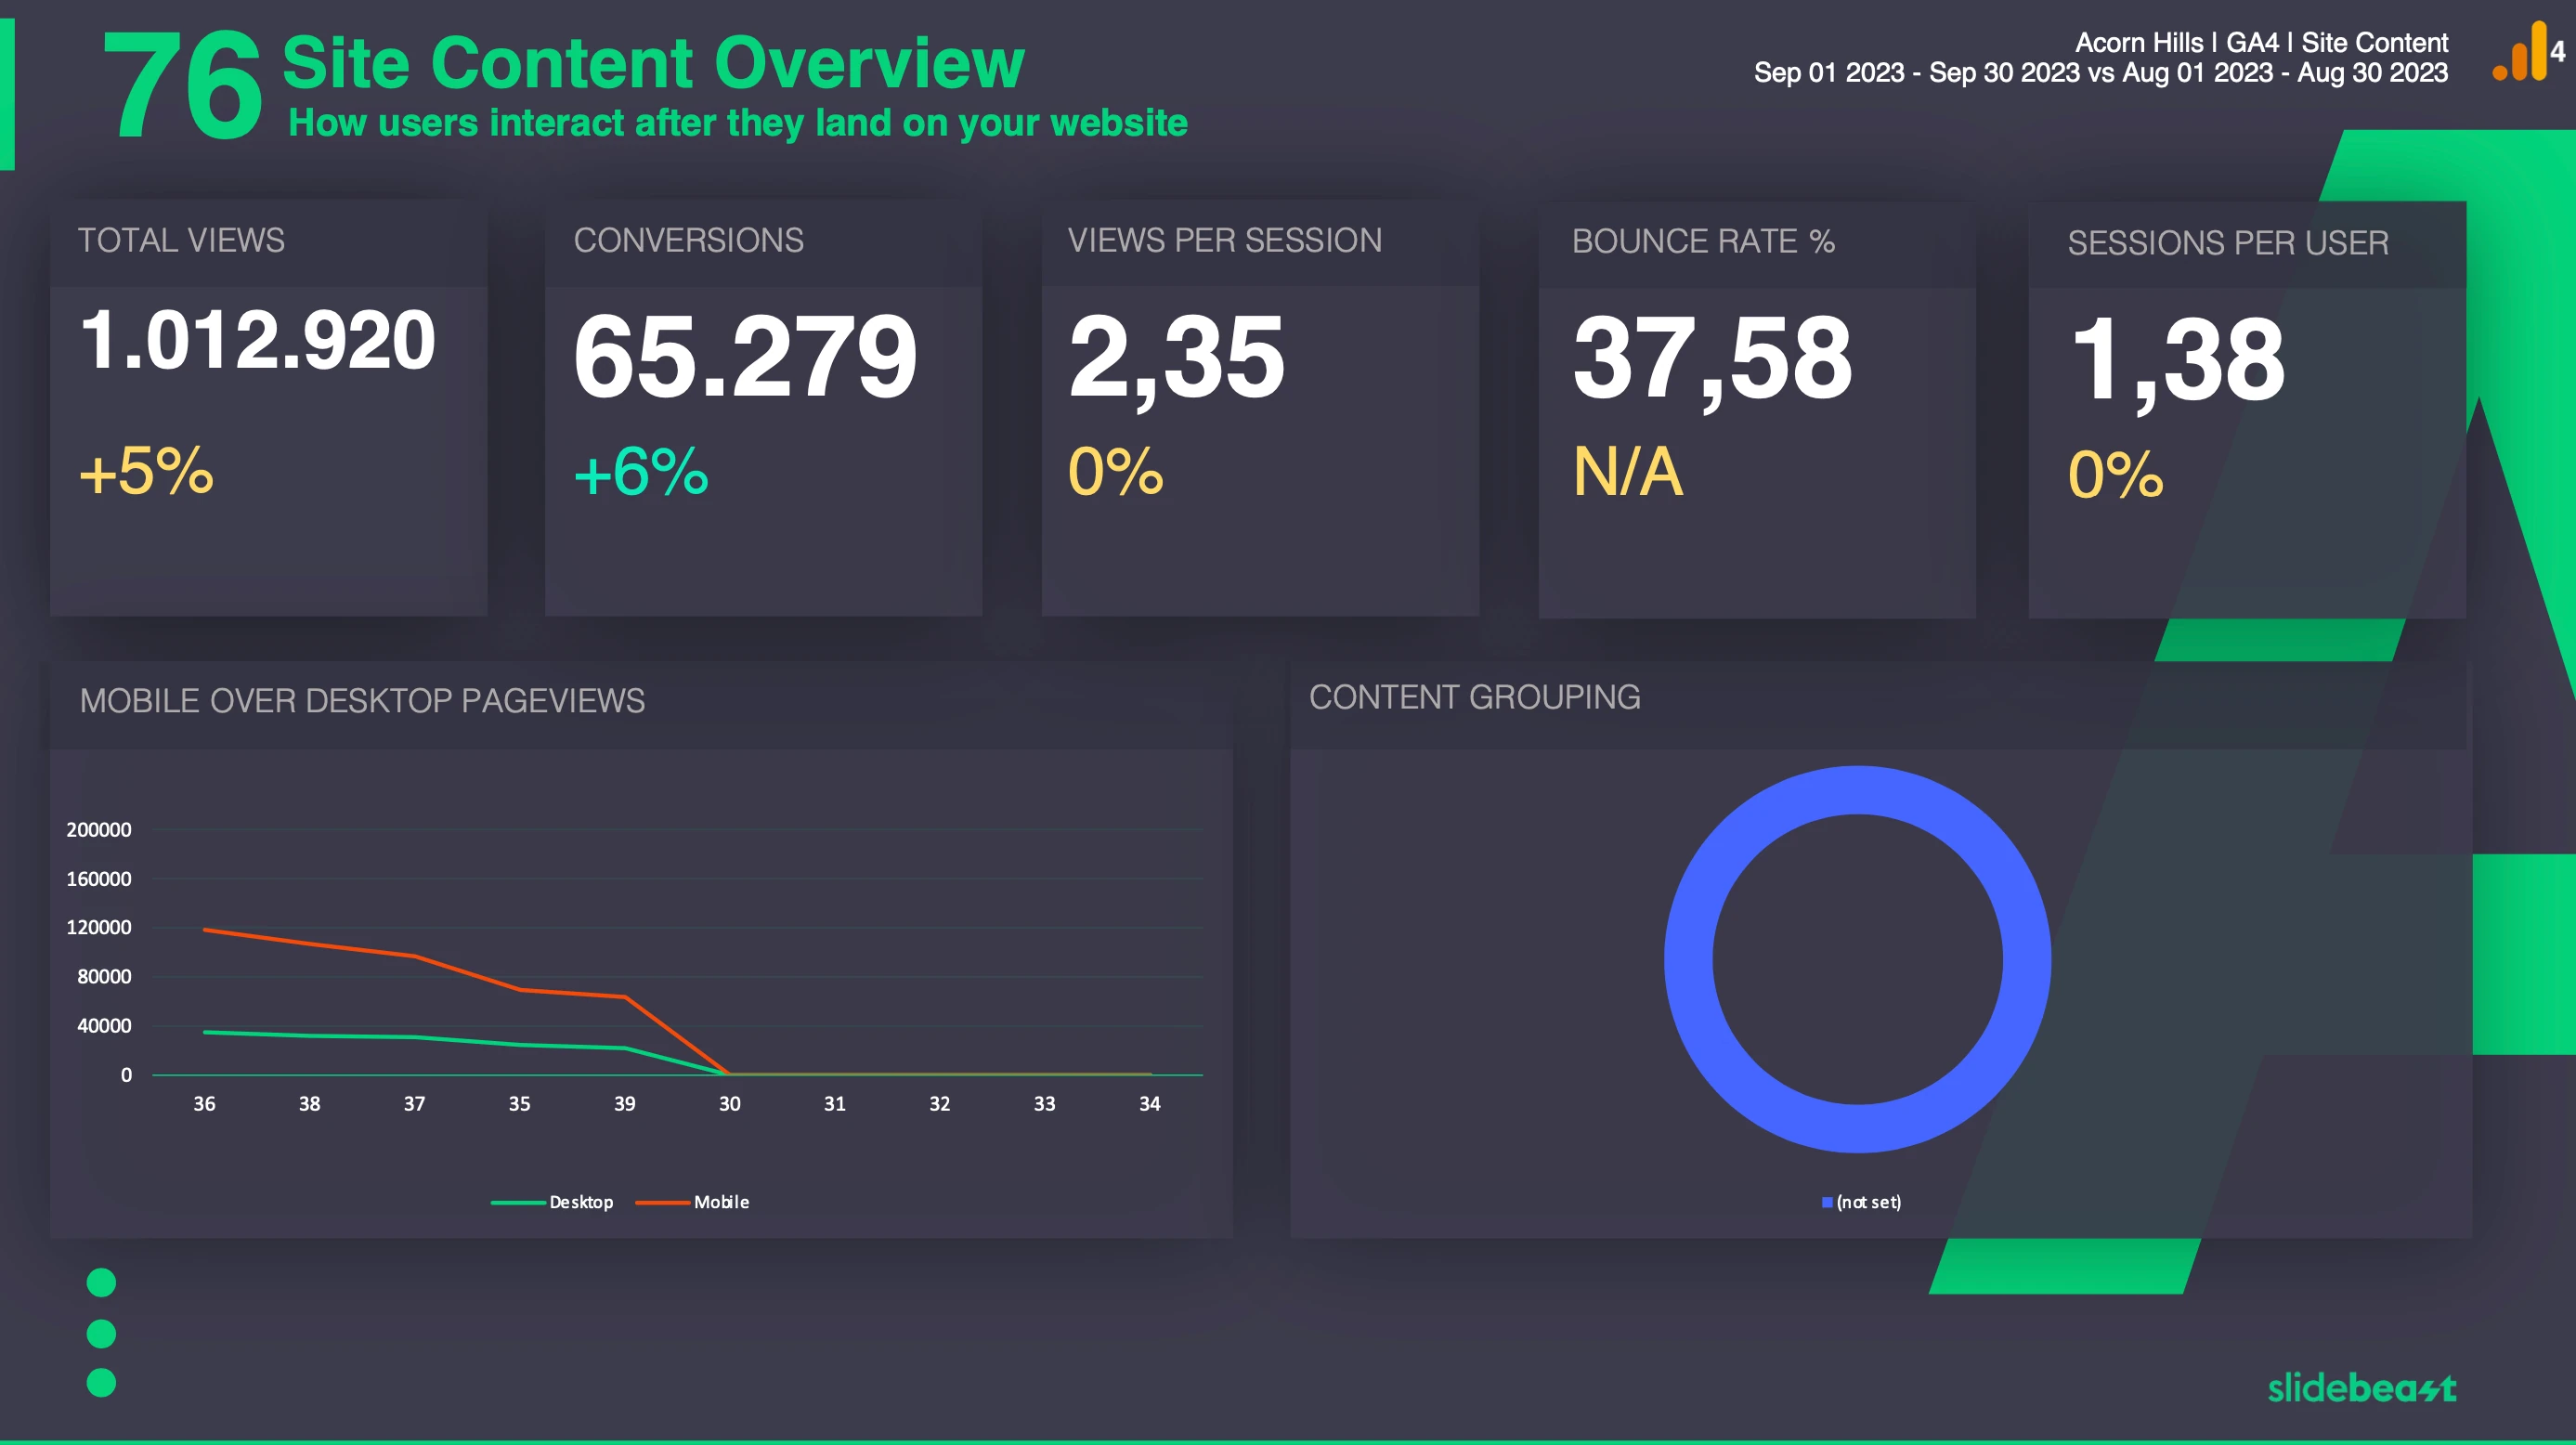
The Site Content section, spread across 5 slides, focuses on user interaction by presenting the top 10 most visited and exited pages, broken down by desktop and mobile access.
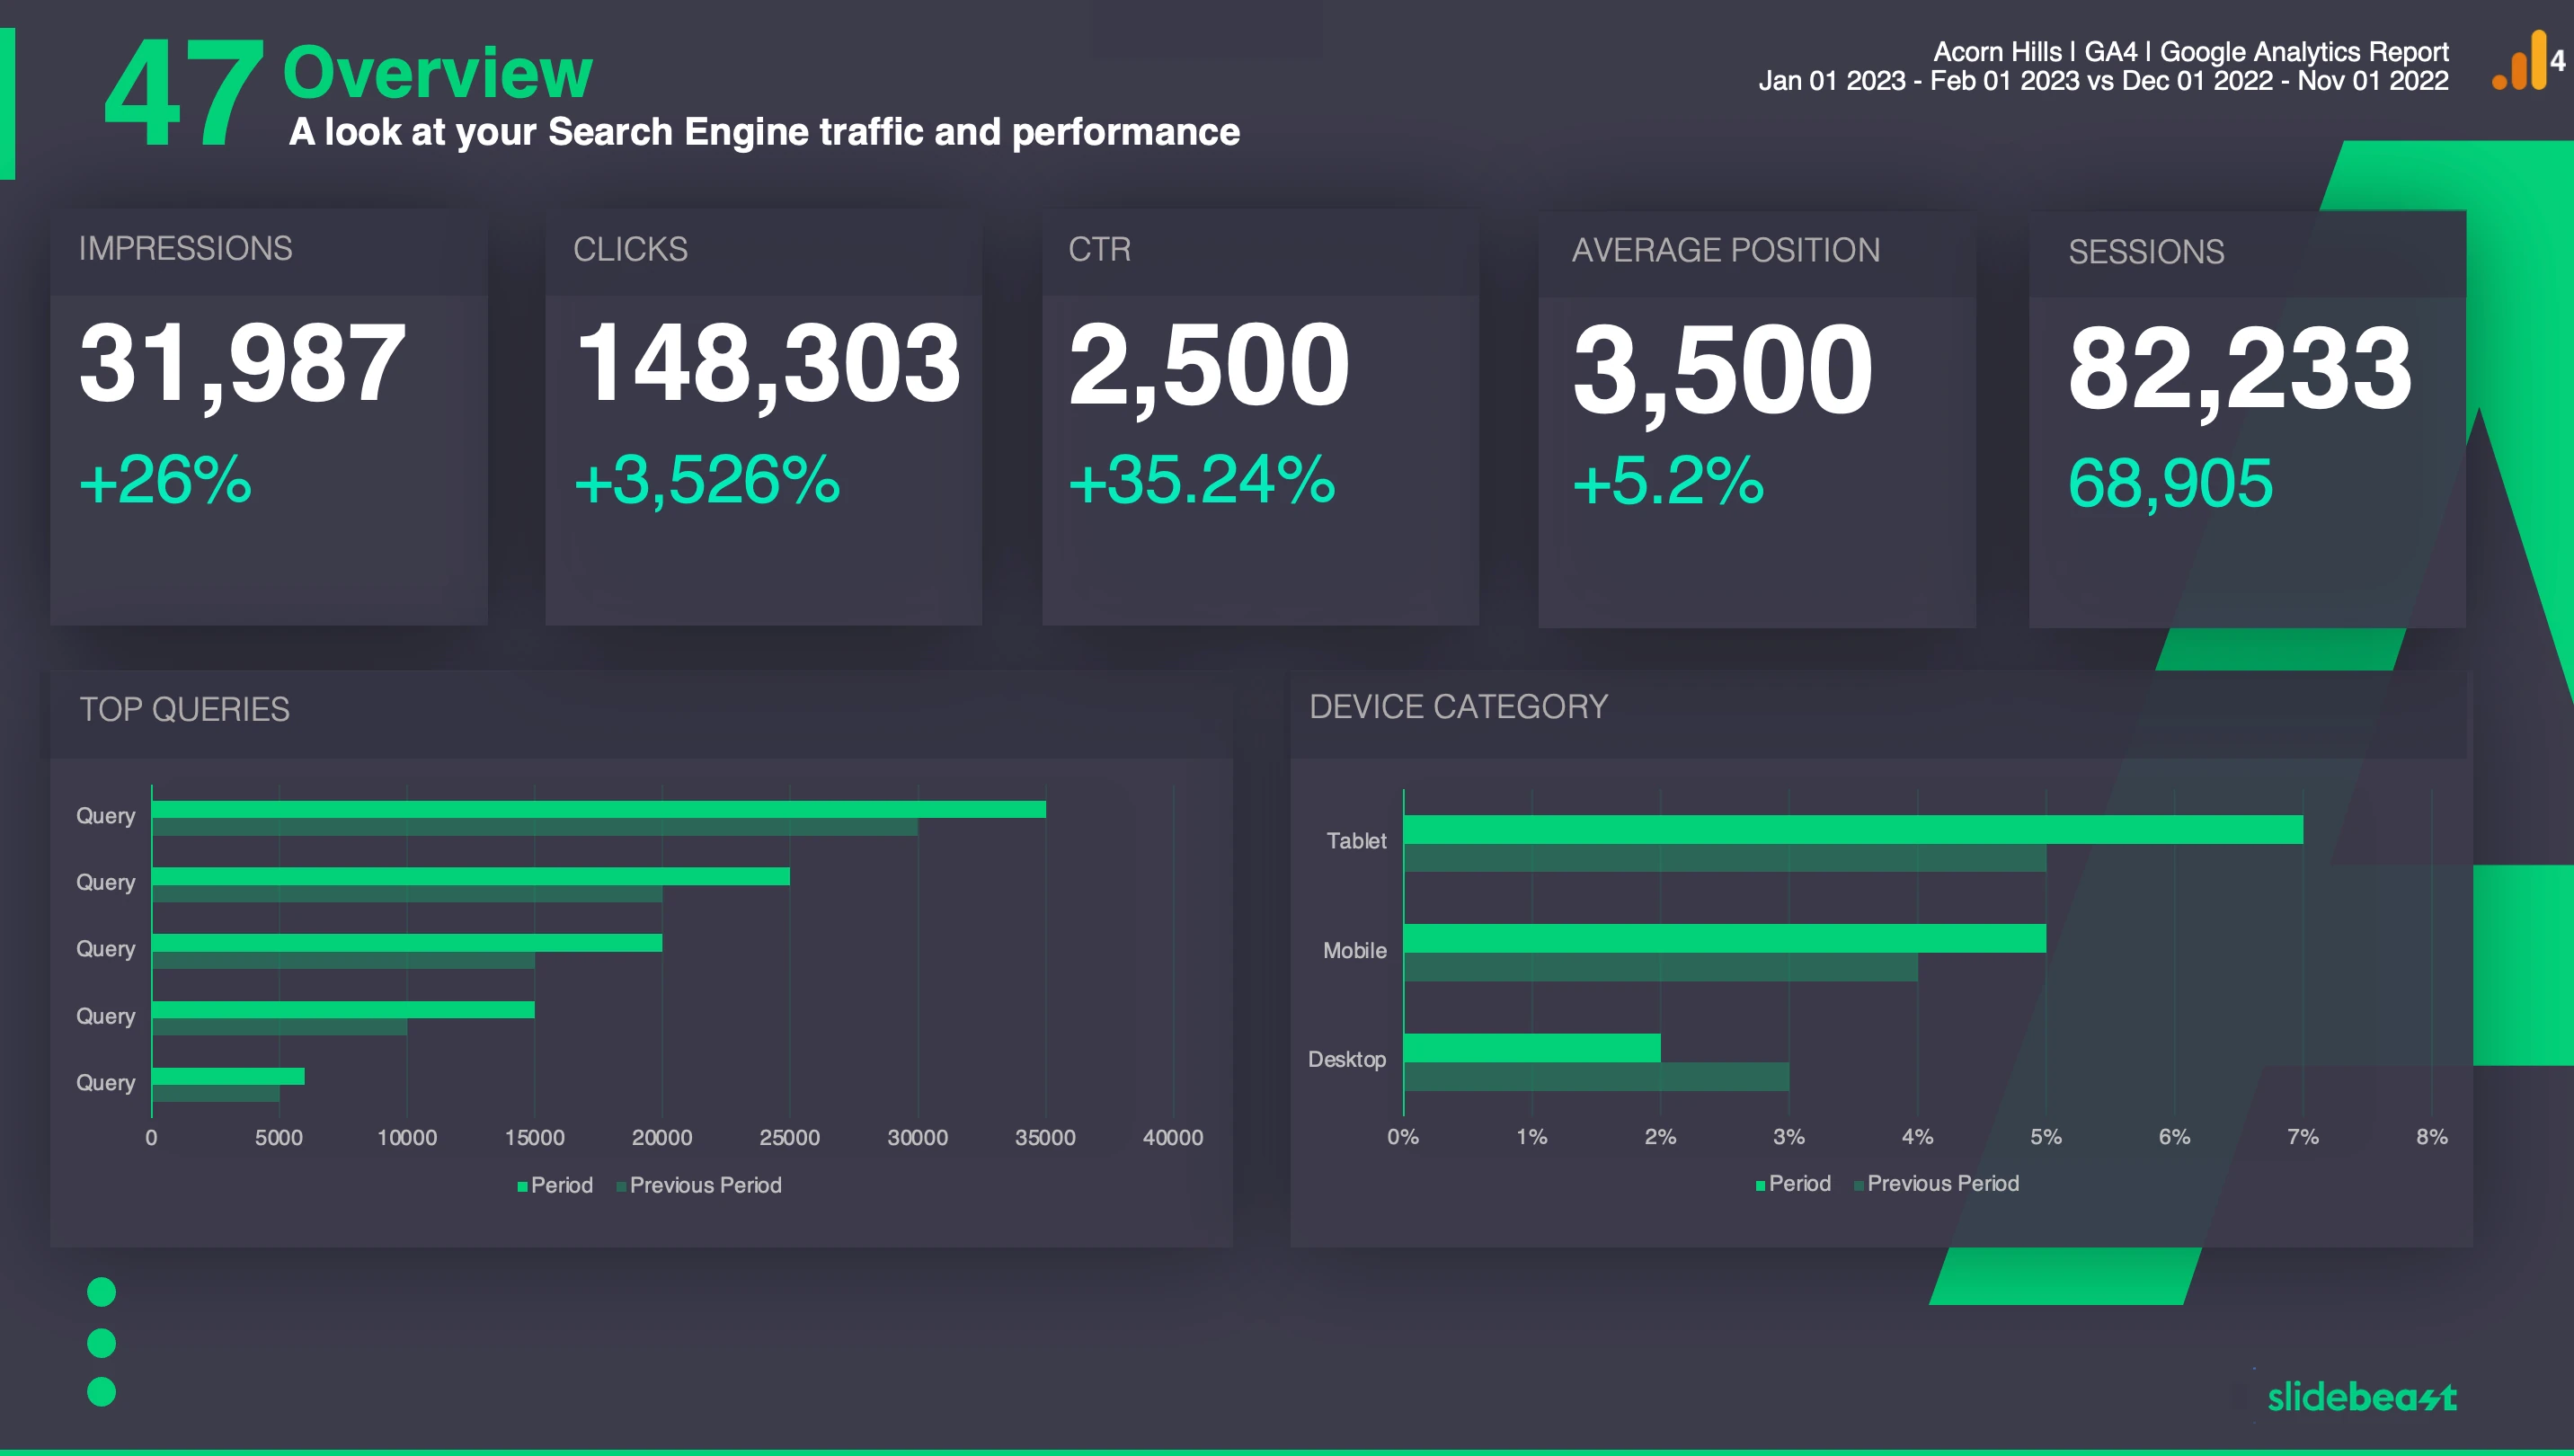
3 slides are available if Search Console is linked to Google Analytics.
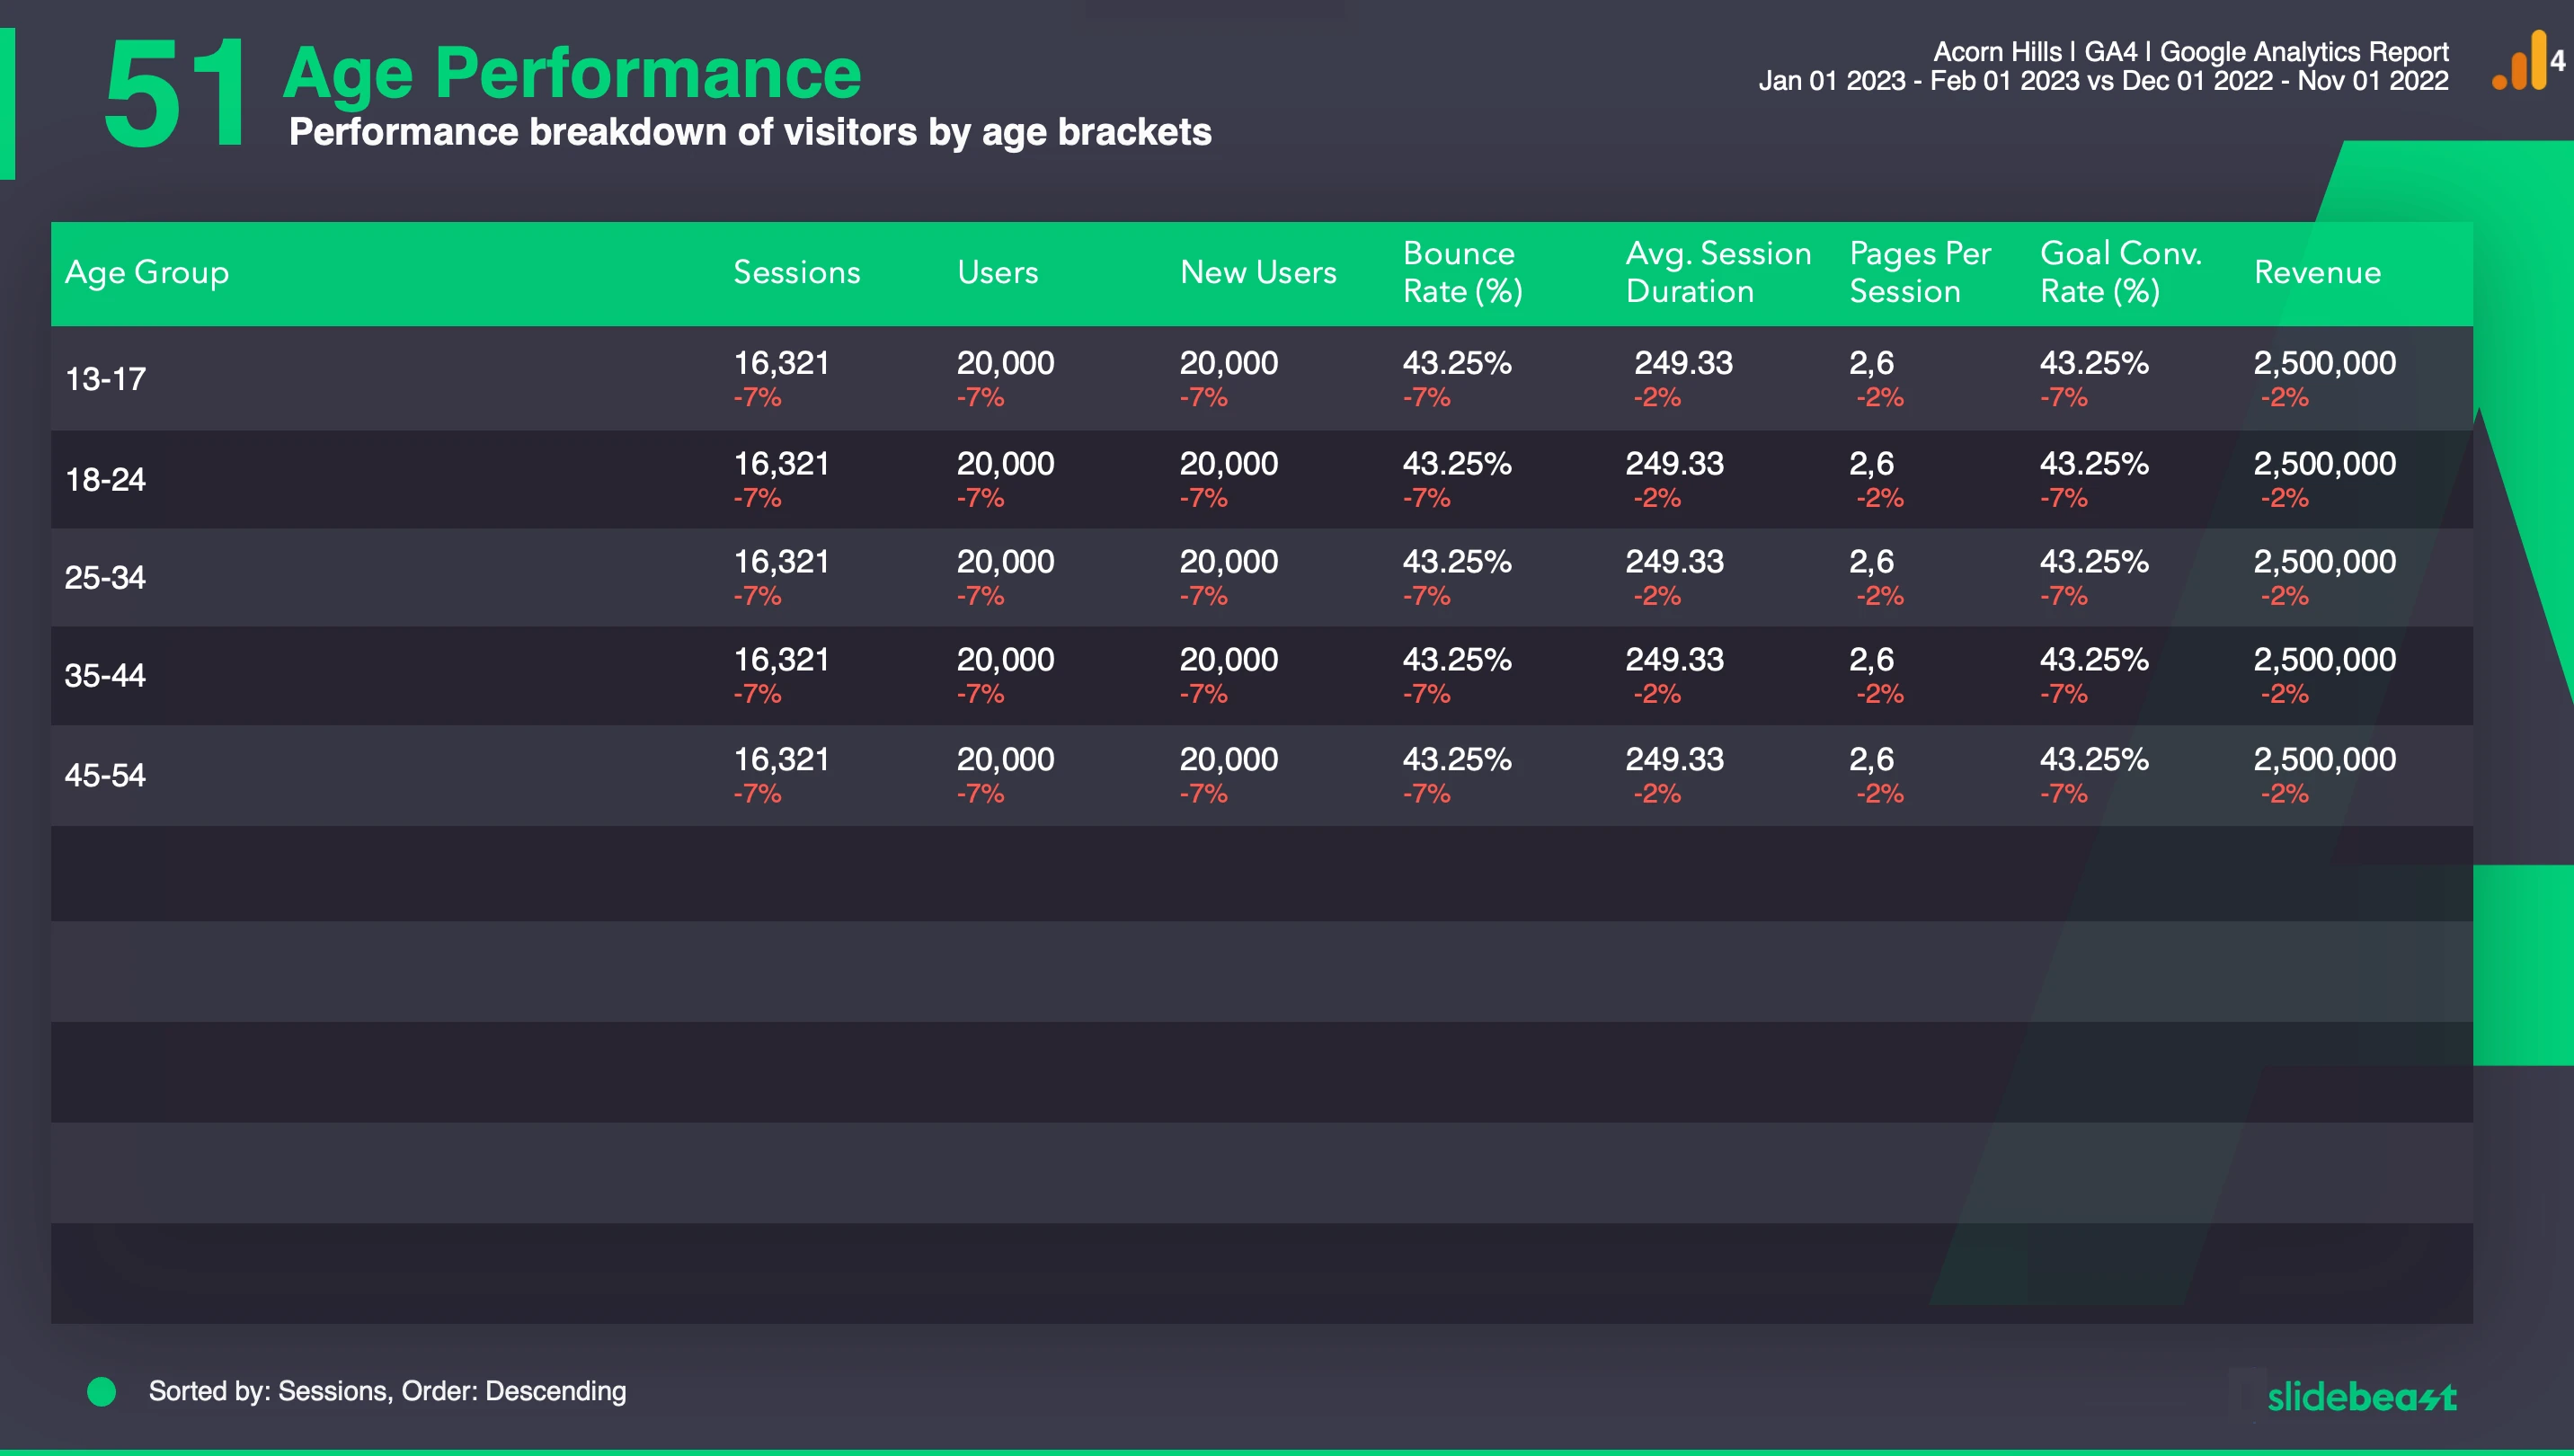
6 Slides worth of demographical information about your visitors.
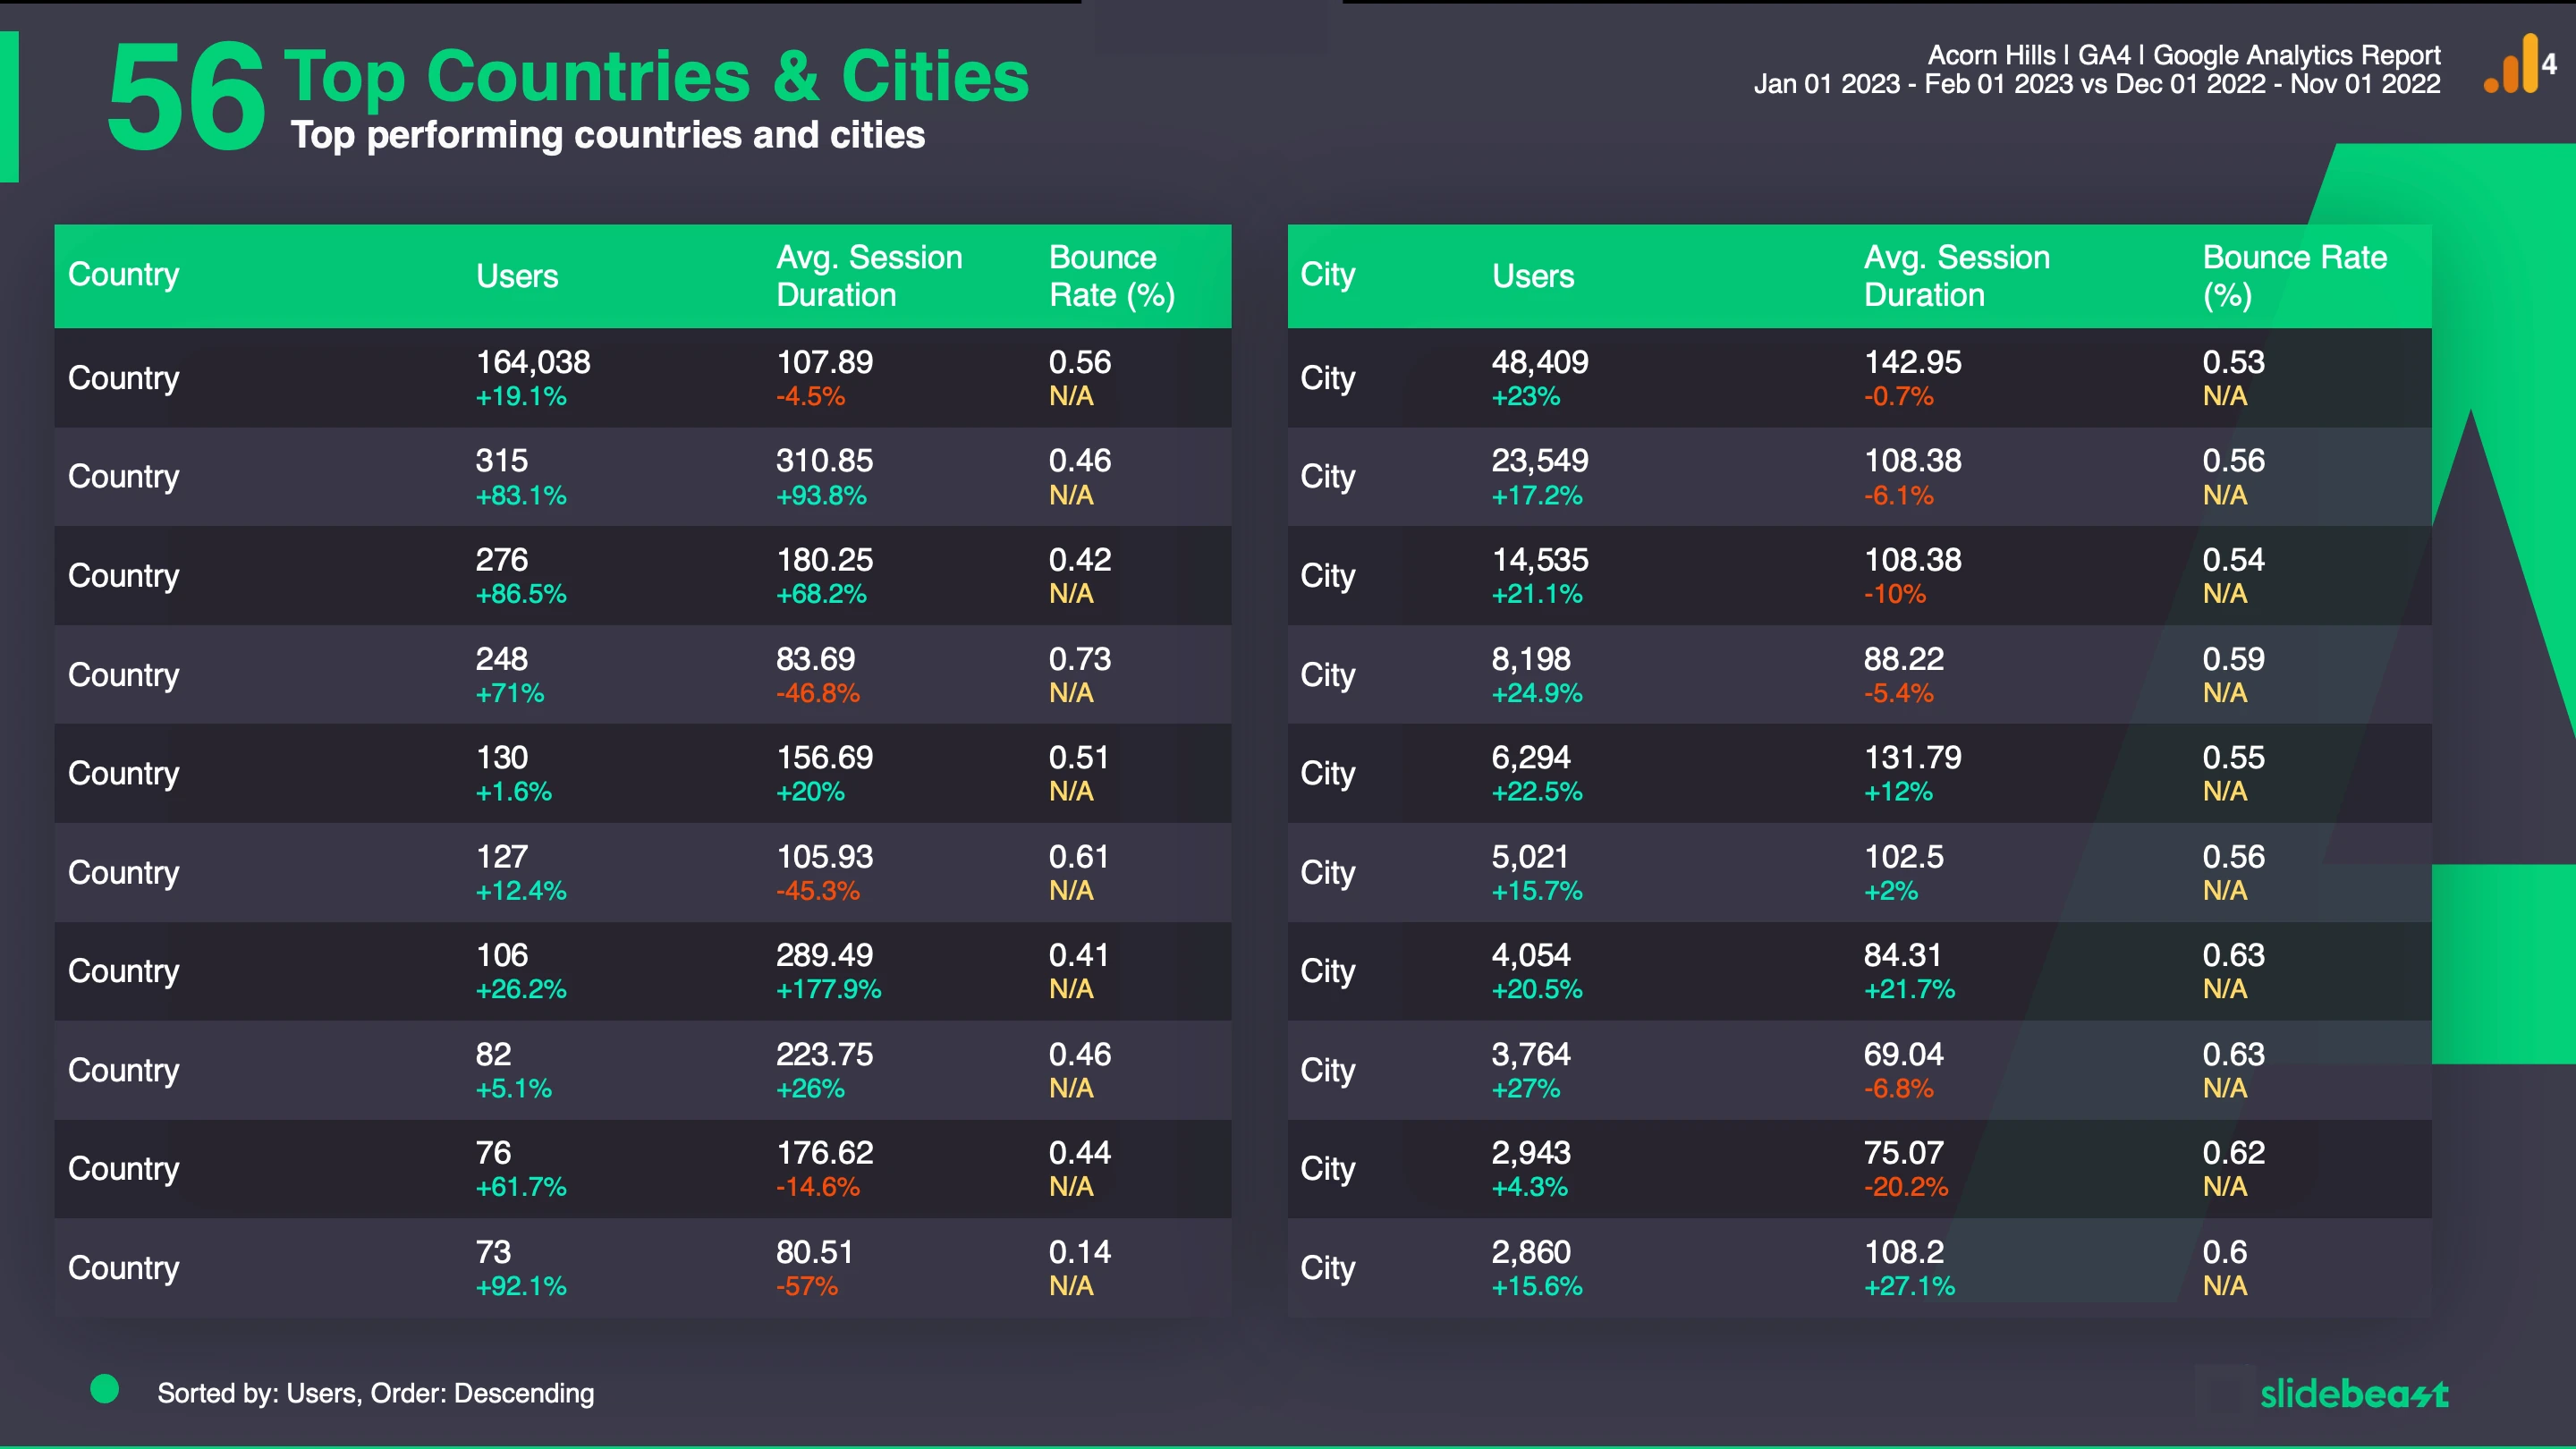
Top performing countries and cities.
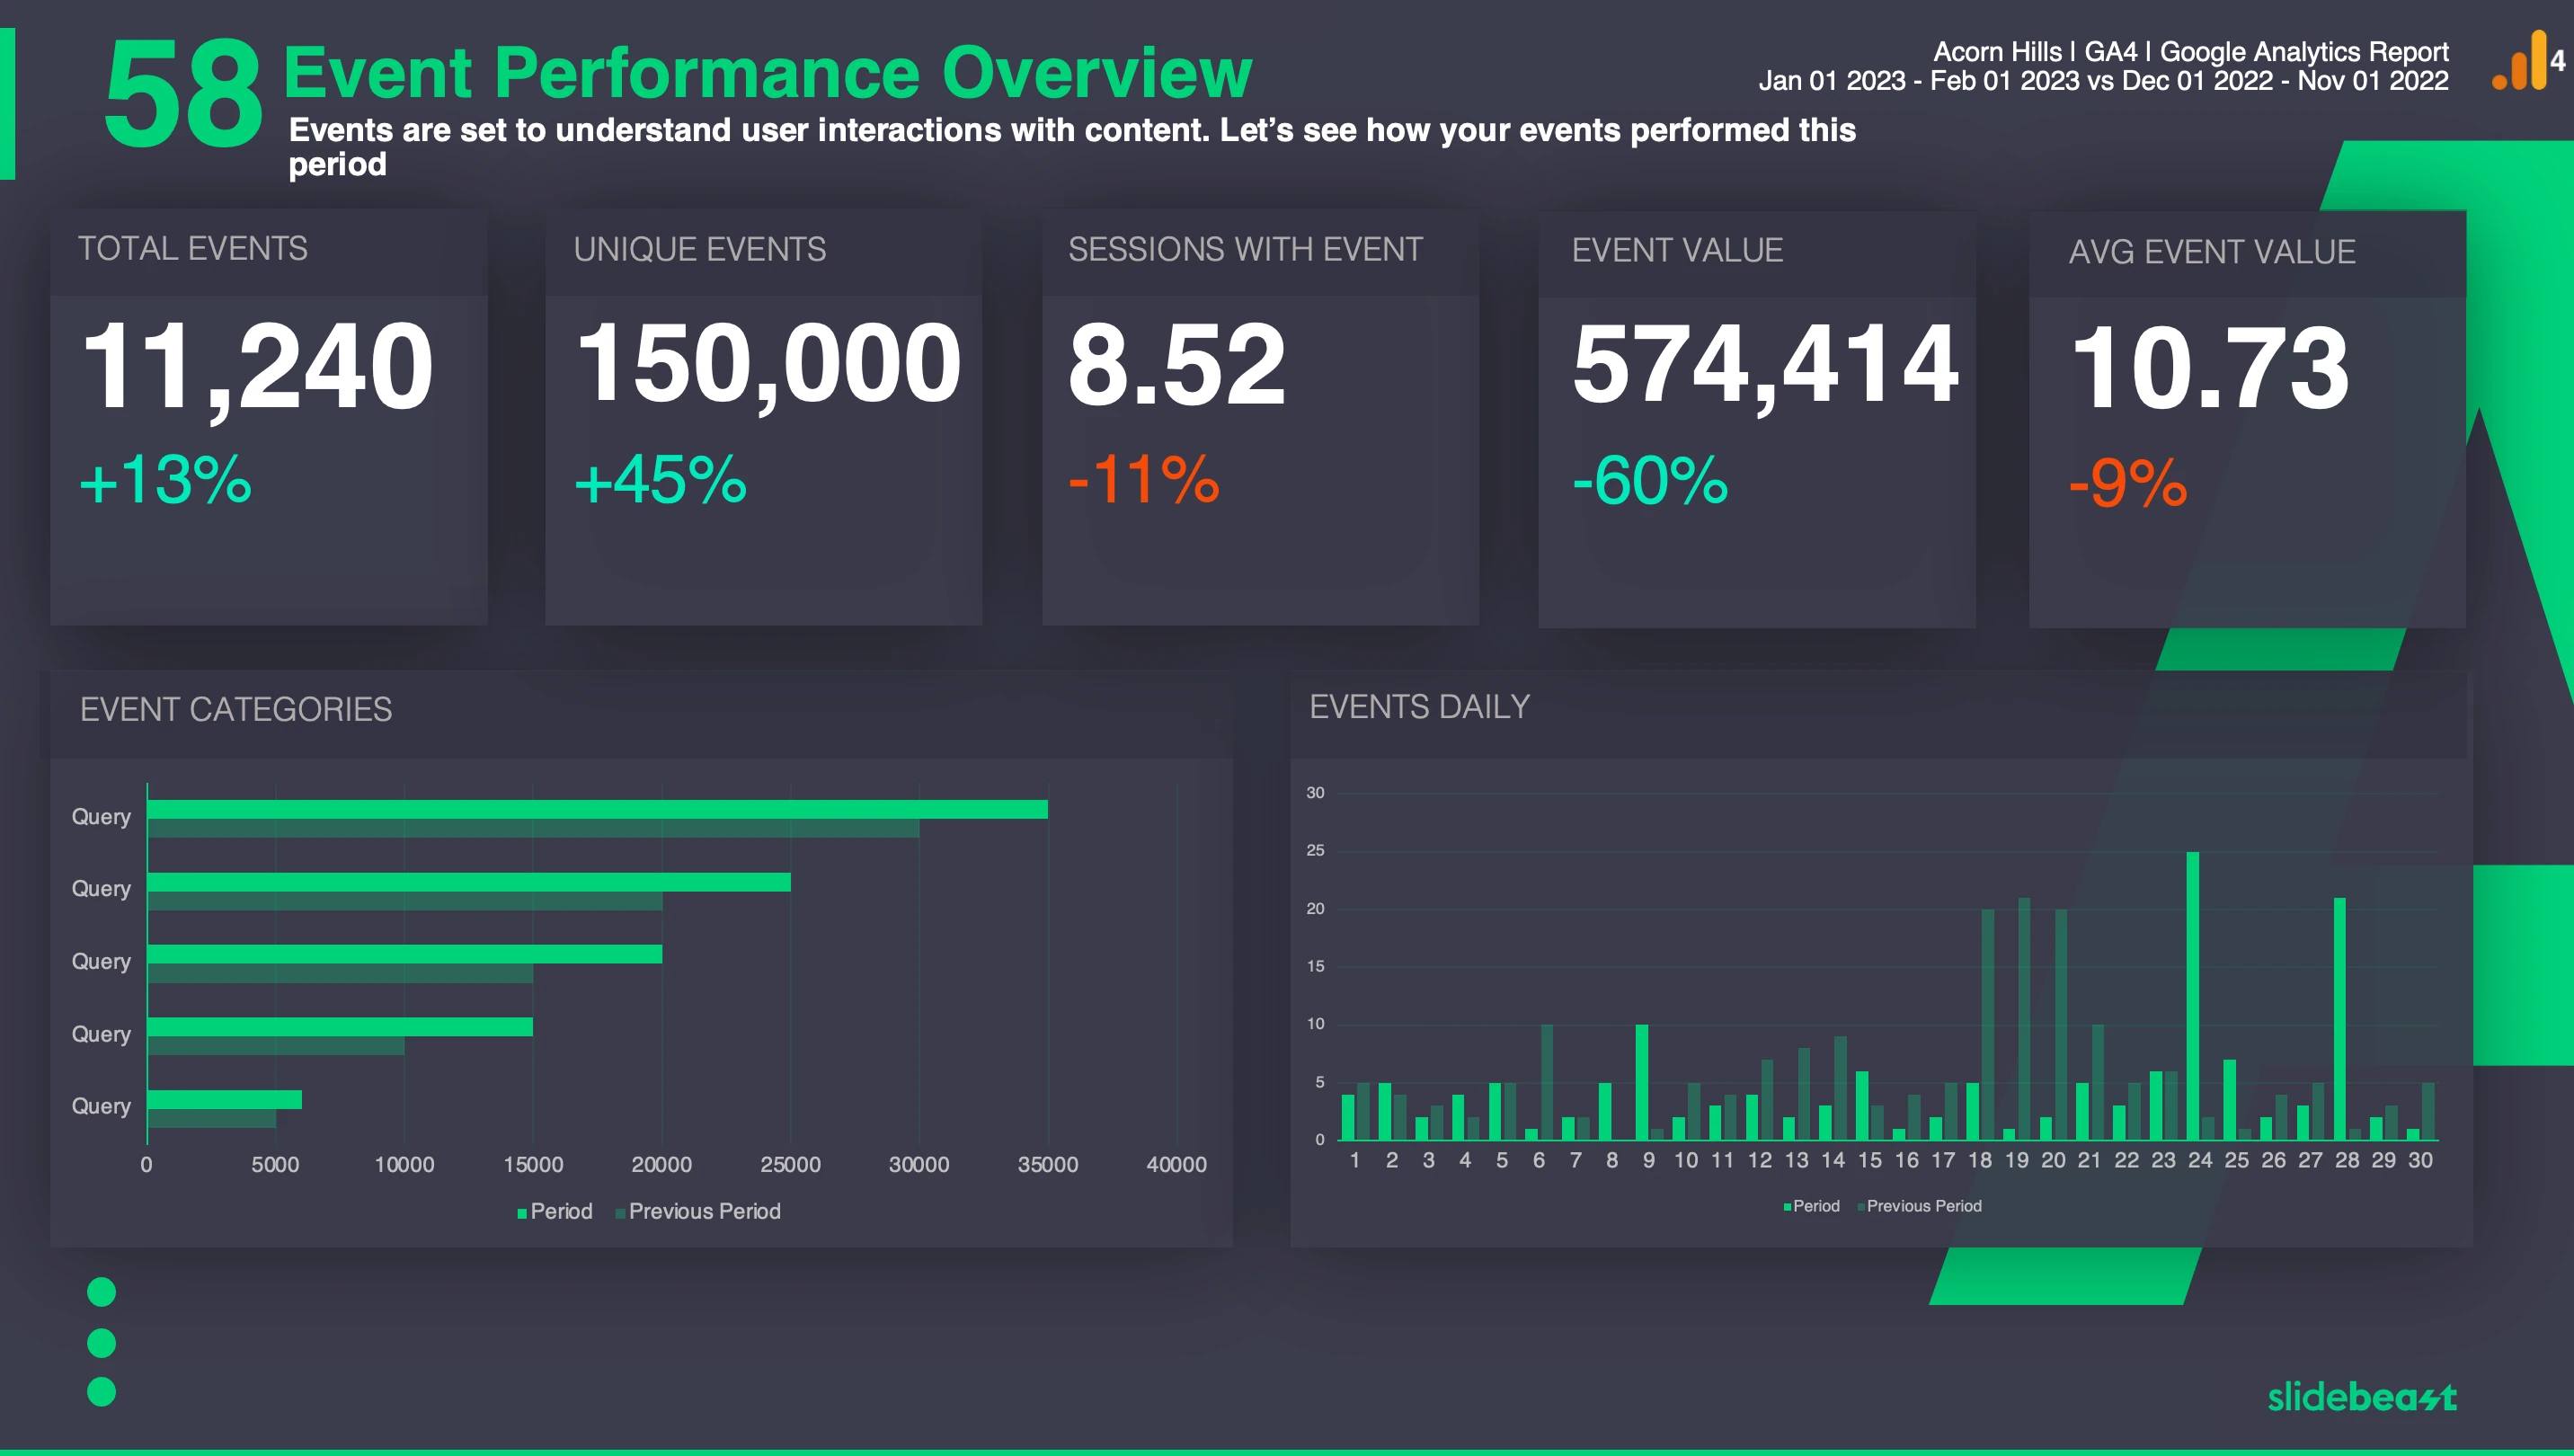
Top Events in terms of actions and categories.
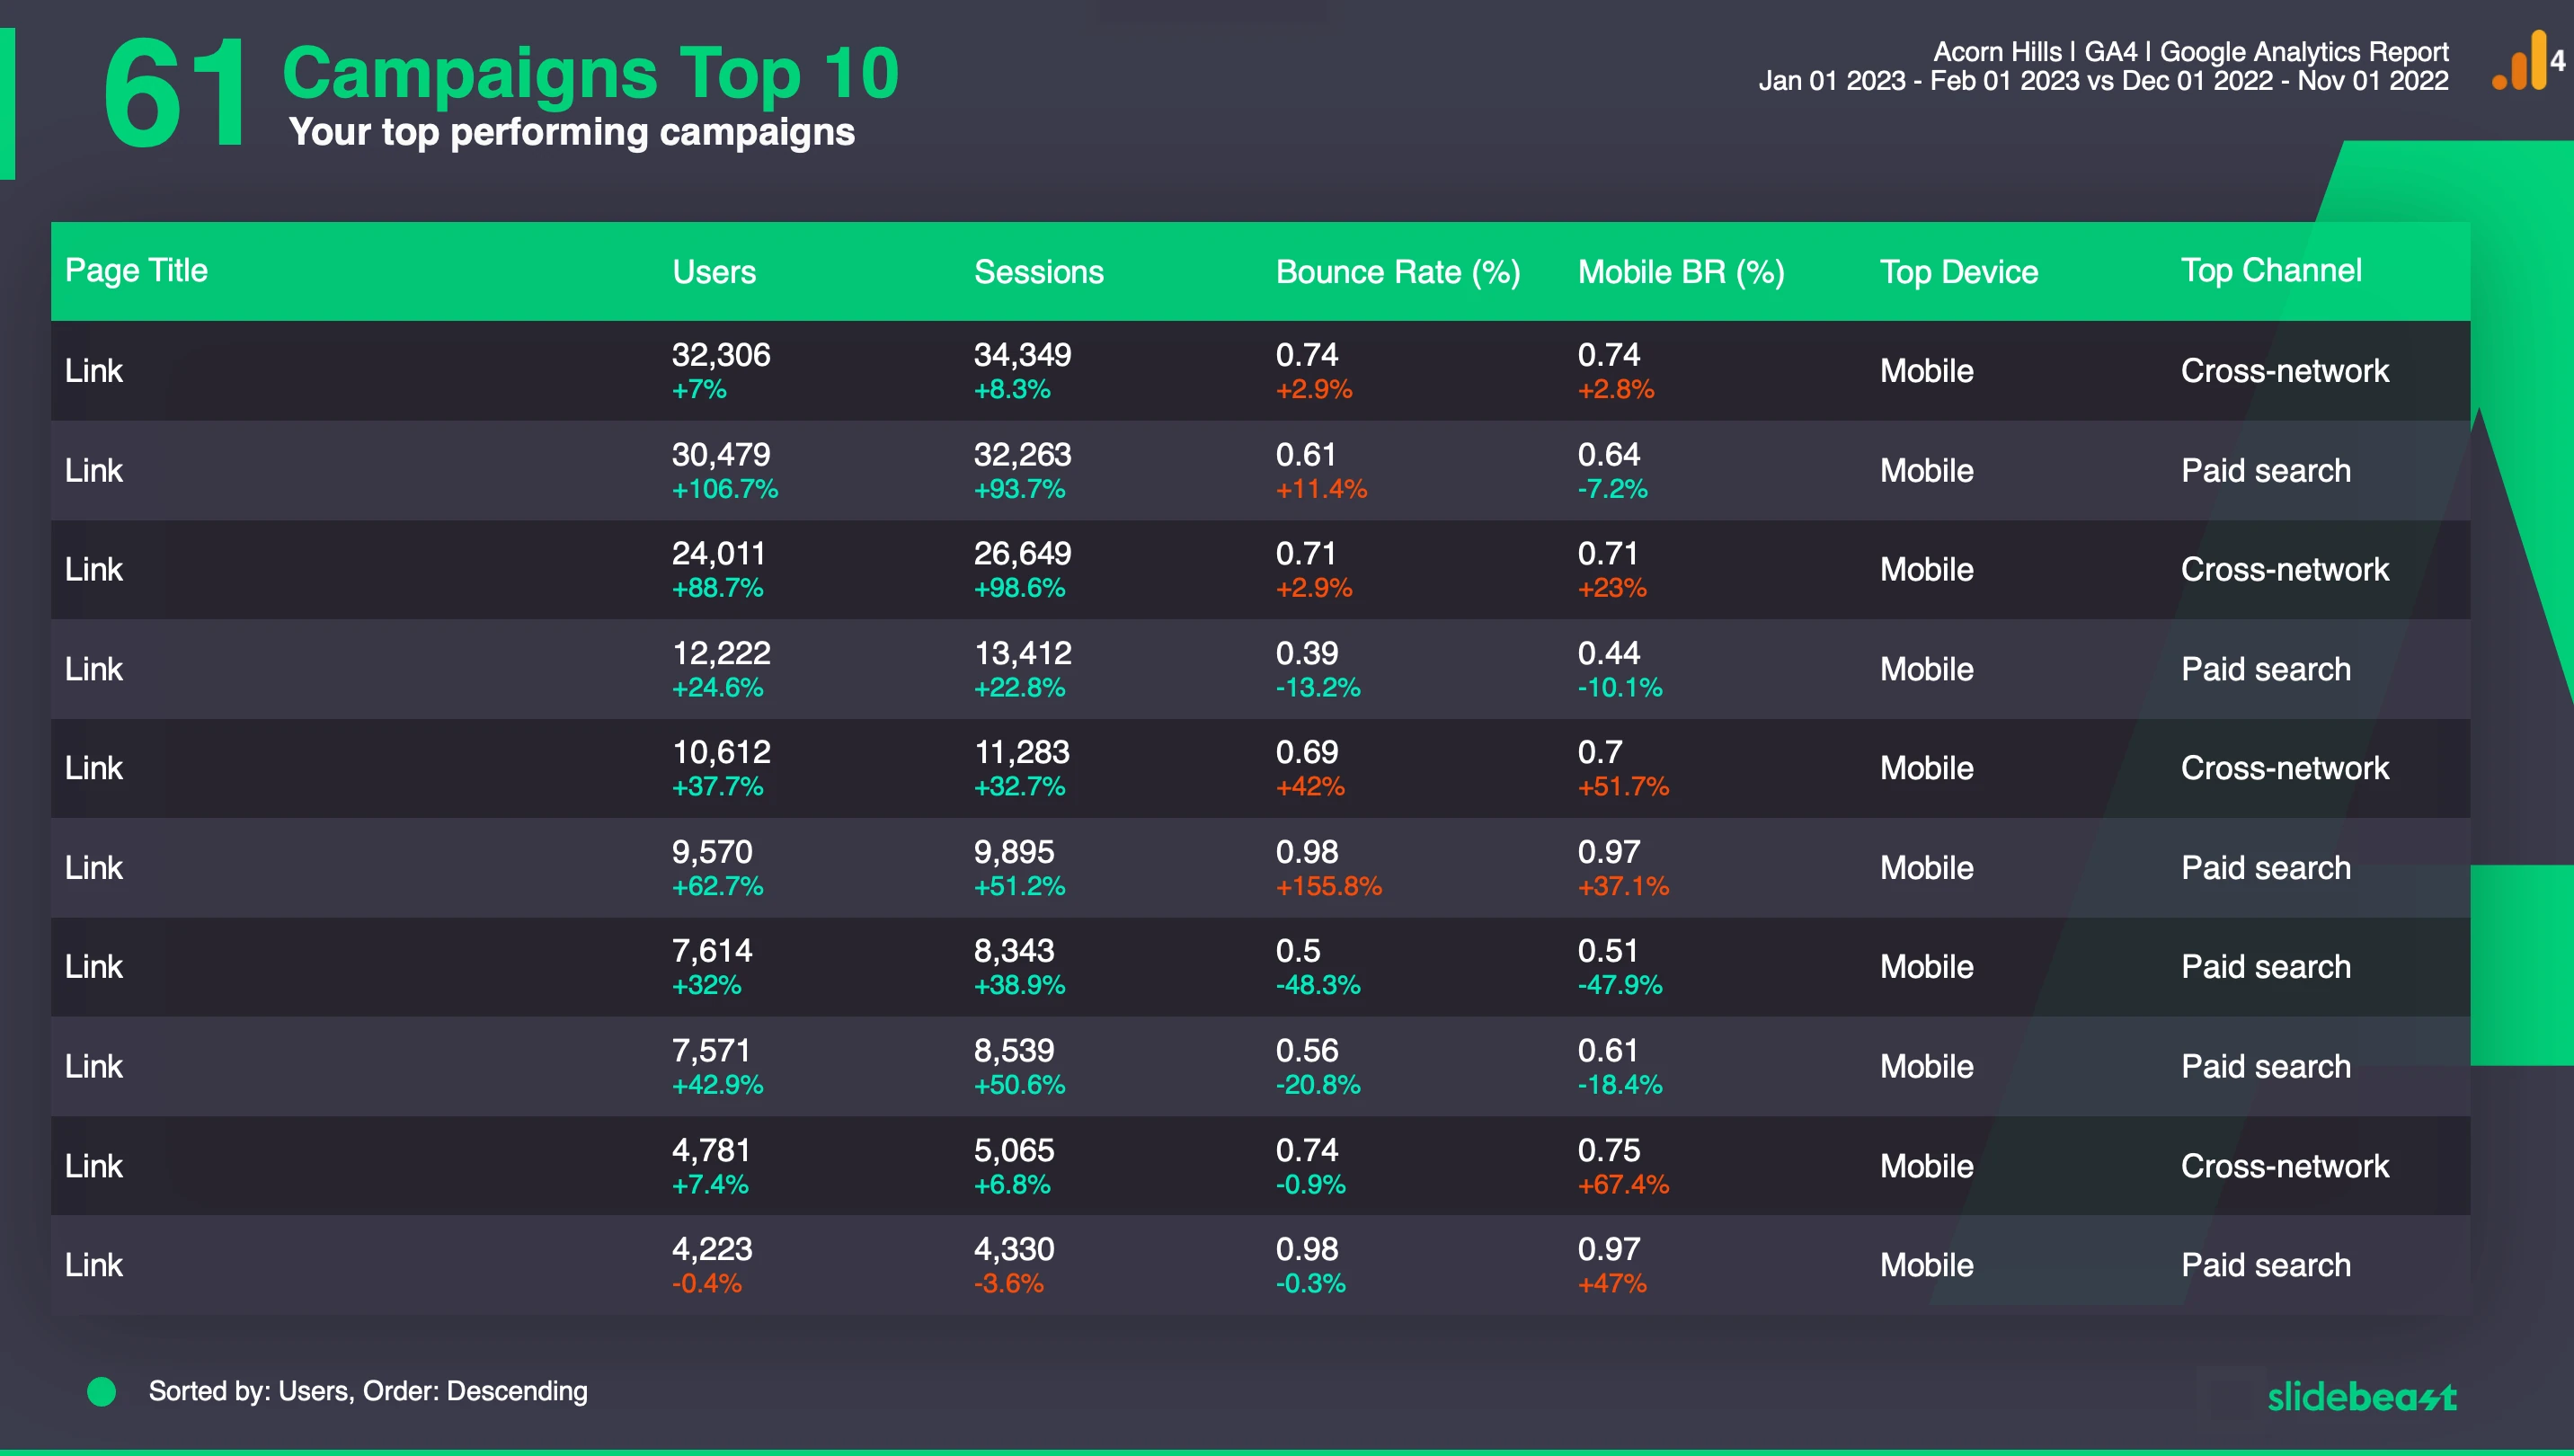
All the information about your top 10 campaigns can be found in these 3 slides.
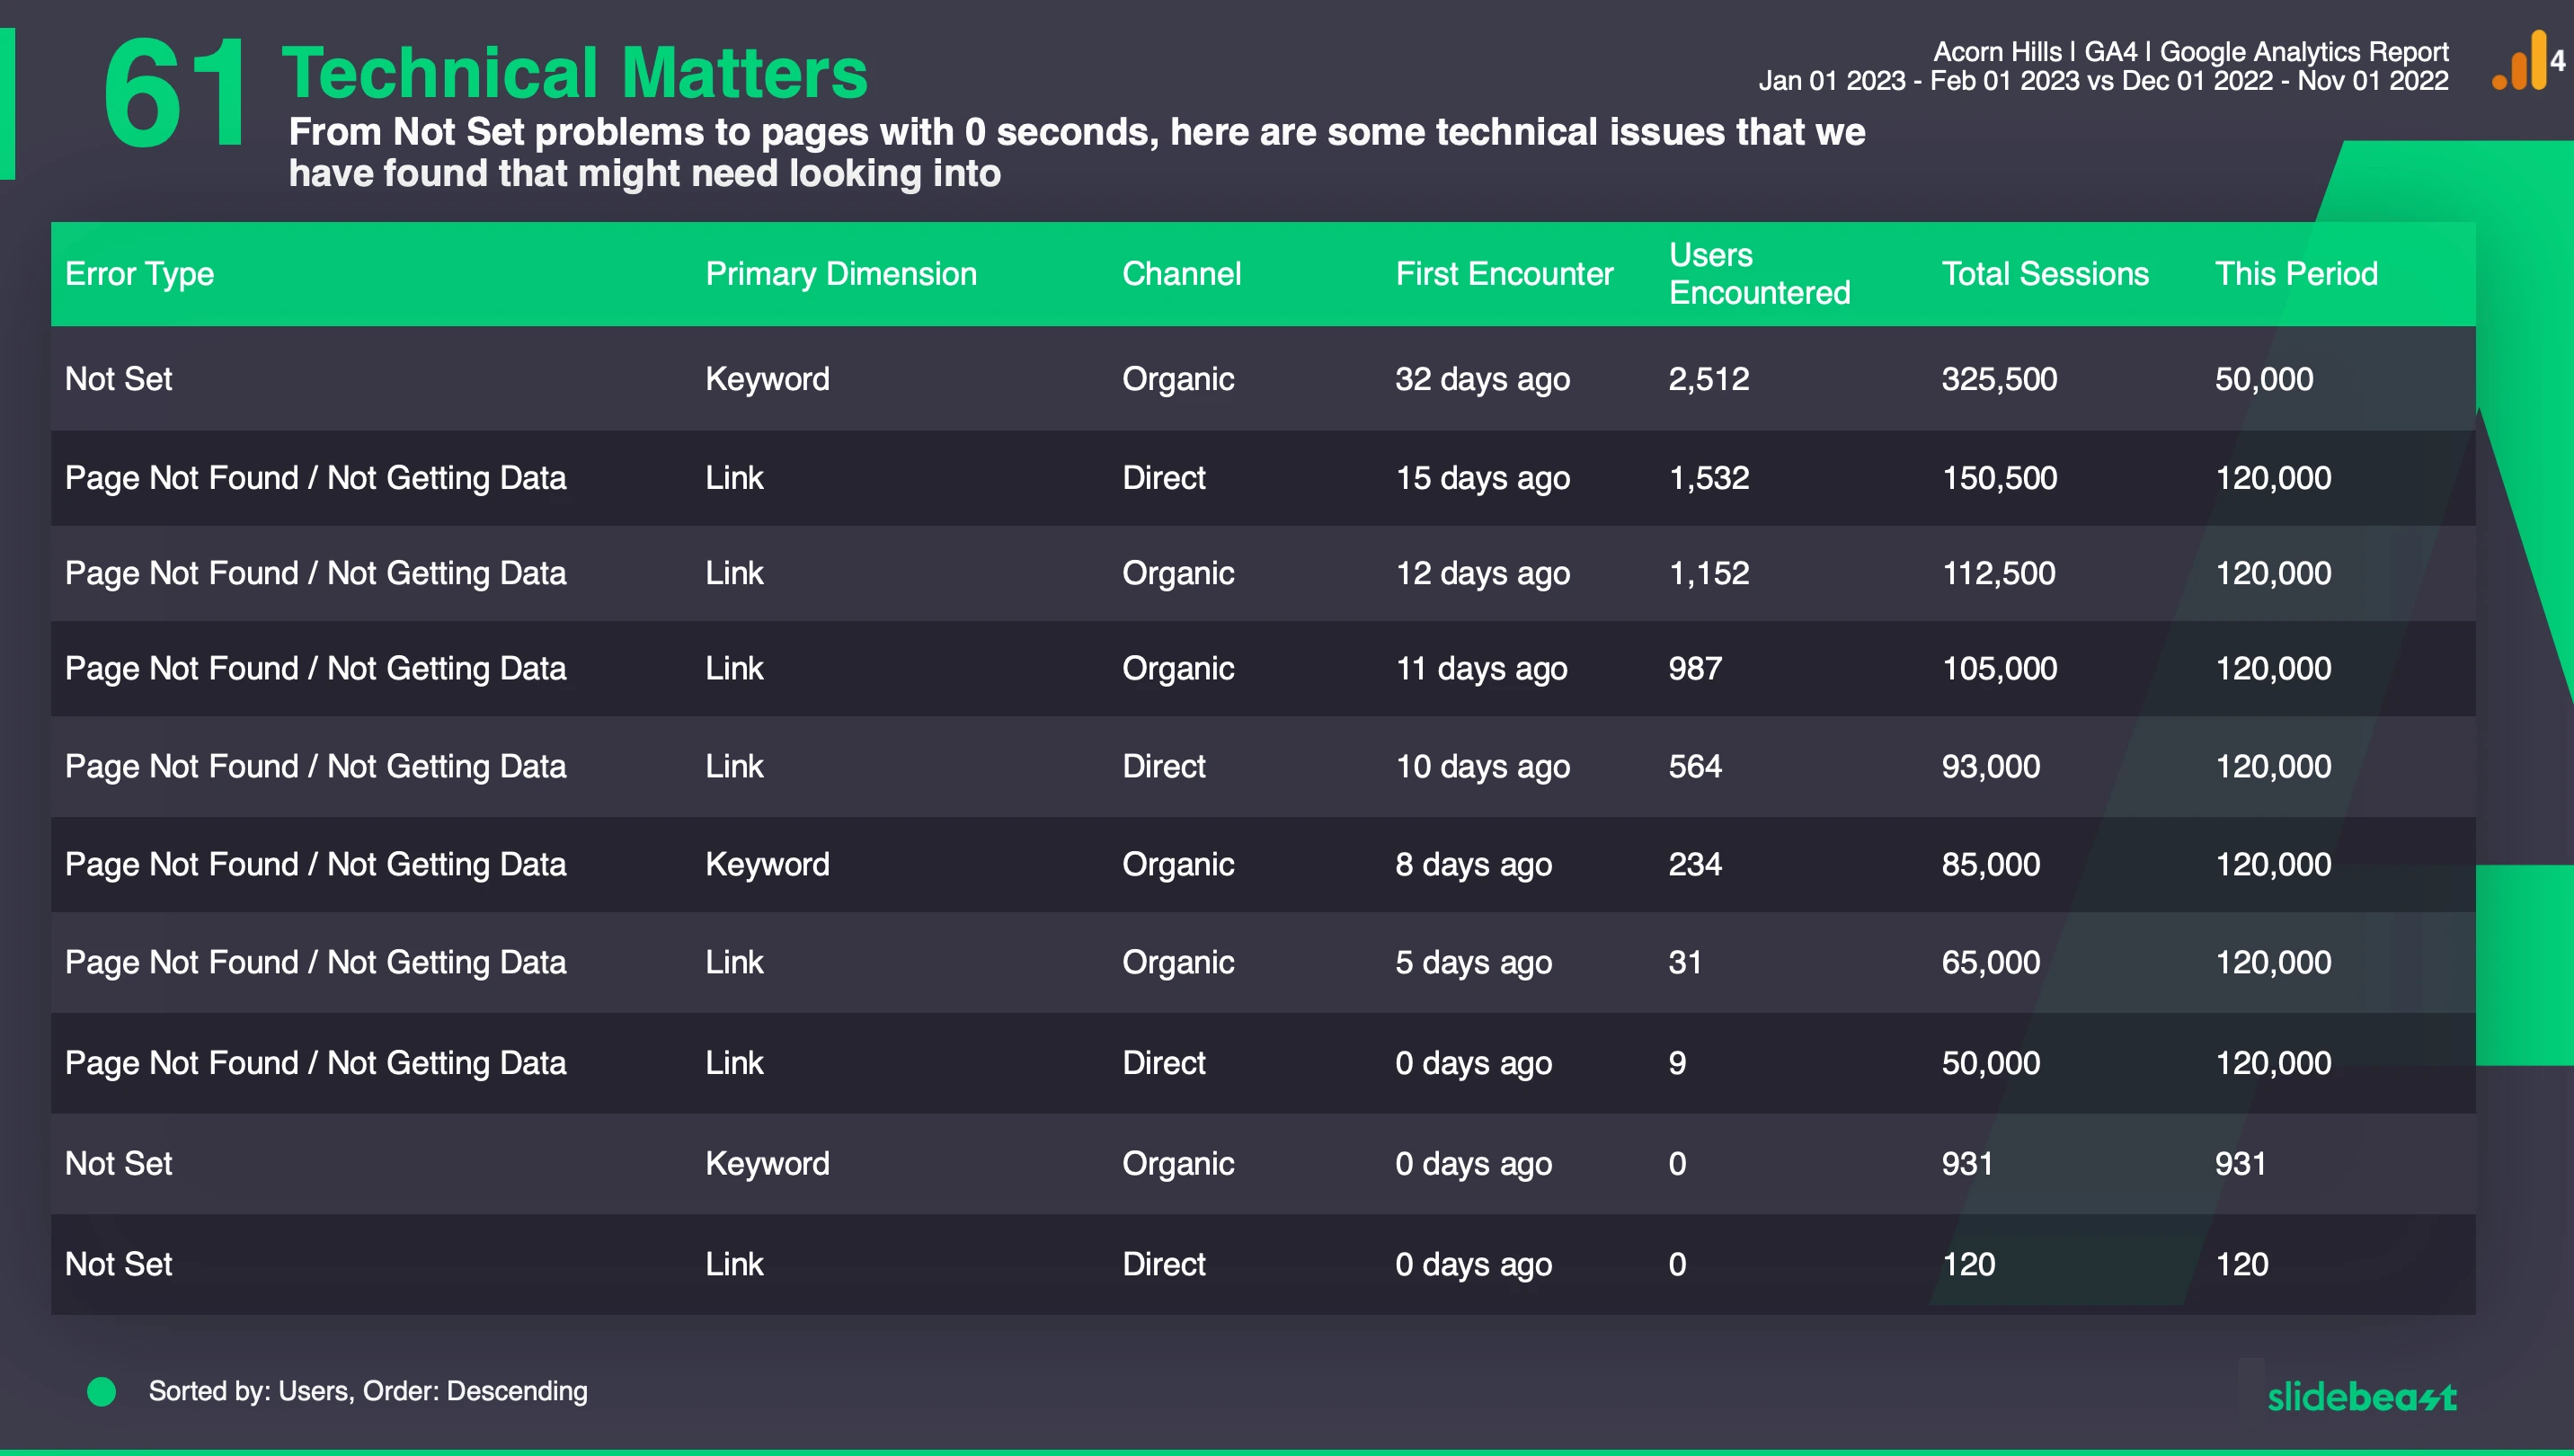
Technical problems, errors or not sets can be found in this table.
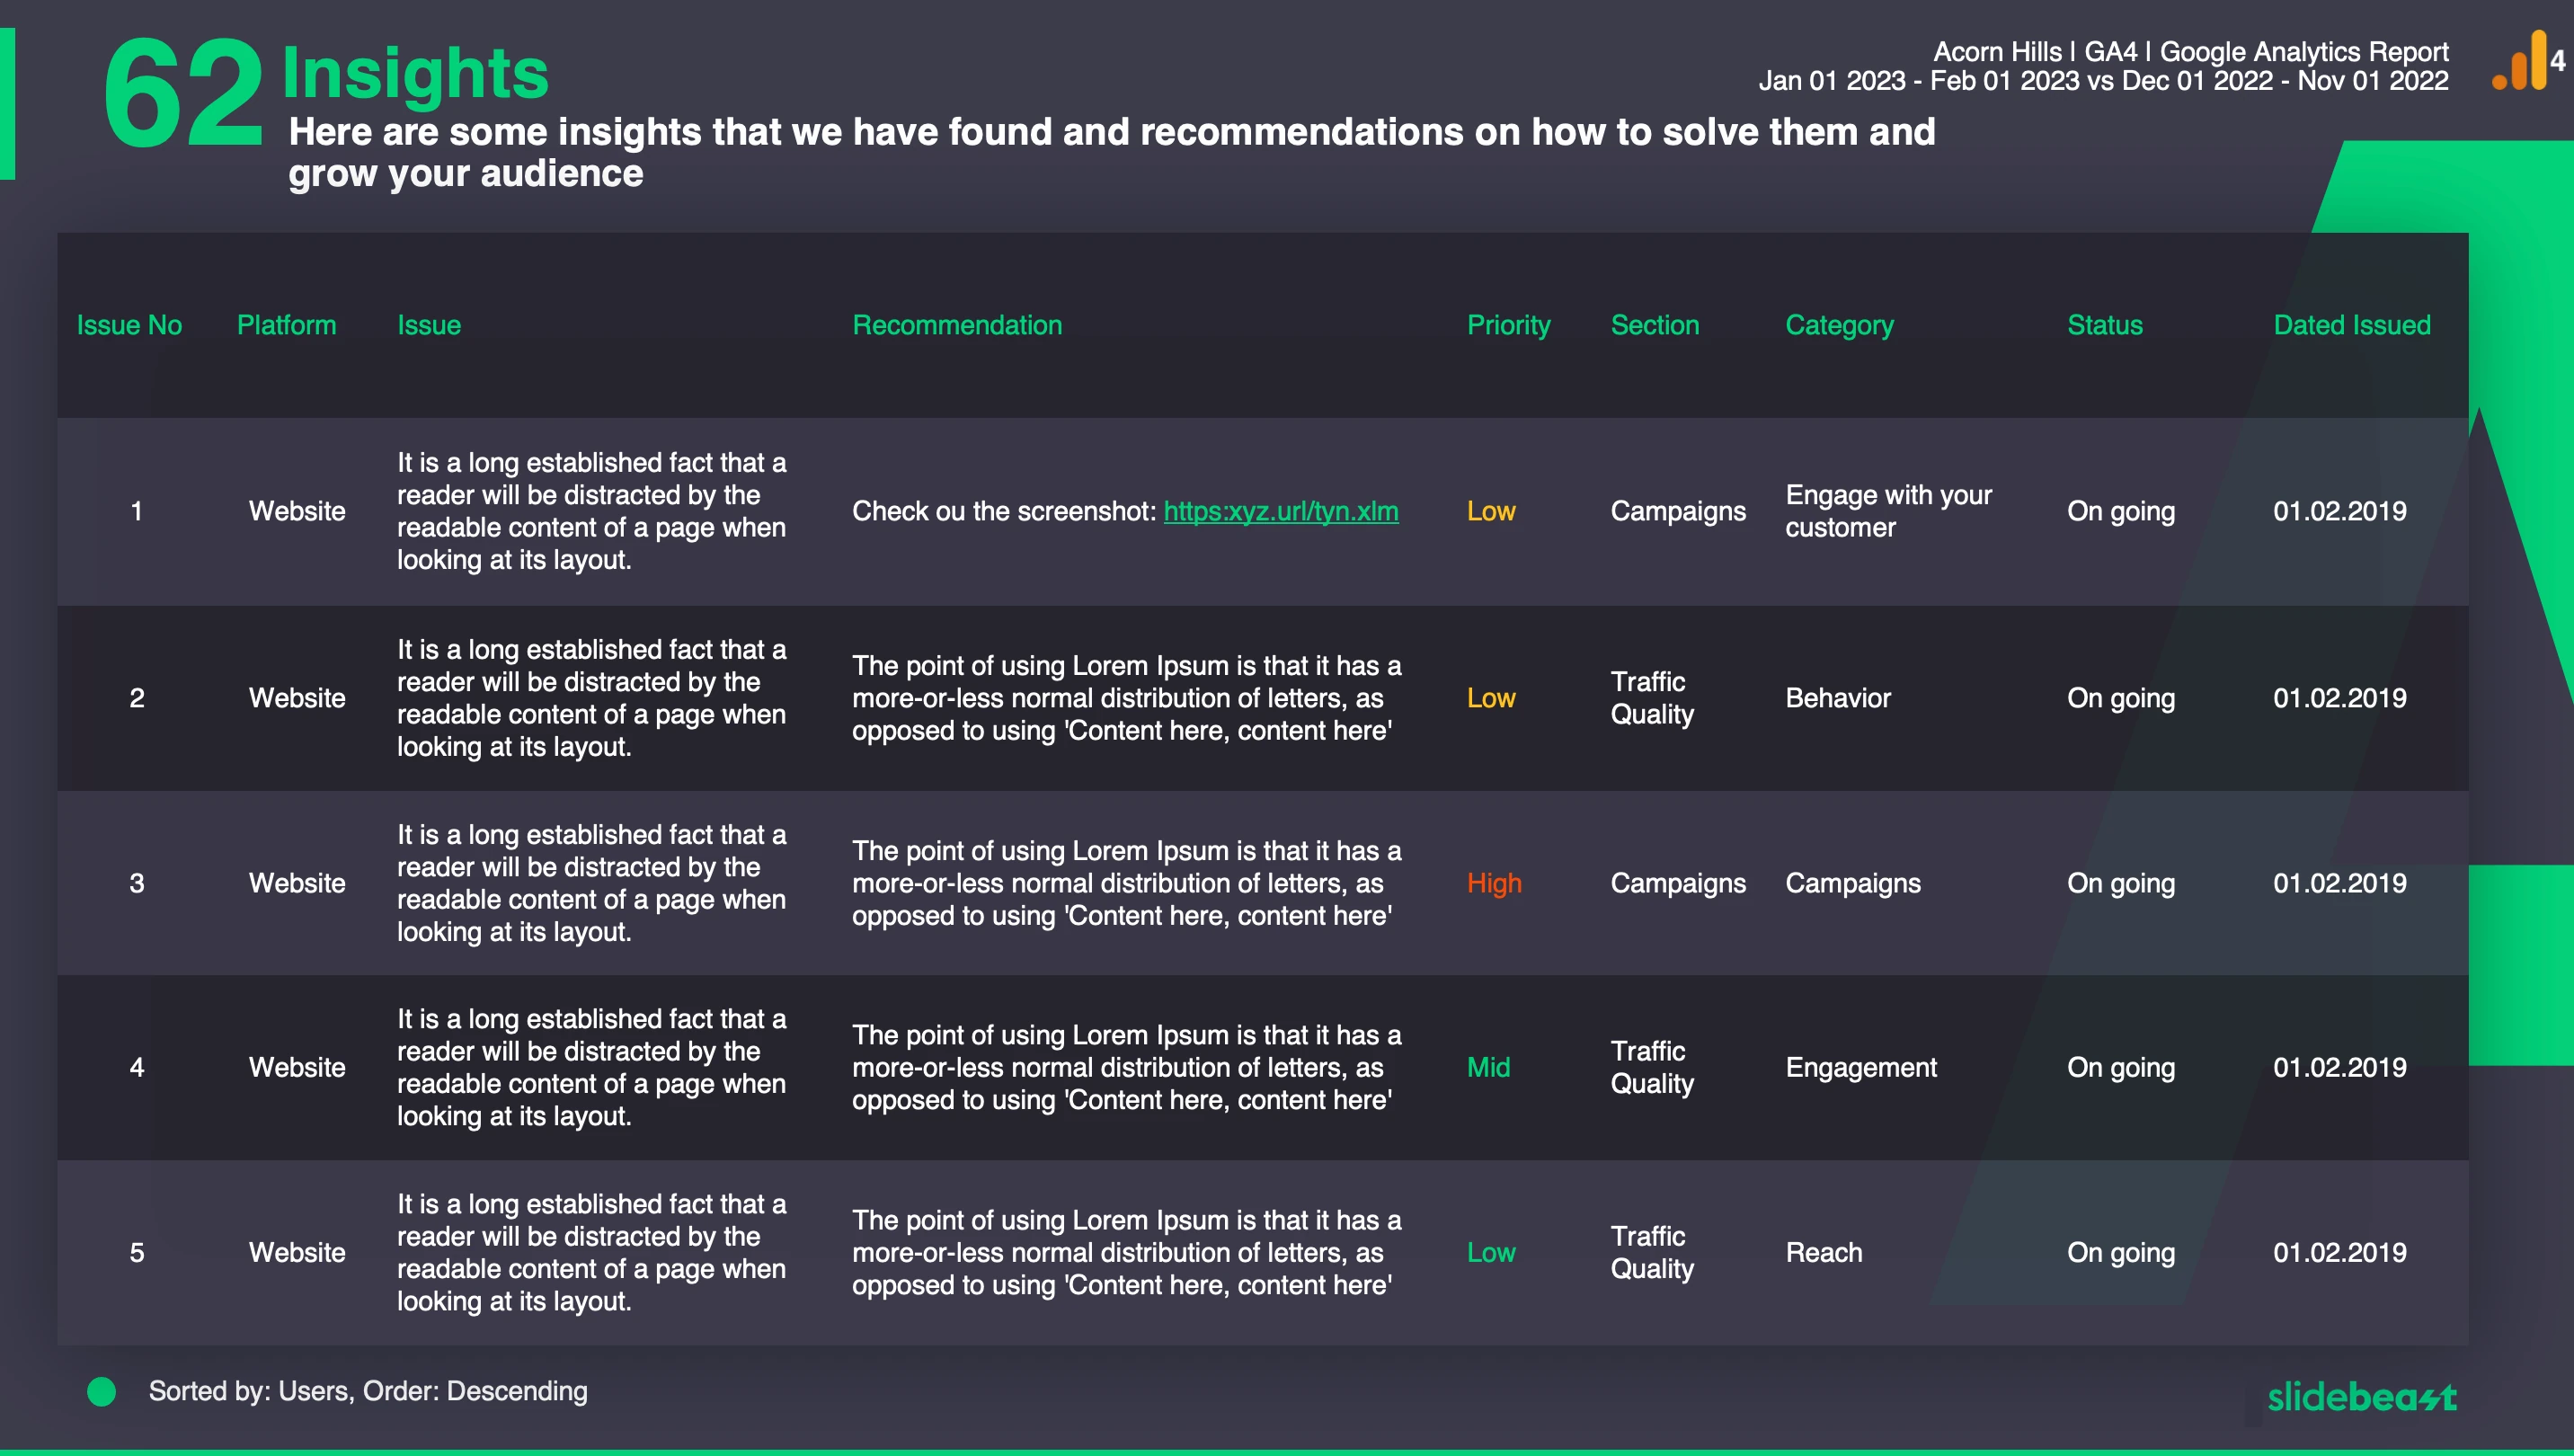
Insights about a particular report can be found in these slides. Only available on Enterprise package.
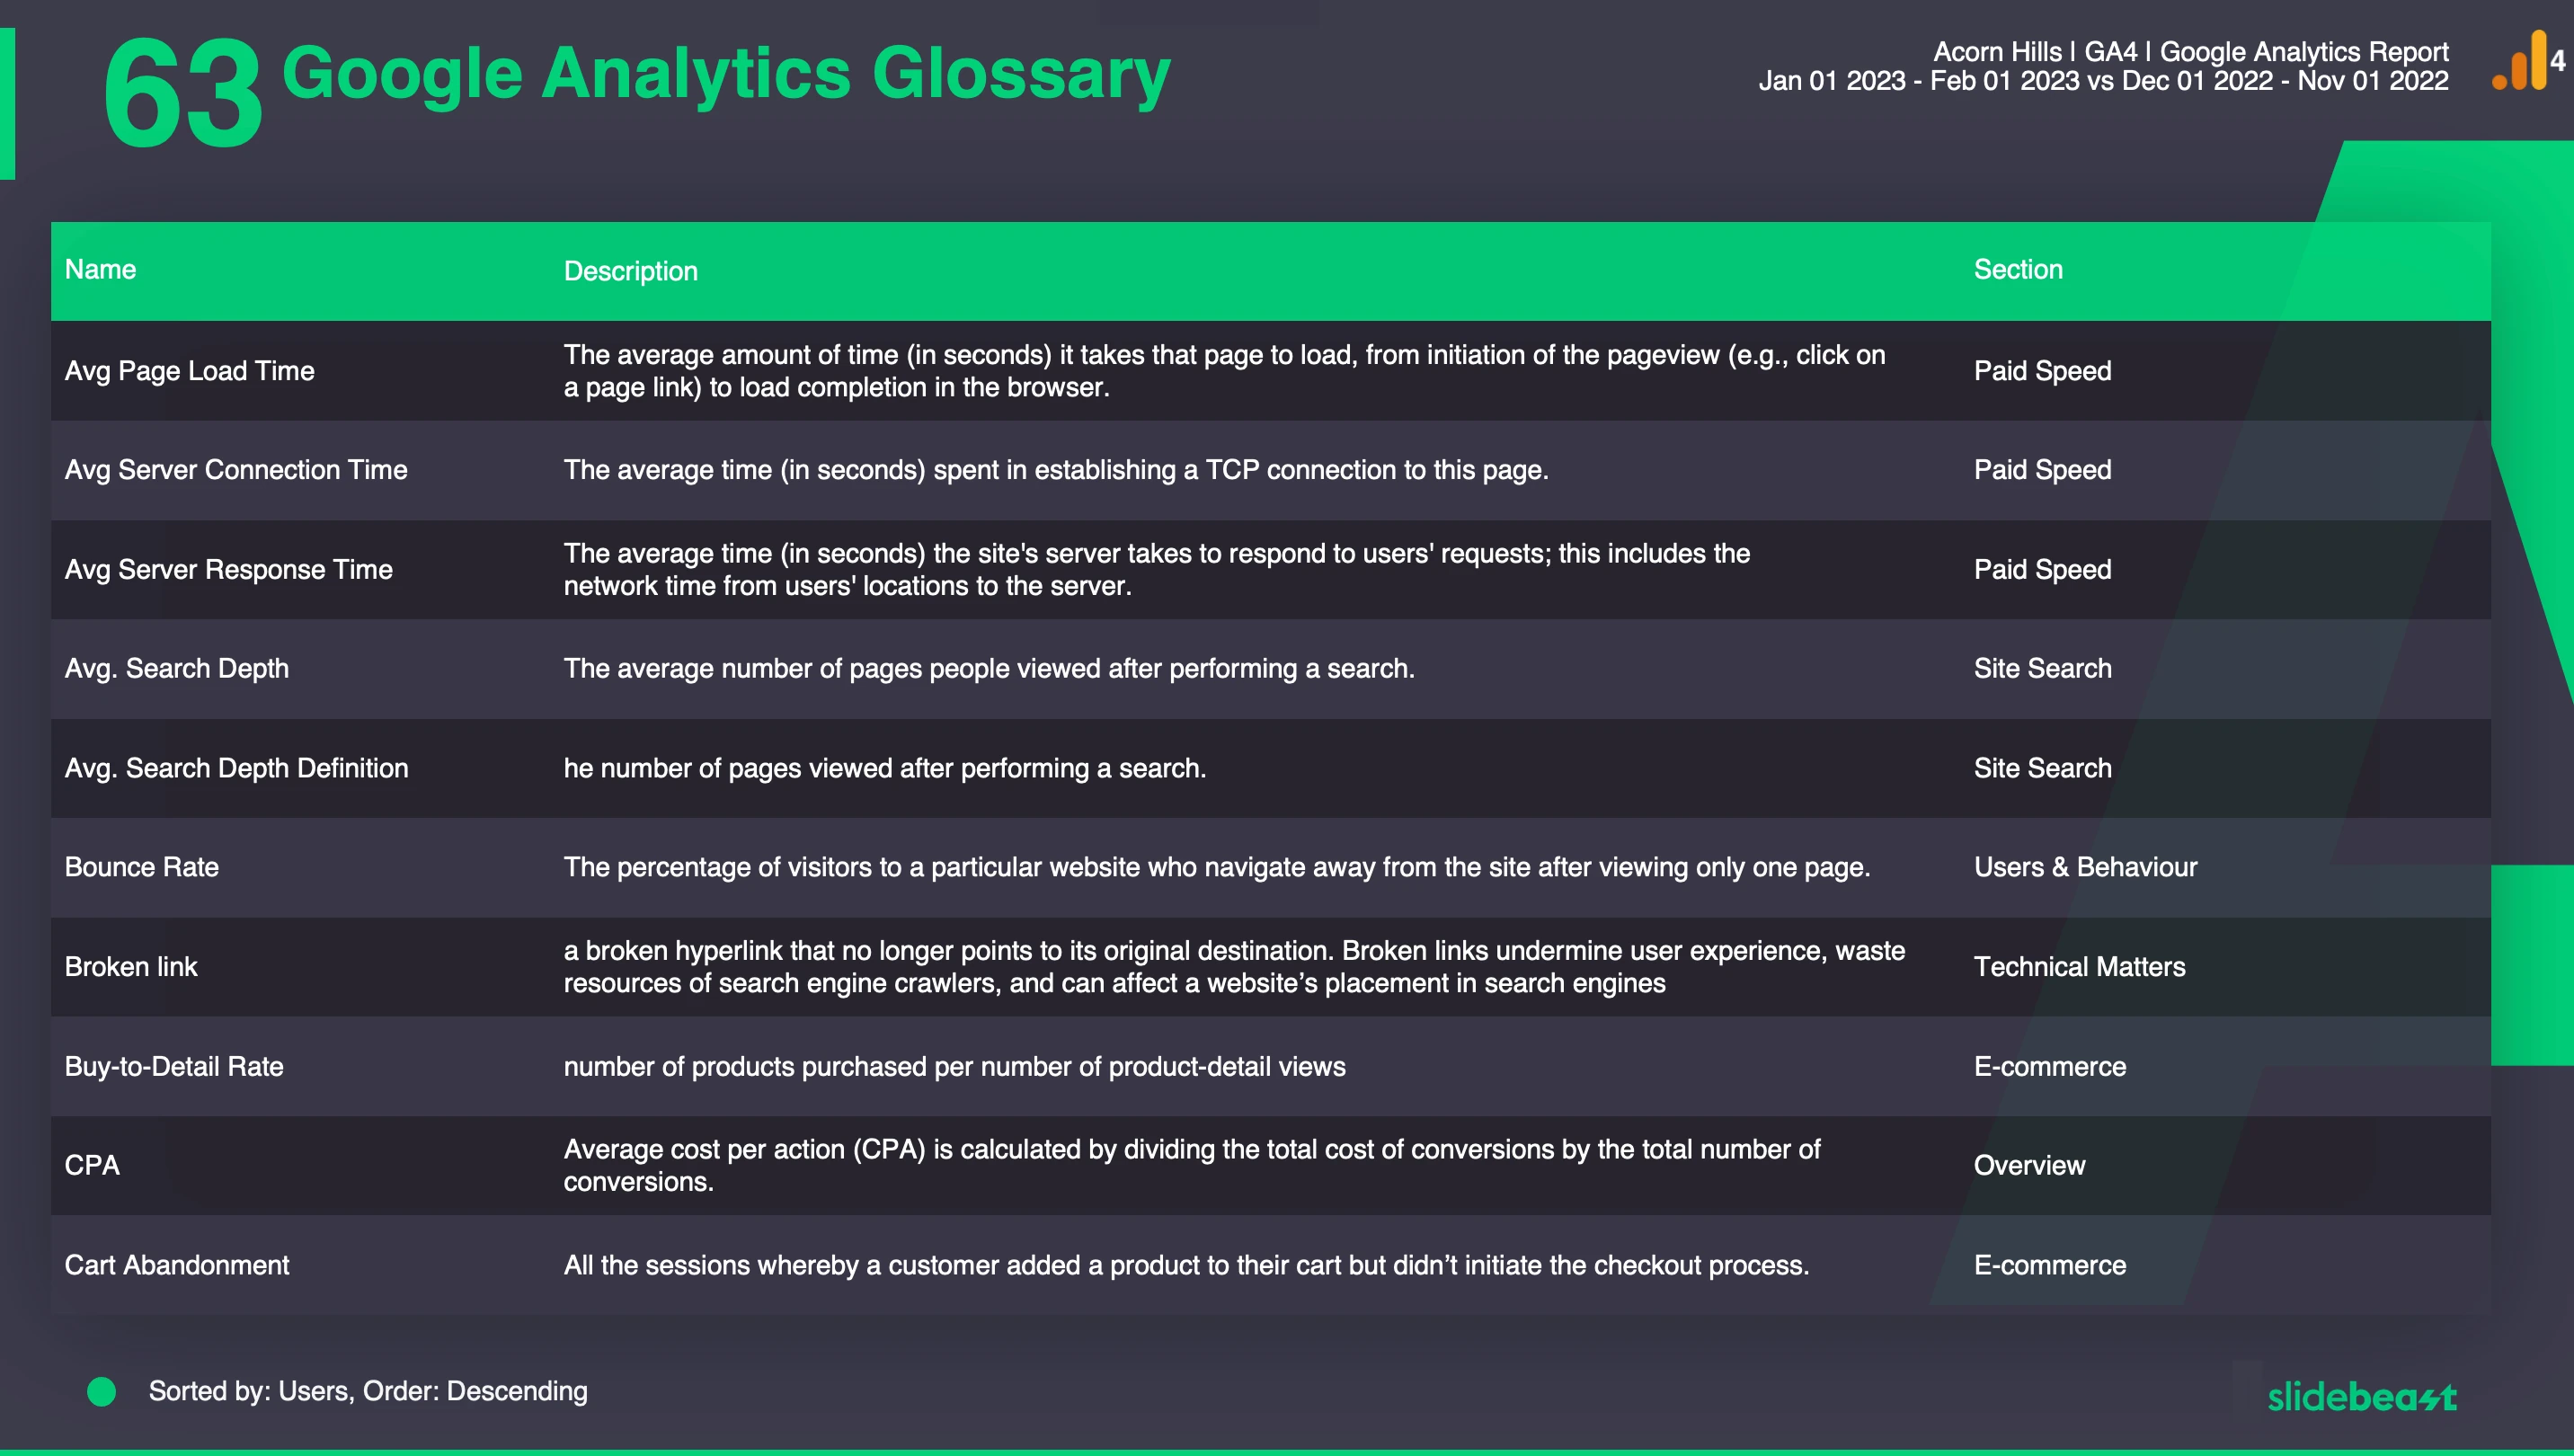
Glossary section of the report is a source for all wordings related to Google Analytics 4.
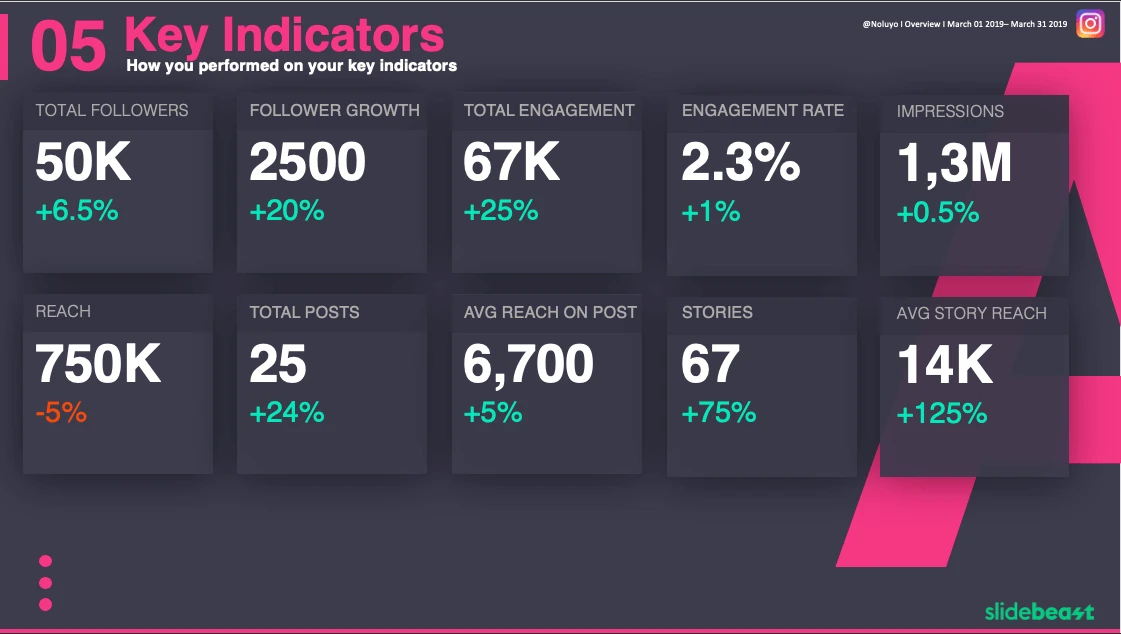
The first section of the Instagram report. Made out of 5 different slides. As its name suggests, this section acts an overview of the period.
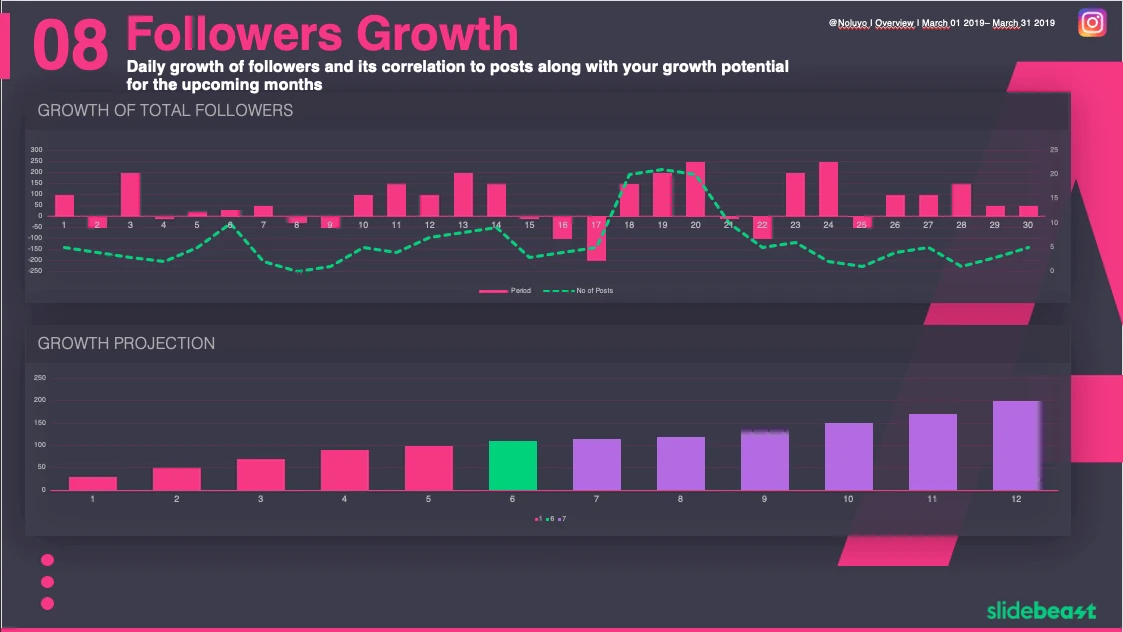
From follower growth to Demographics, 3 slides to cover all about follower performance.
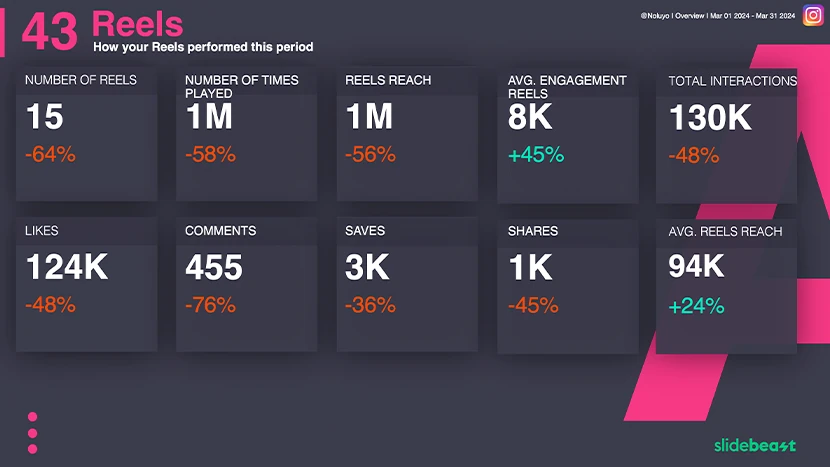
Reels section focuses on anything related to Reels, including top performing Reels.
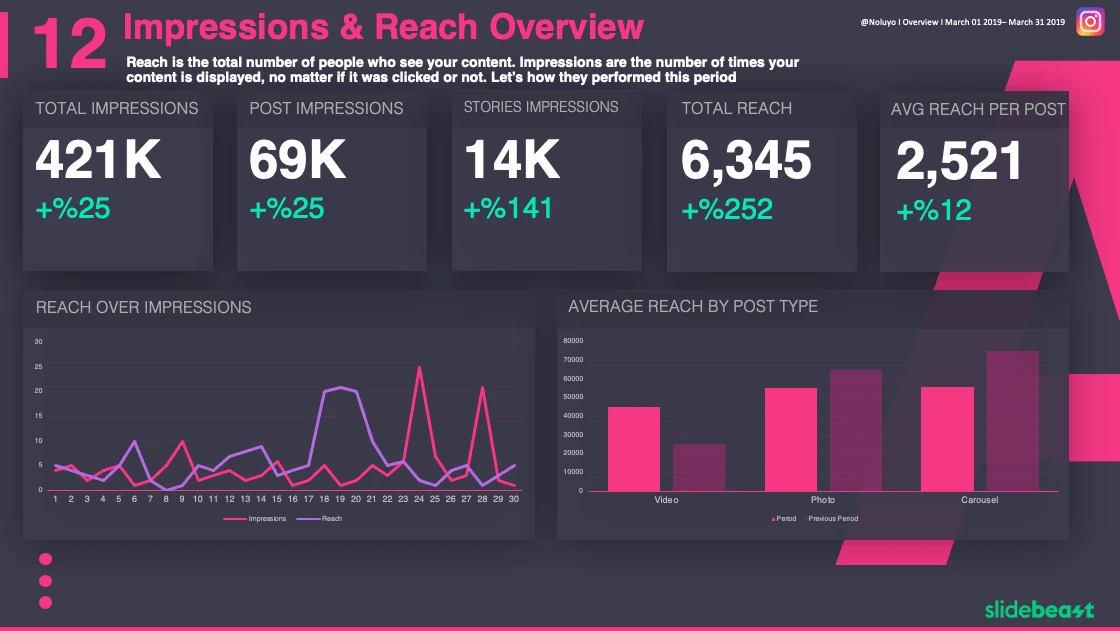
Impressions & Reach section of the report focuses on metrics that are vital to understand how organic or paid campaigns performed. 4 slides.
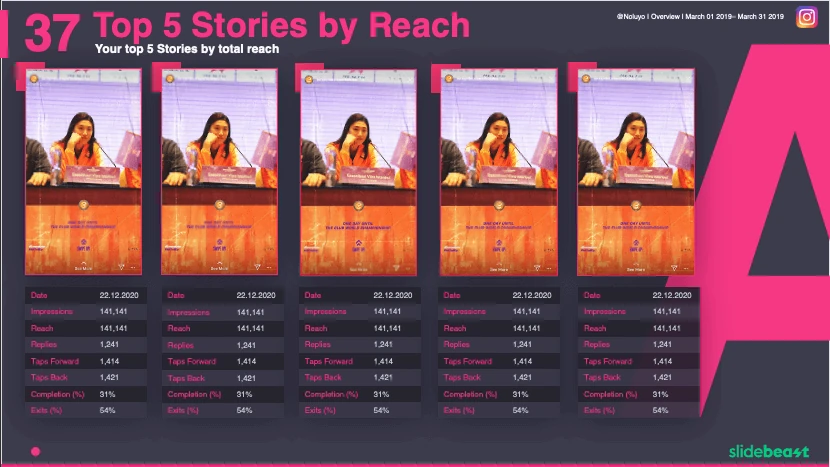
Story performance focuses on anything related to Stories, including top performing Stories.
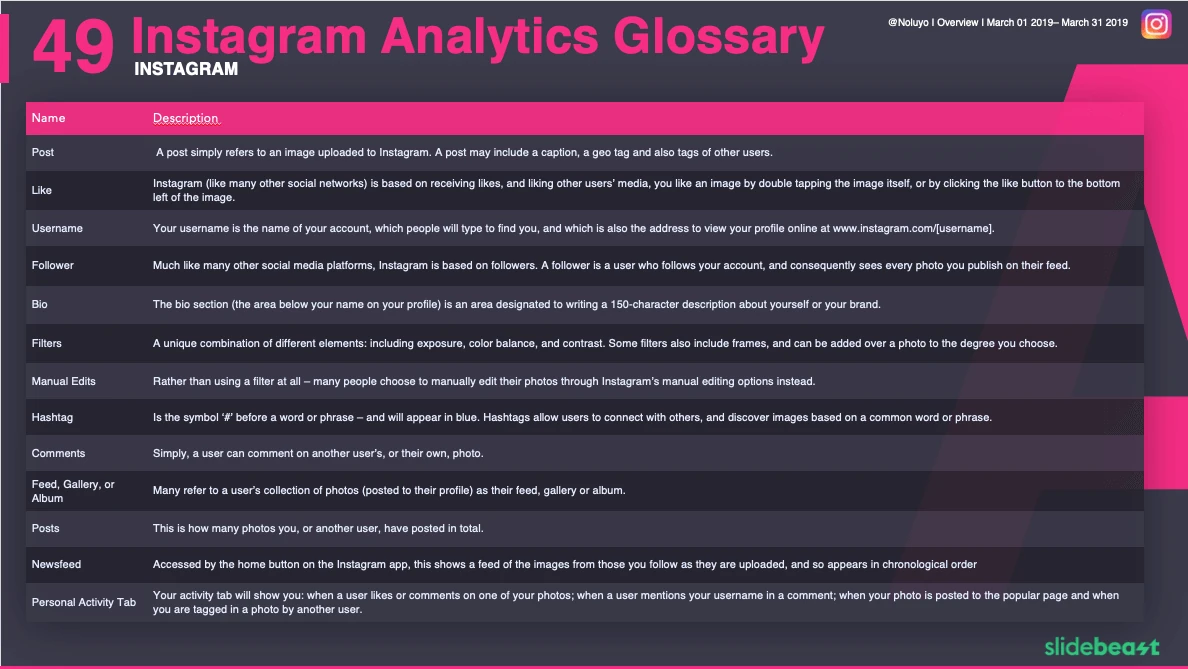
Glossary section of the report is a source for all wordings related to Instagram Analytics.
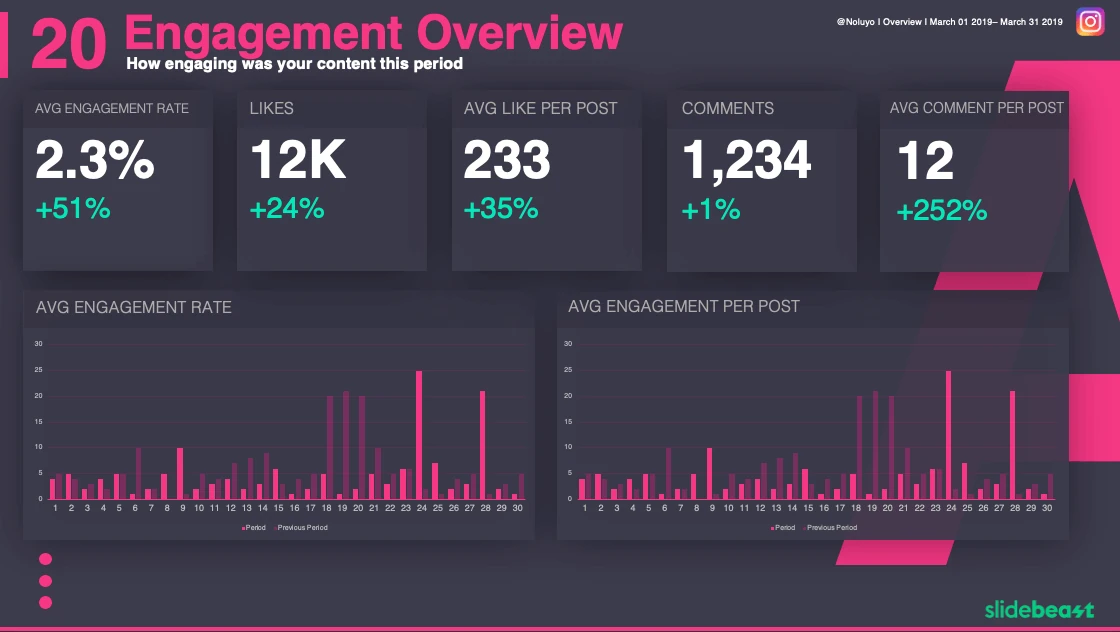
Engagement rate, engagement rate on reach, videos, saves all things related to post engagement is here in 4 slides.
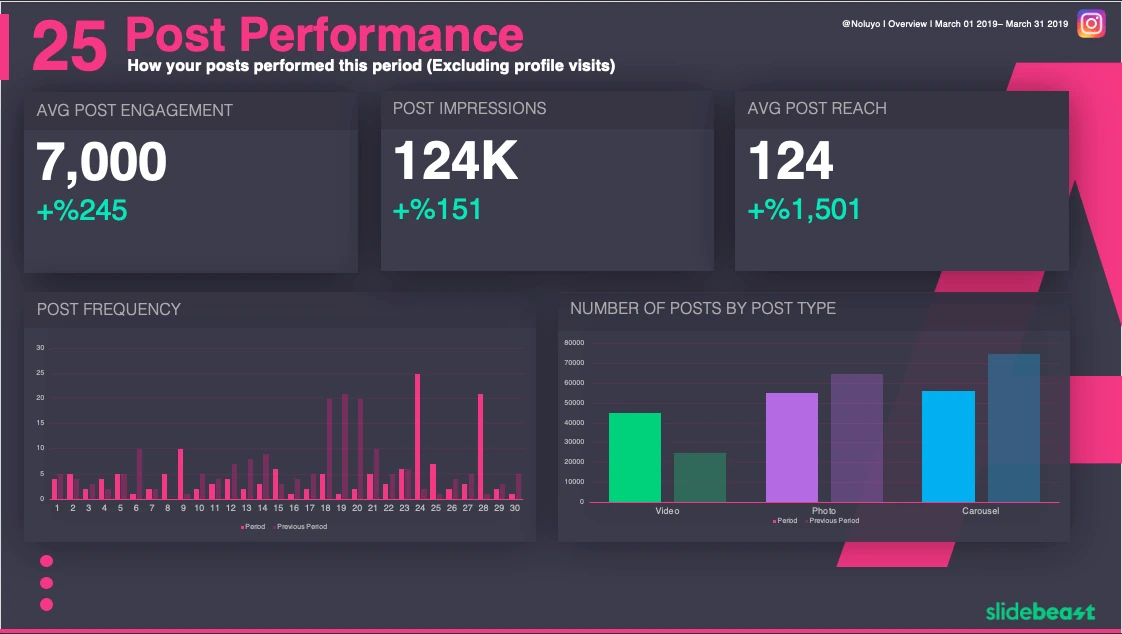
These 8 slides focuses on anything related to posts, including top performing posts, time to post and more.
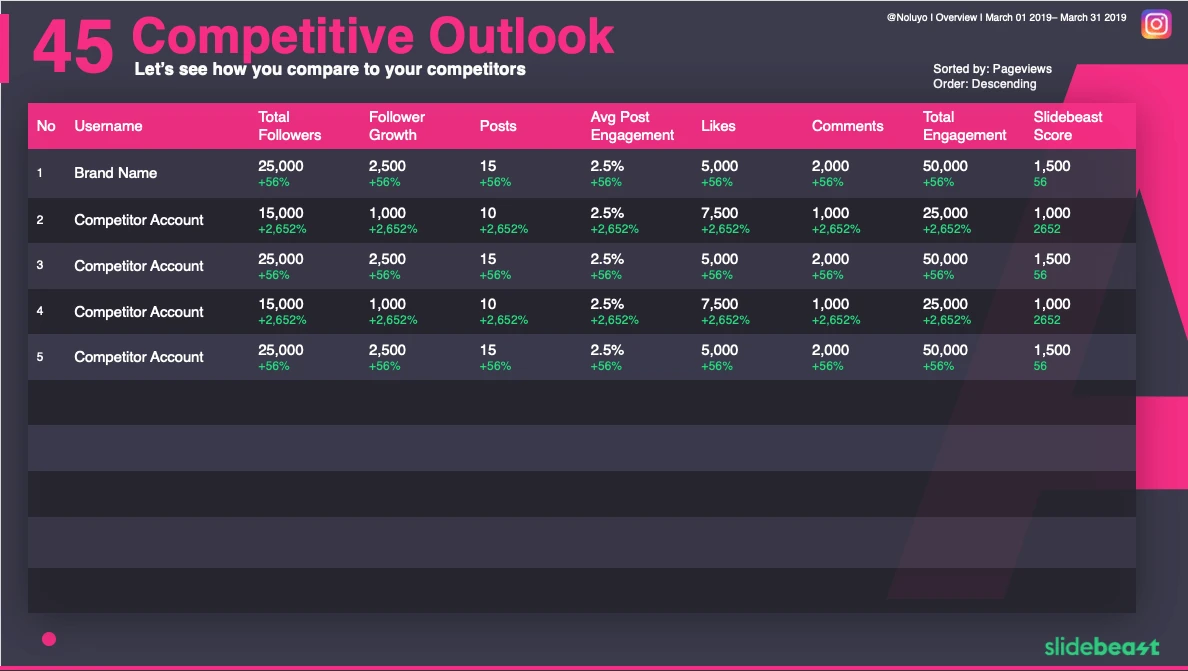
This section focuses on competitor performance.
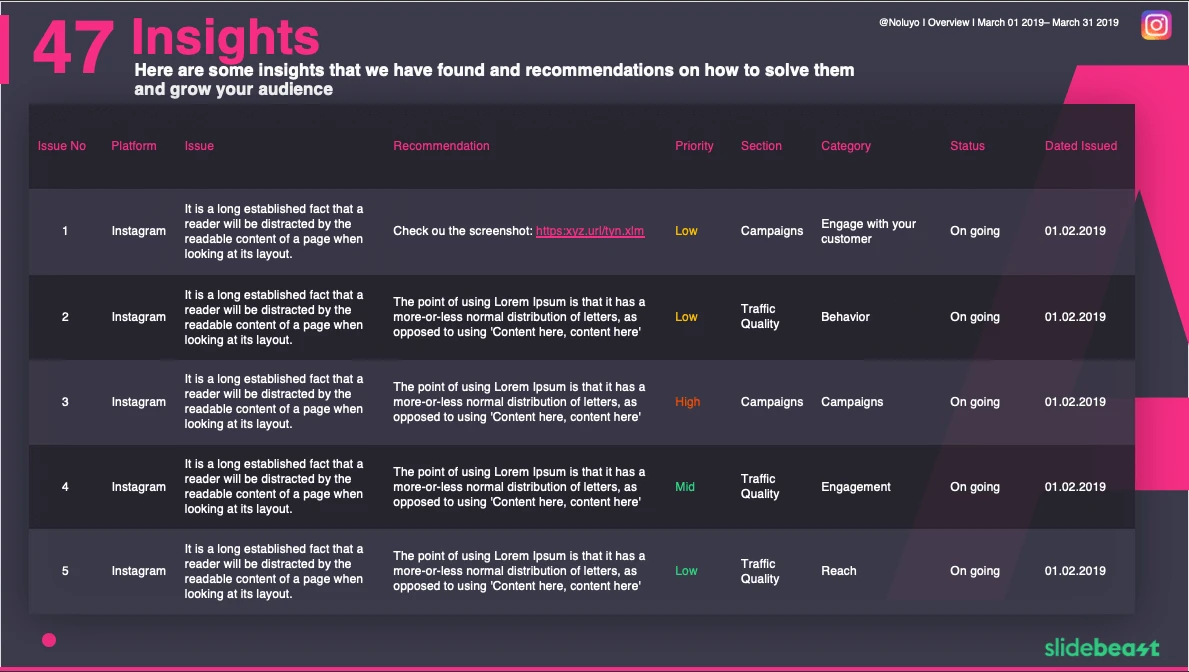
Insights about a particular report can be found in these slides. Only available on Enterprise package.
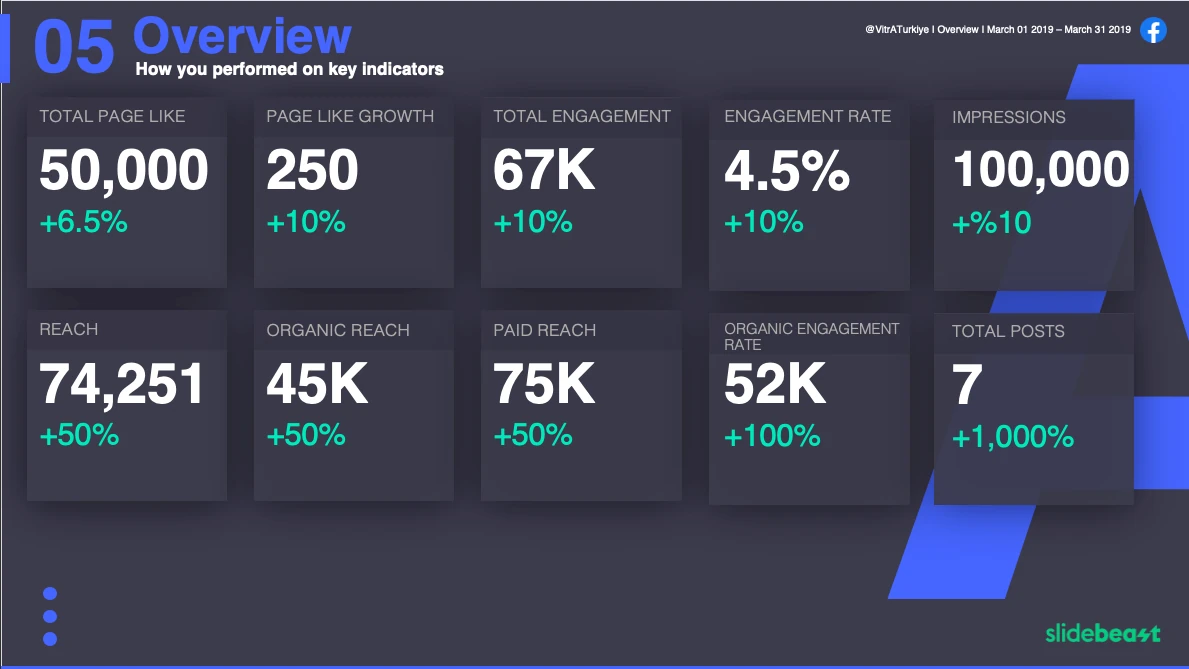
The first section of the Facebook report. Made out of 2 different slides. As its name suggests, this section acts an overview of the period.
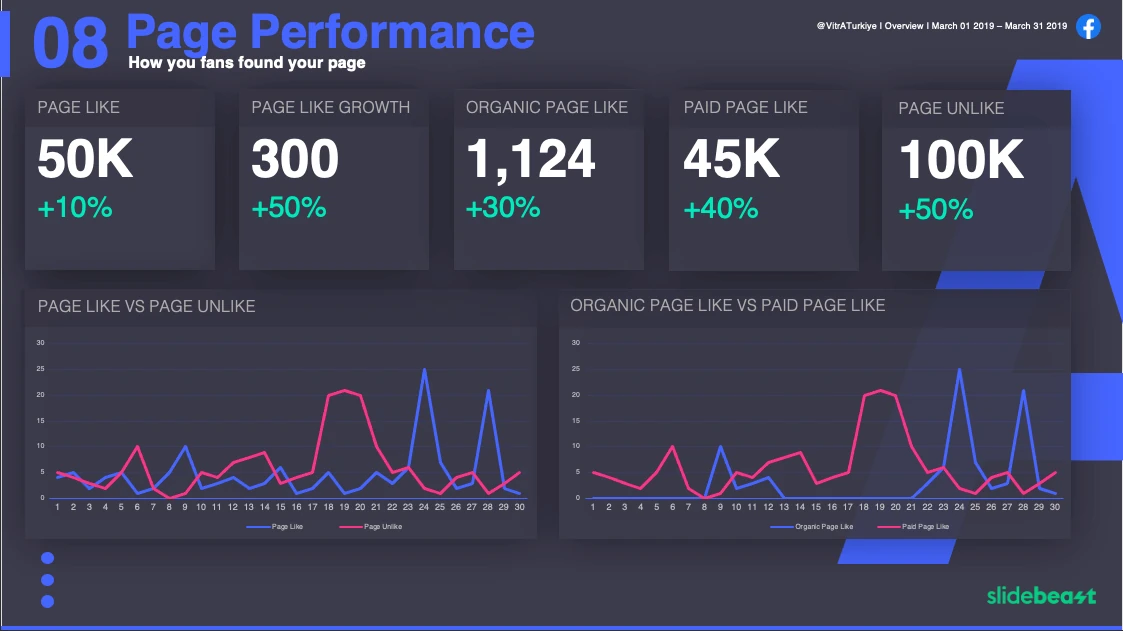
From Page Like growth to Fan Distribution, 7 slides to cover all about Page performance.
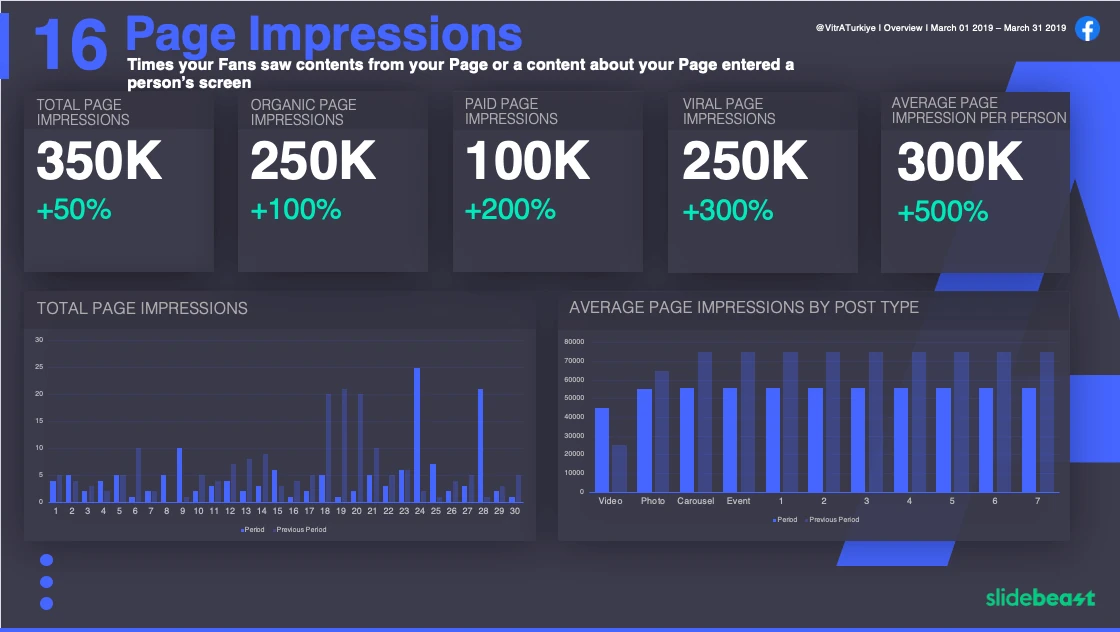
Impressions & Reach section of the report focuses on both Page and Post metrics that are vital to understand how organic or paid campaigns performed. 13 slides including Paid performance.
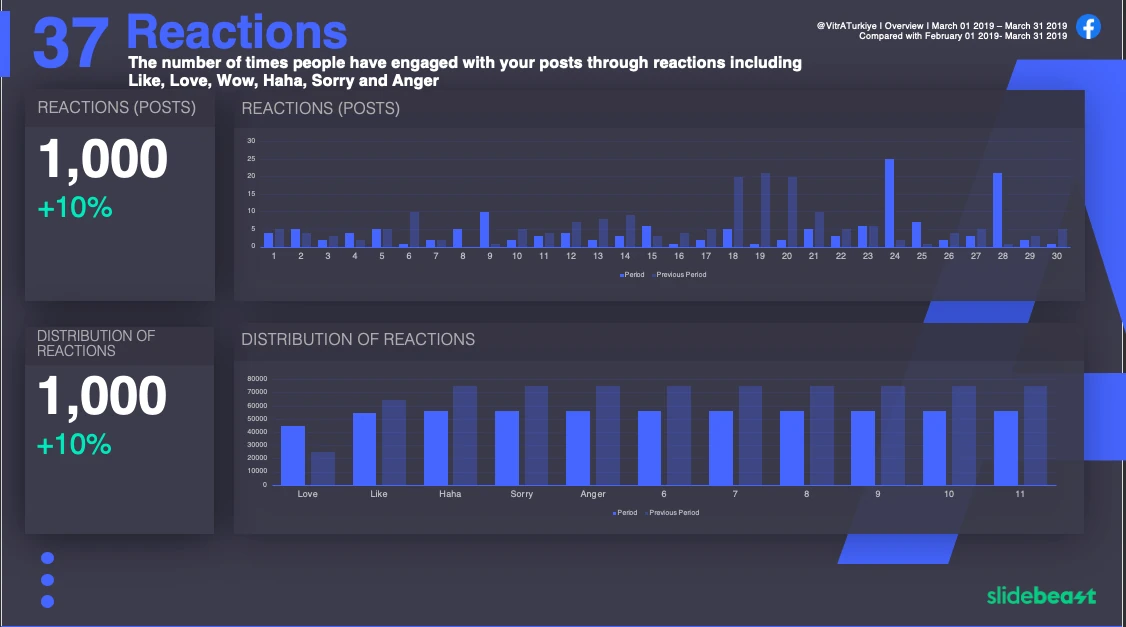
Engagement rate, engagement rate on reach, videos, saves all things related to post engagement is here in 4 slides.
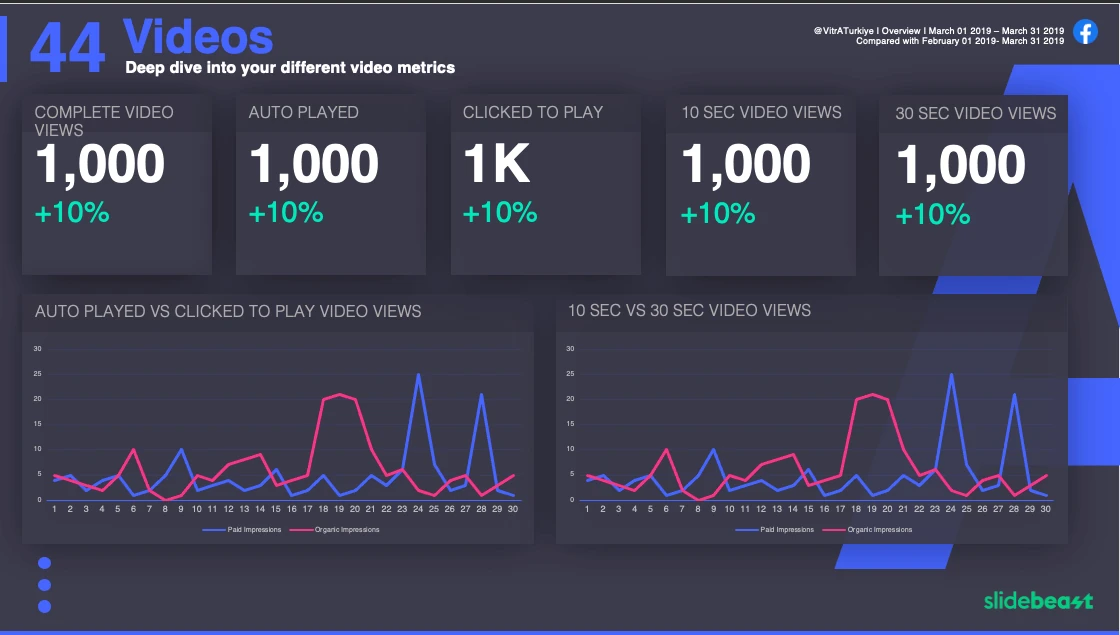
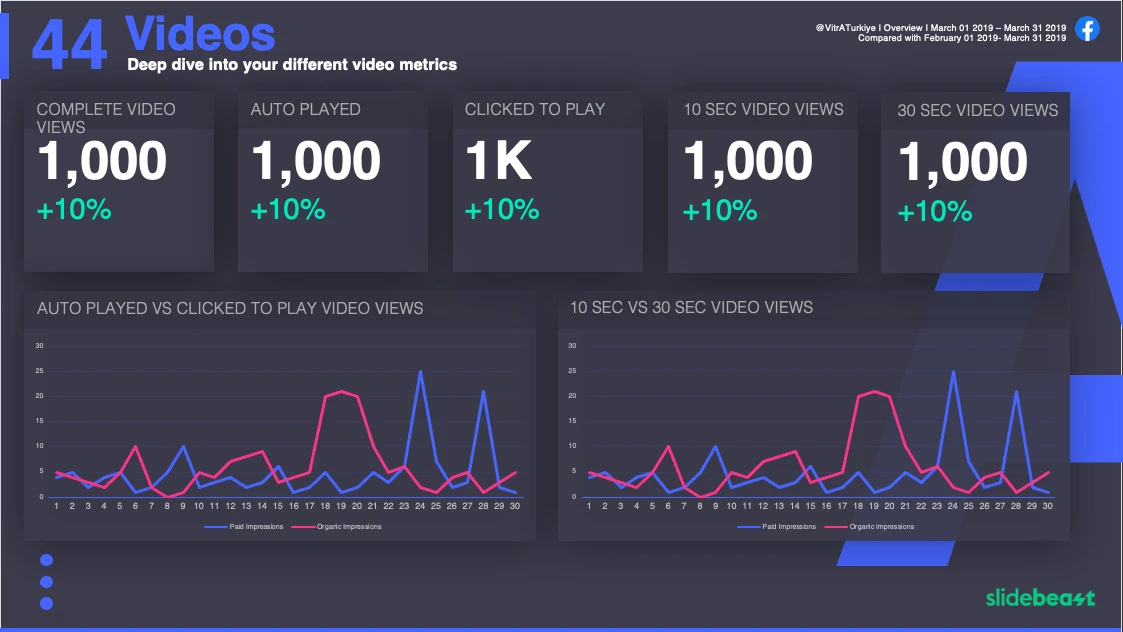
All things related to Videos.
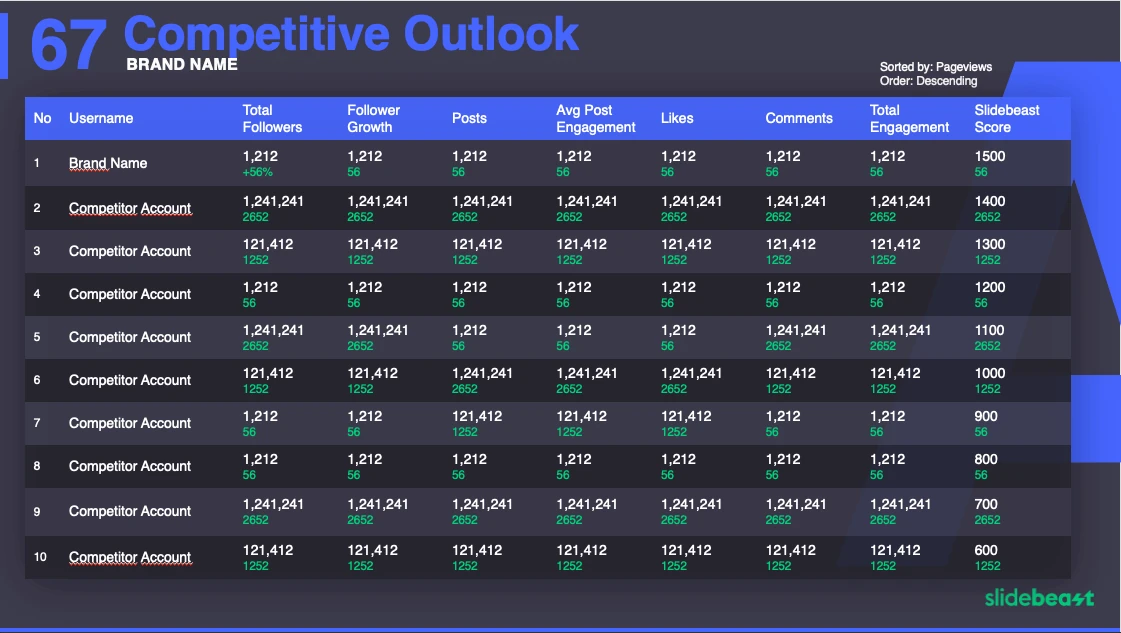
This section focuses on competitor performance.
These 8 slides focuses on anything related to posts, including top performing posts, time to post and more.
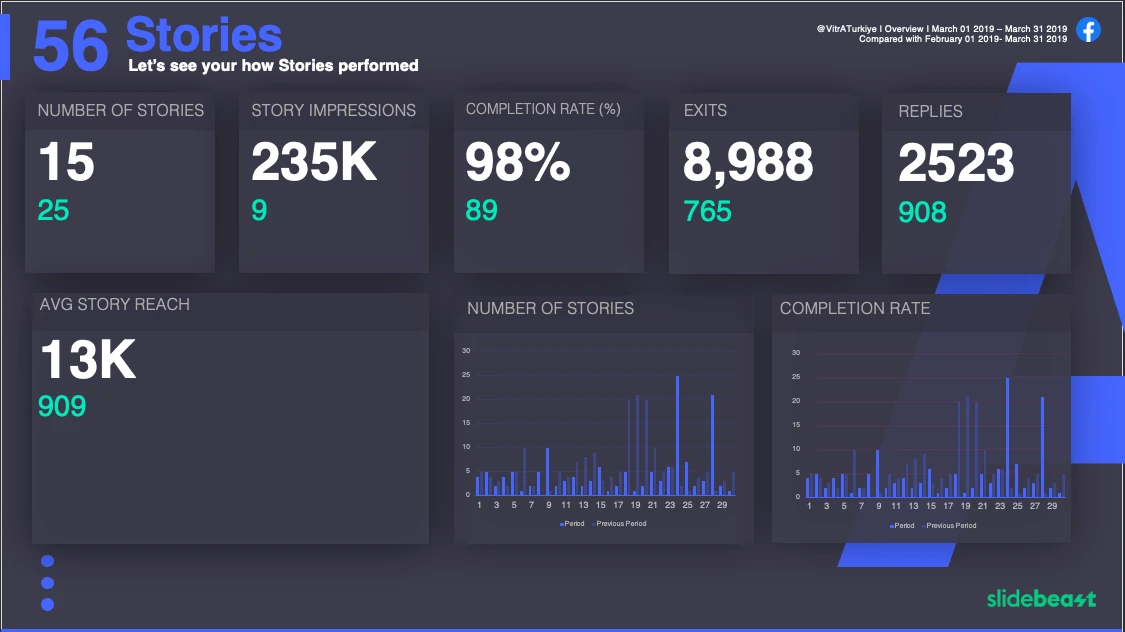
Currently unavailable, these slide will cover everything needed in order to understand how Stories performed.
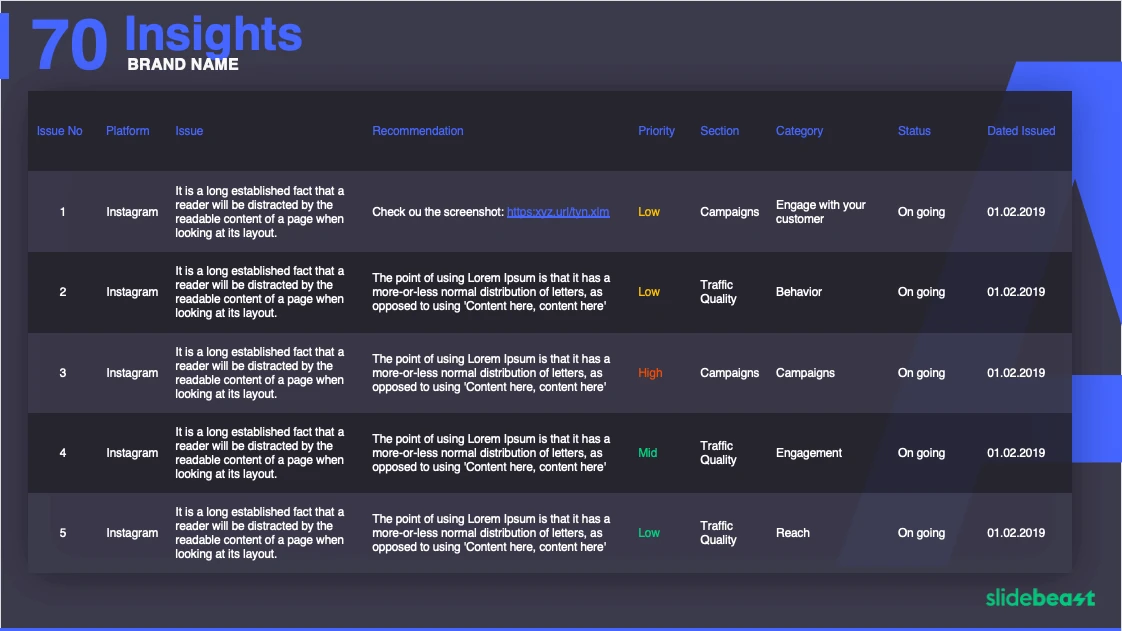
Insights about a particular report can be found in these slides. Only available on Enterprise package.
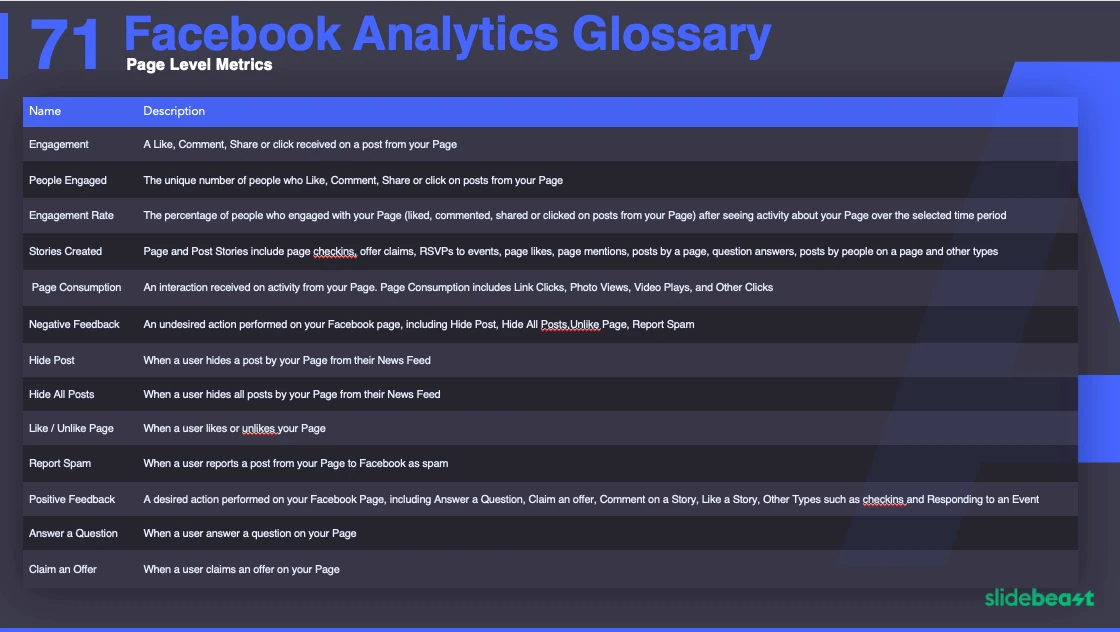
Glossary section of the report is a source for all wordings related to Facebook Analytics.
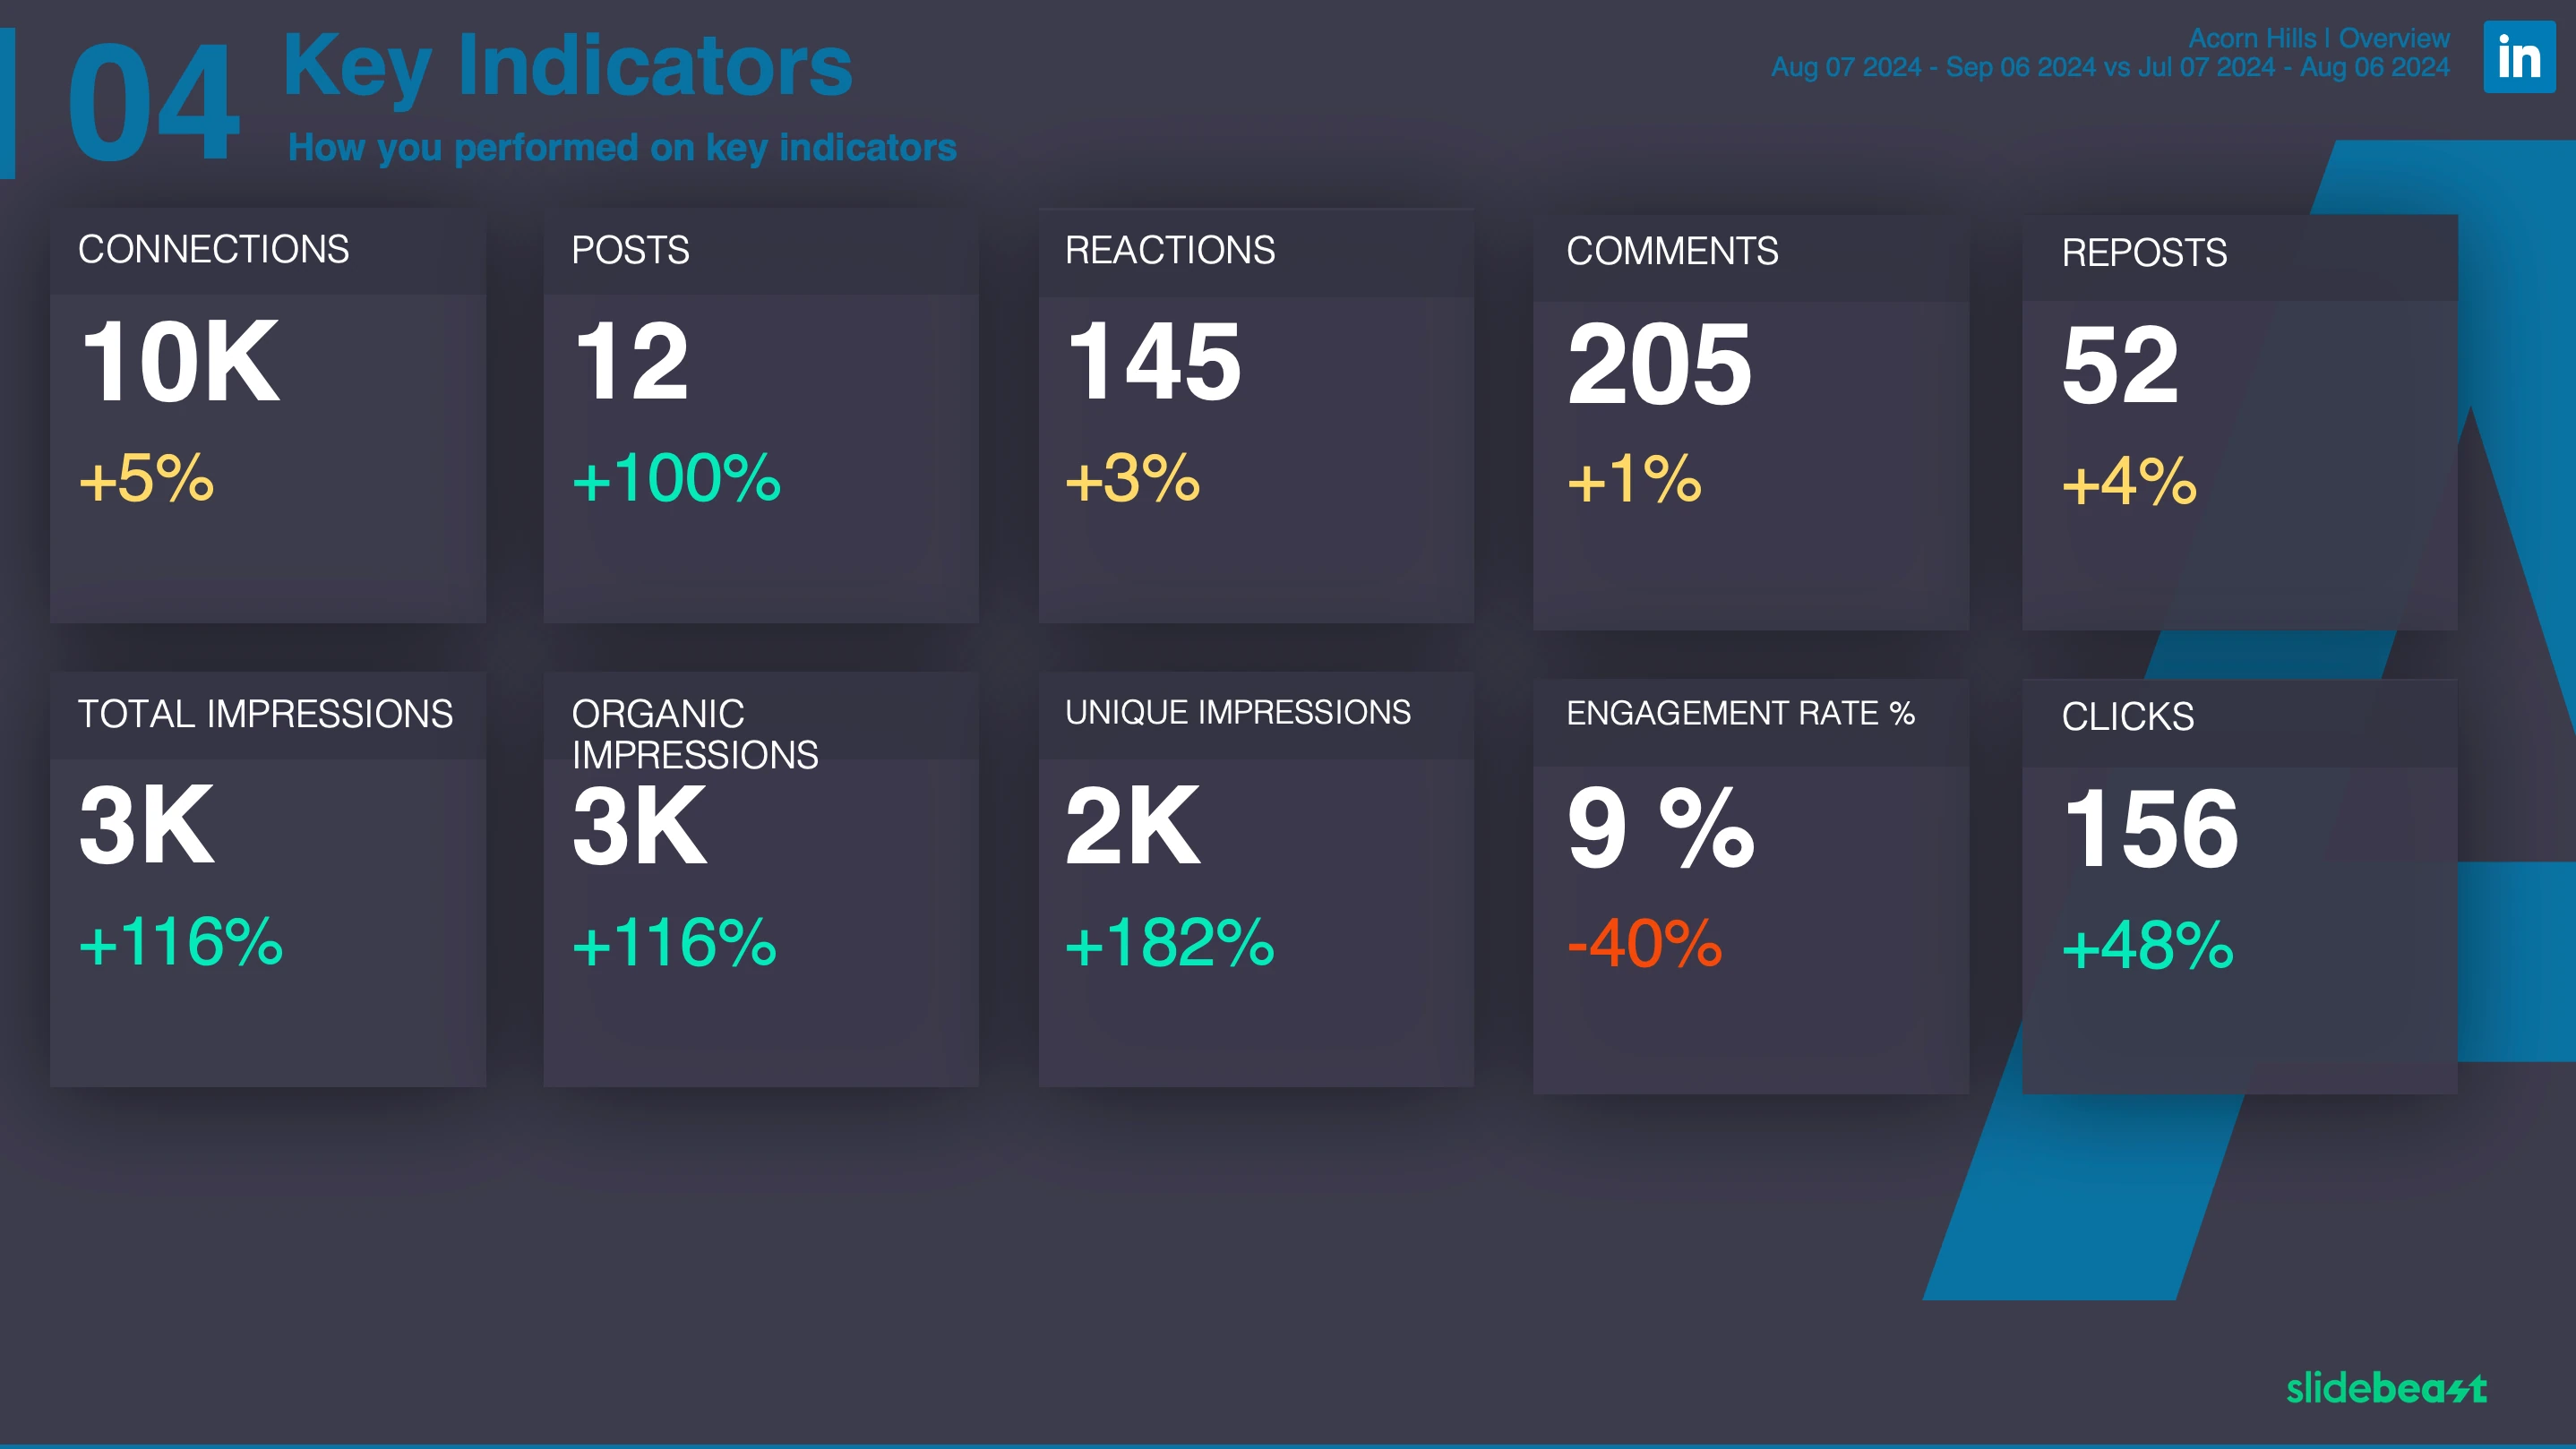
The first section of the LinkedIn report consists the main slide, Key Indicators. As the name suggests, it provides an overview of your LinkedIn activity, including key metrics such as total connections, impressions, posts and engagement trends over time.
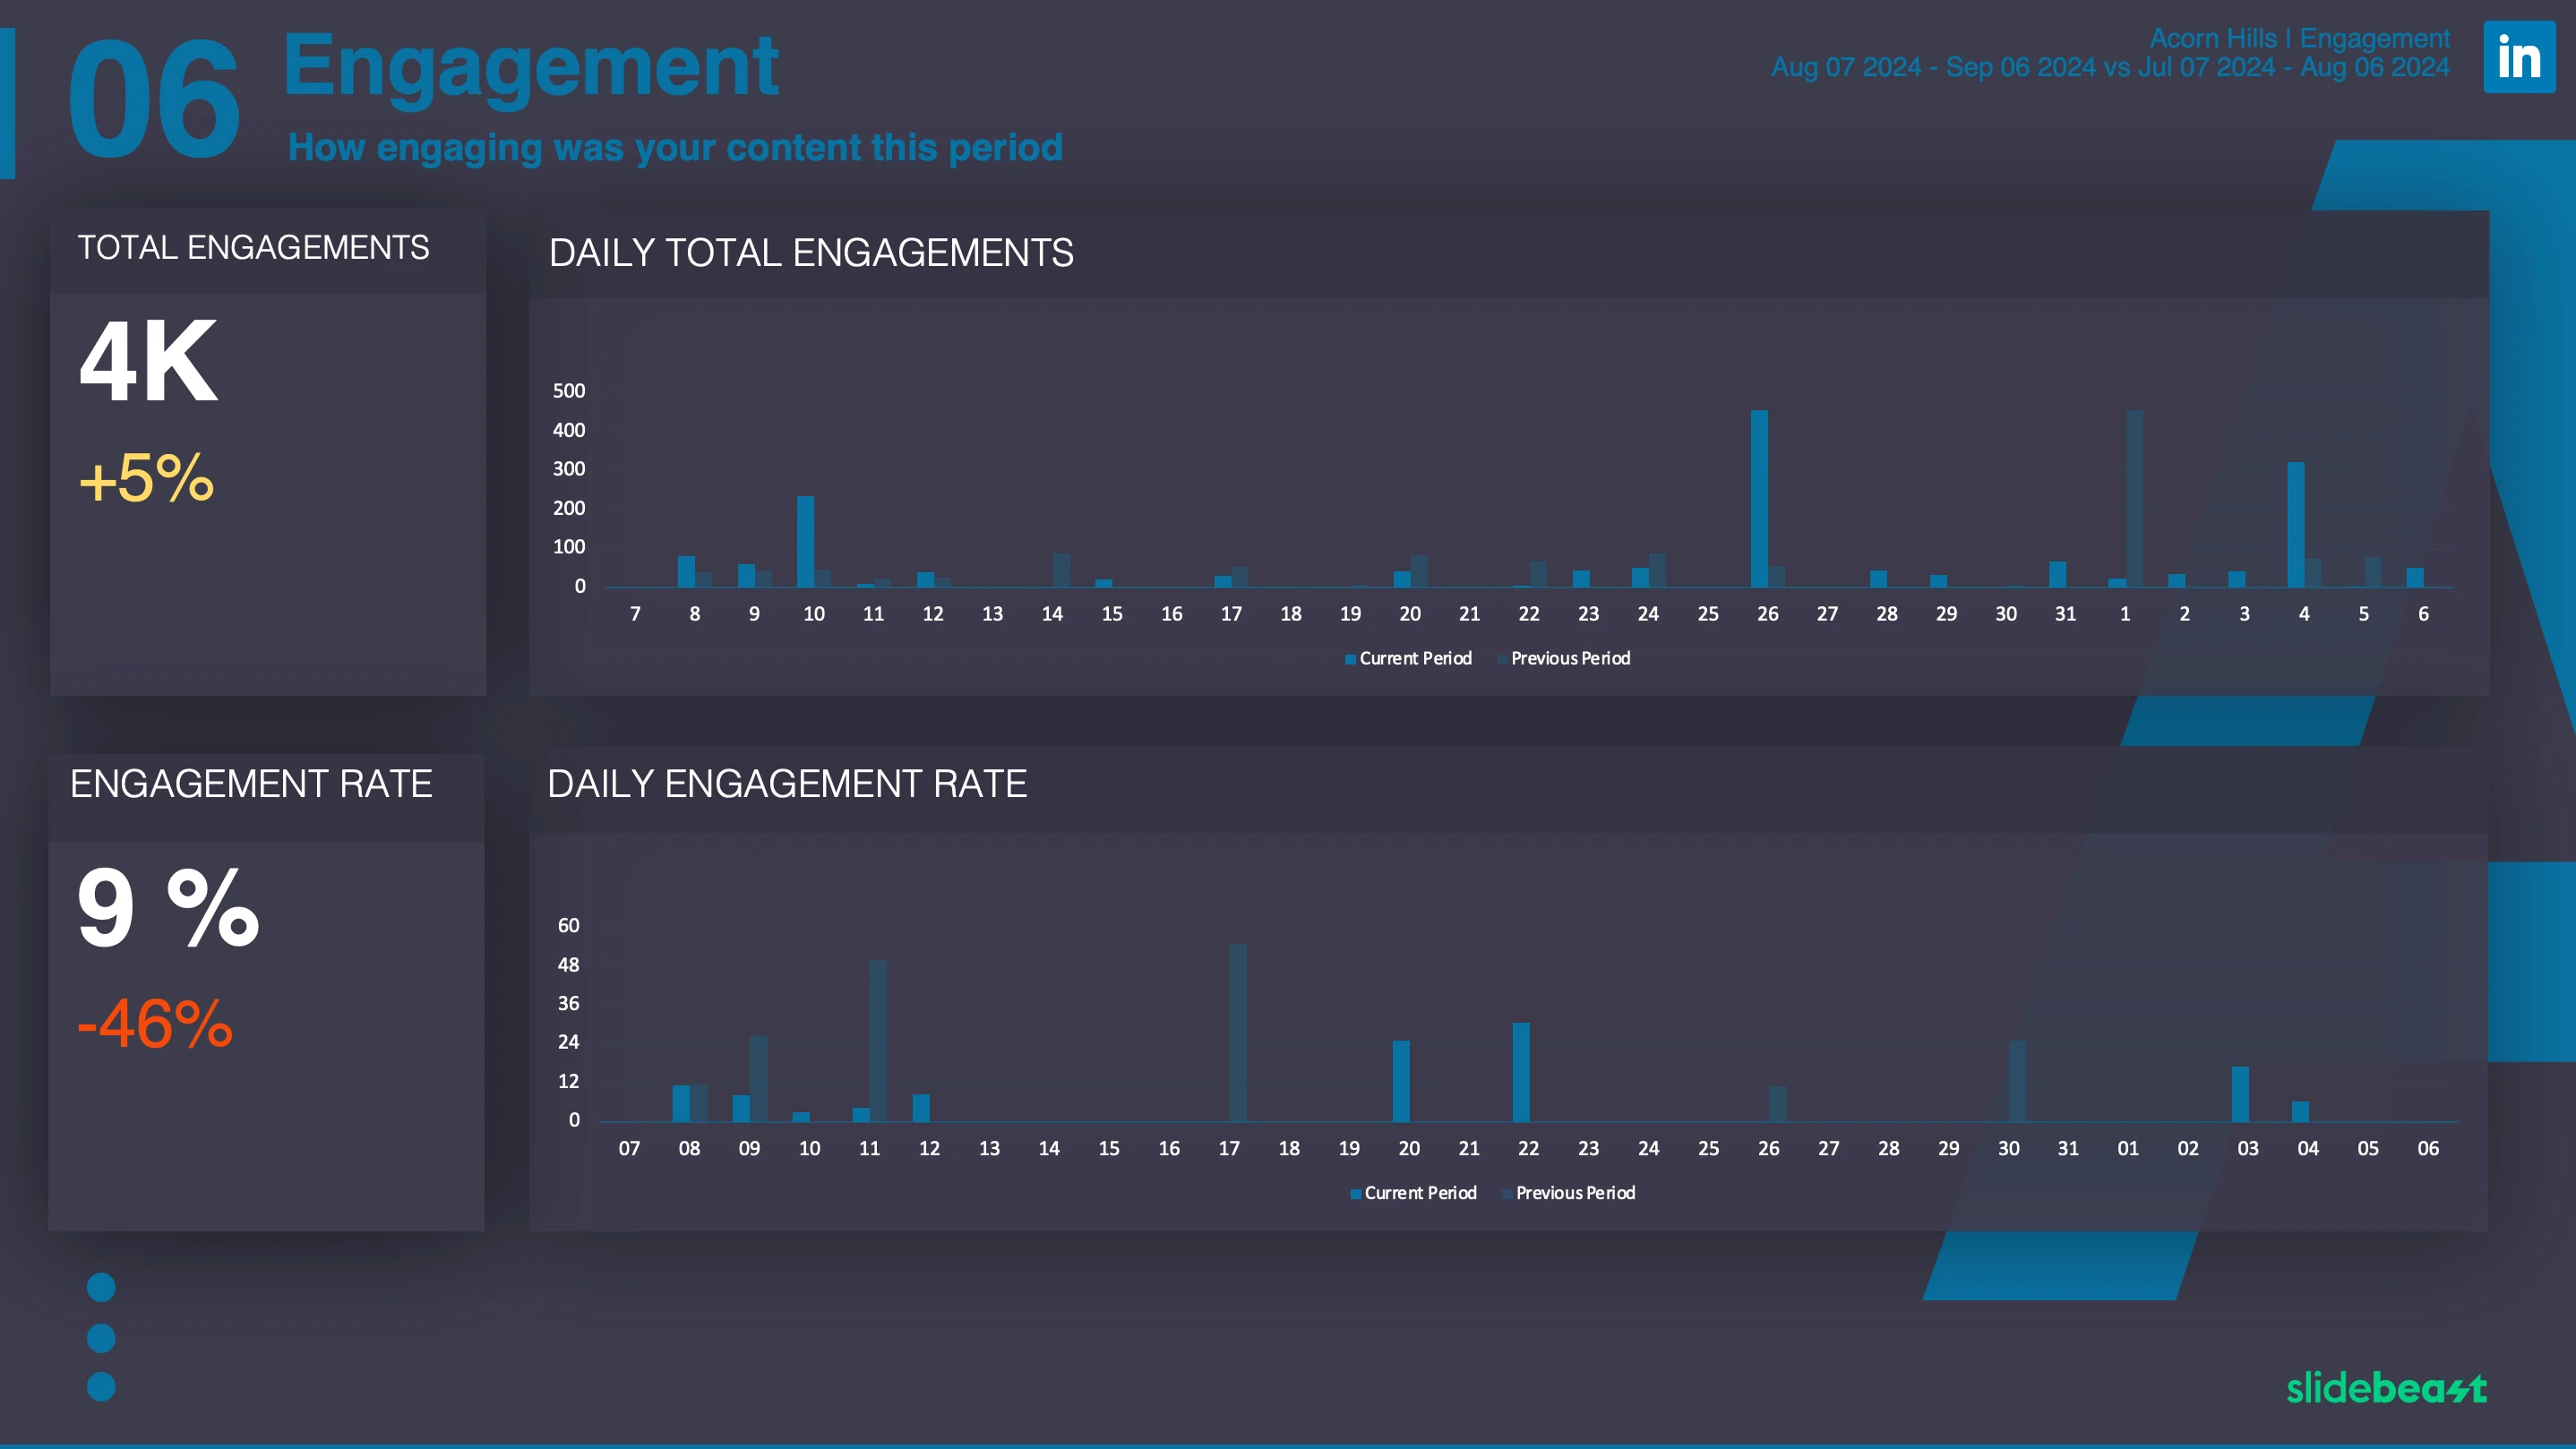
This section focuses on how users interacted with your posts. Across the slides, it covers key metrics such as likes, reposts, comments, reactions, allowing you to gauge the overall impact and resonance of your content.
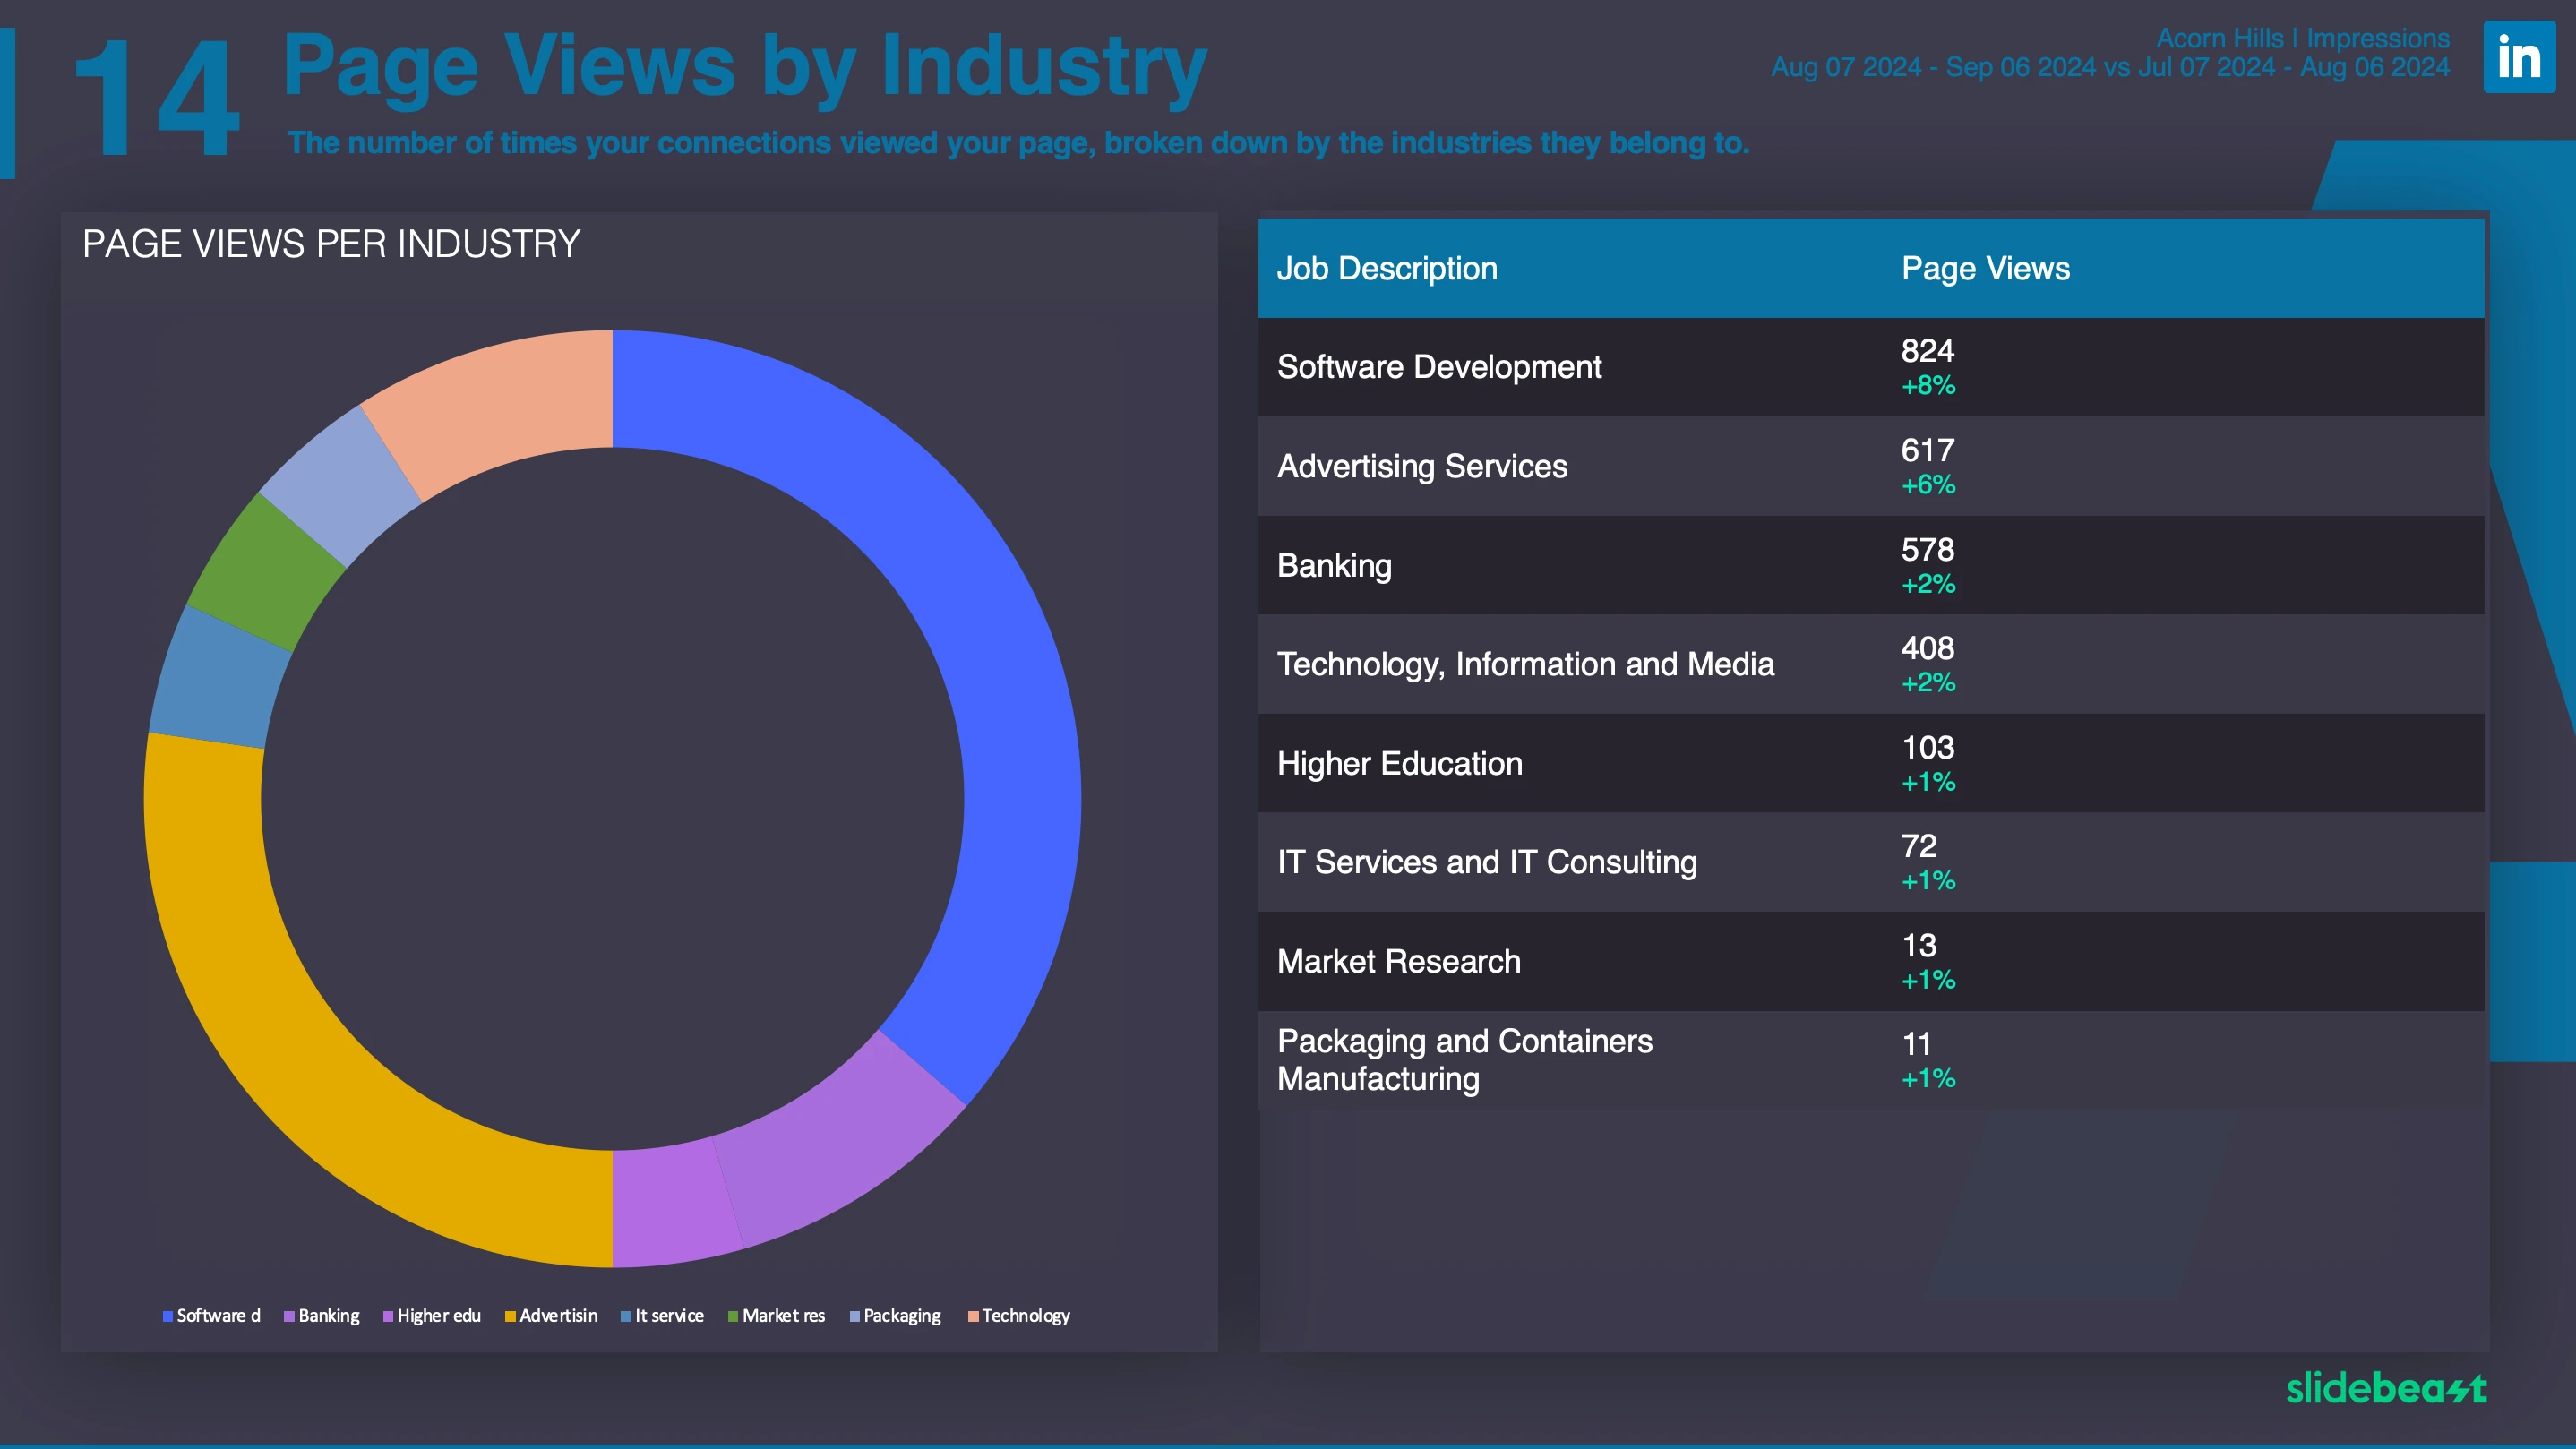
This section covers Impressions and Page Views across 7 slides, breaking down data by Page Tabs, Device, Country, Industry, Seniority, and Staff Count, providing a detailed view of how your content is seen.
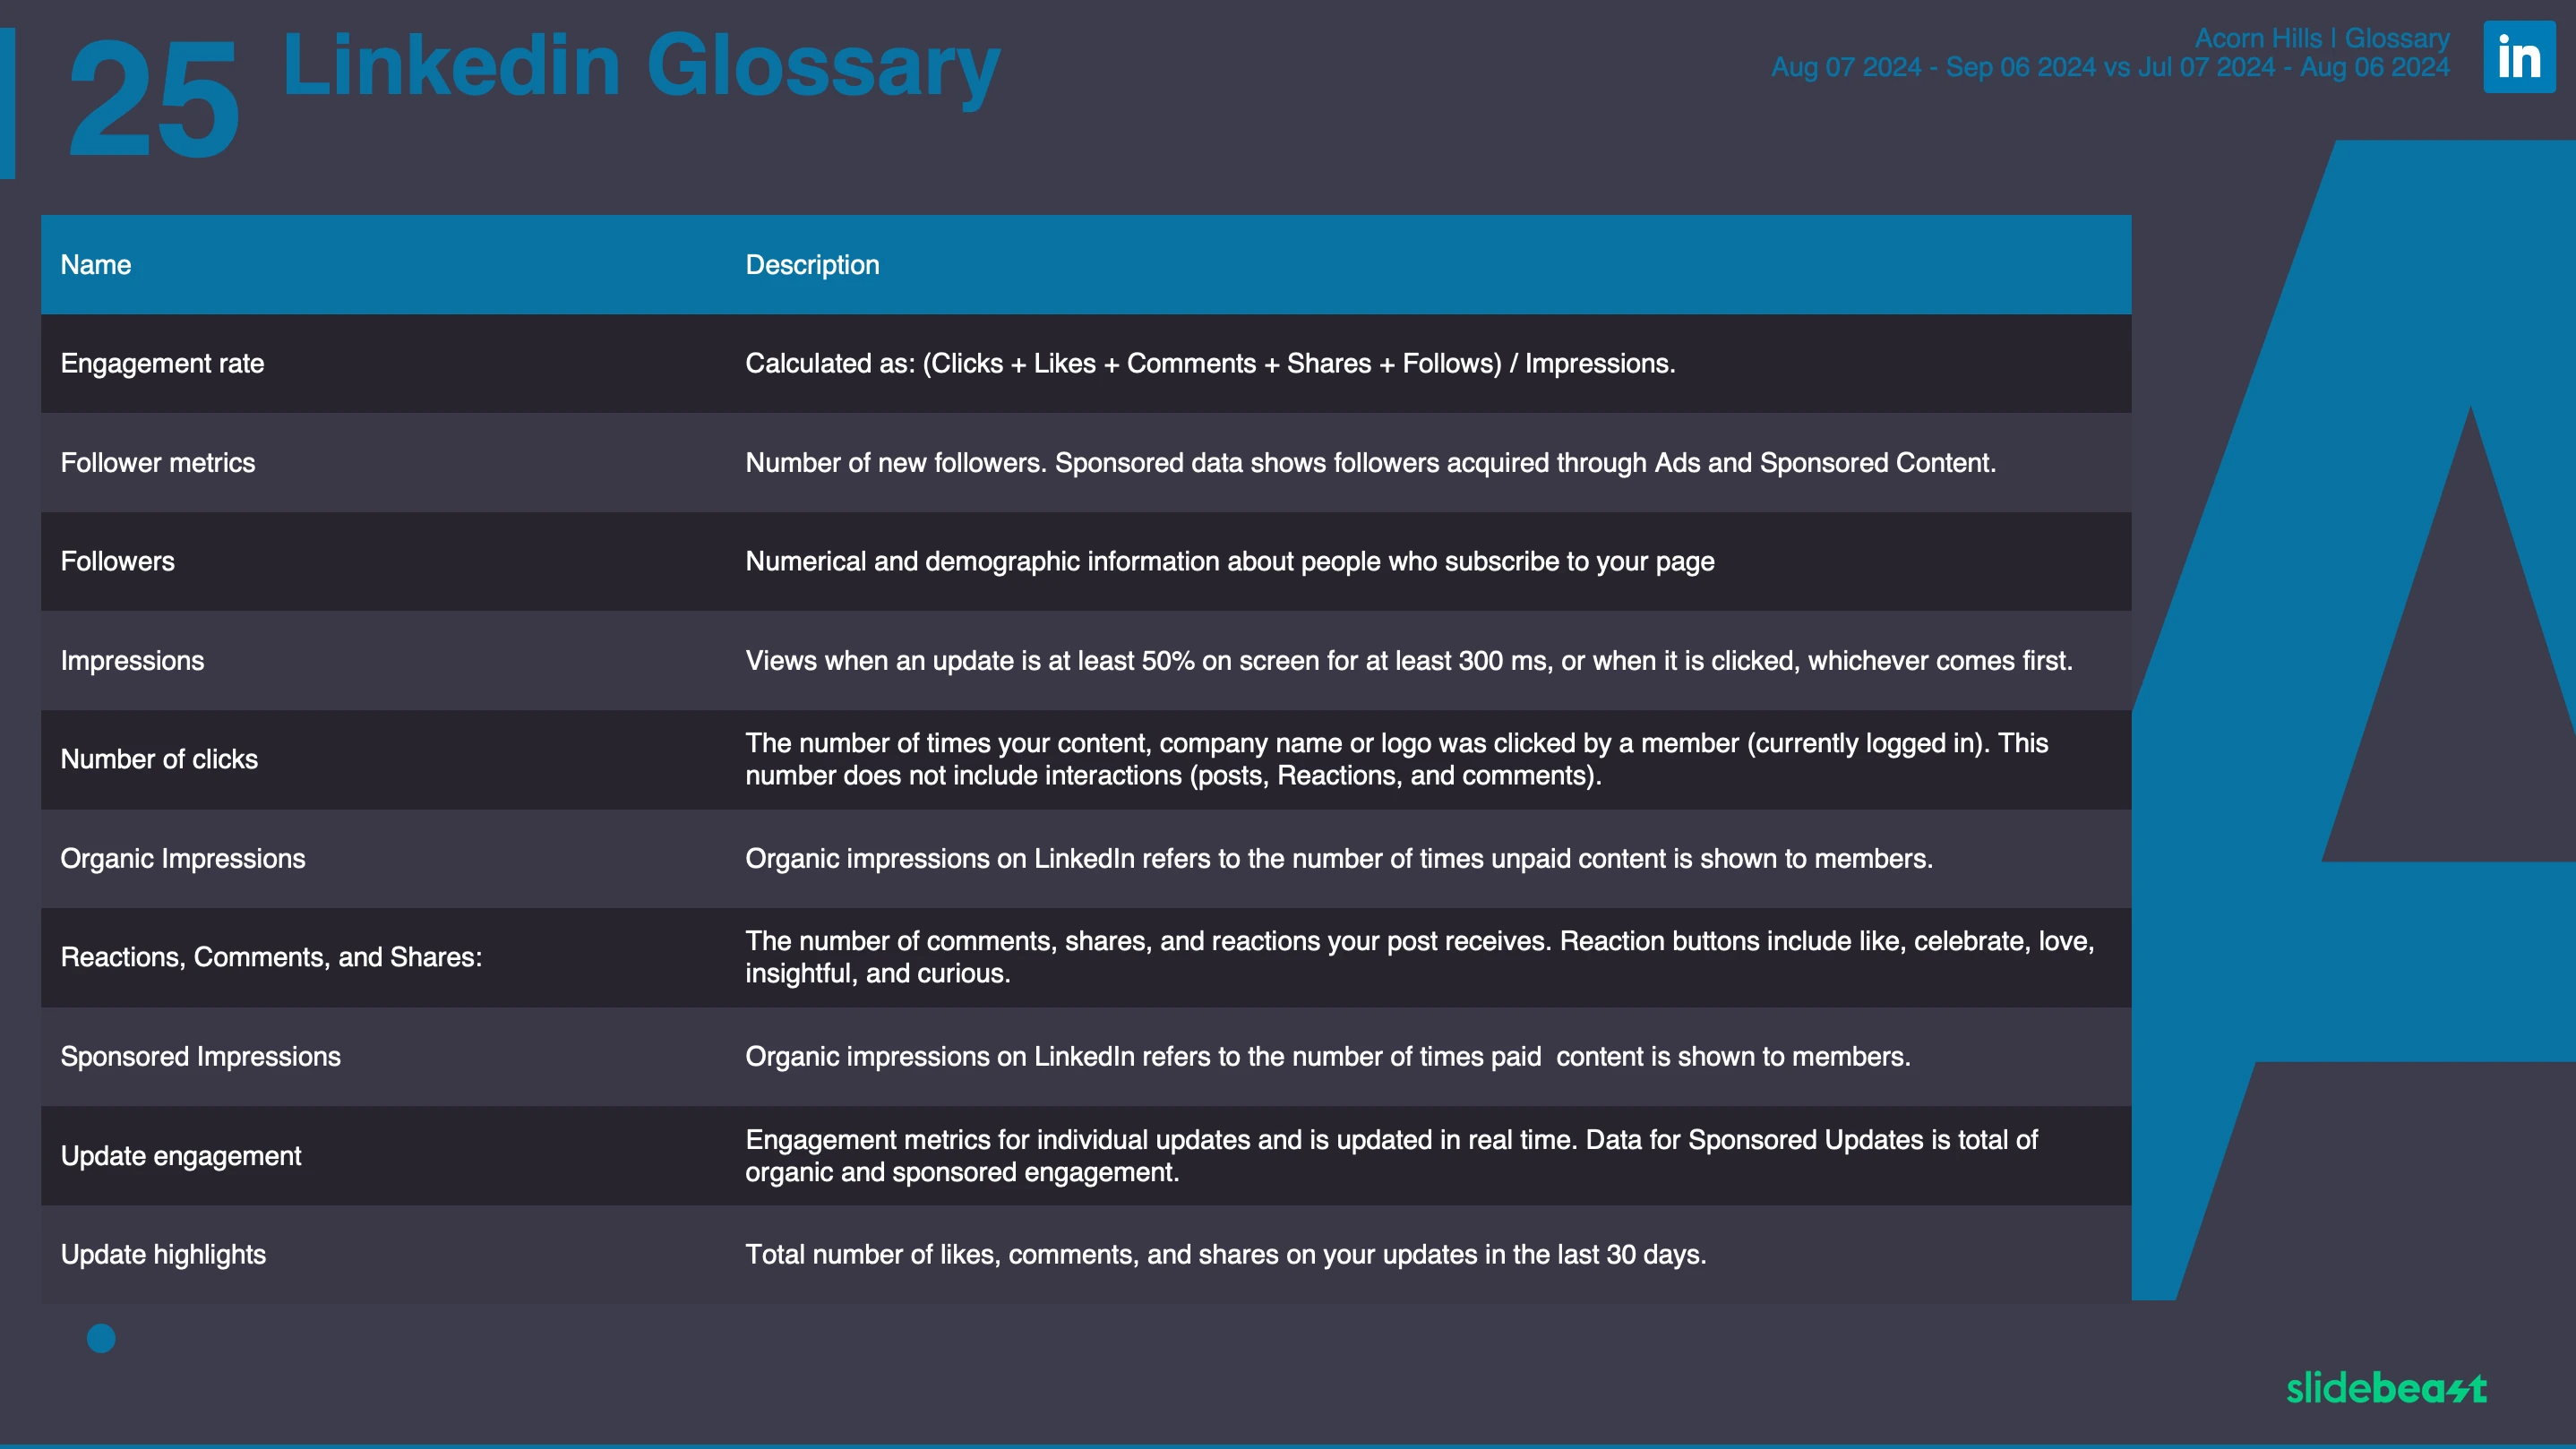
A comprehensive section defining key LinkedIn metrics and terms. This helps you better understand the report and ensures you have full clarity on what each metric represents.
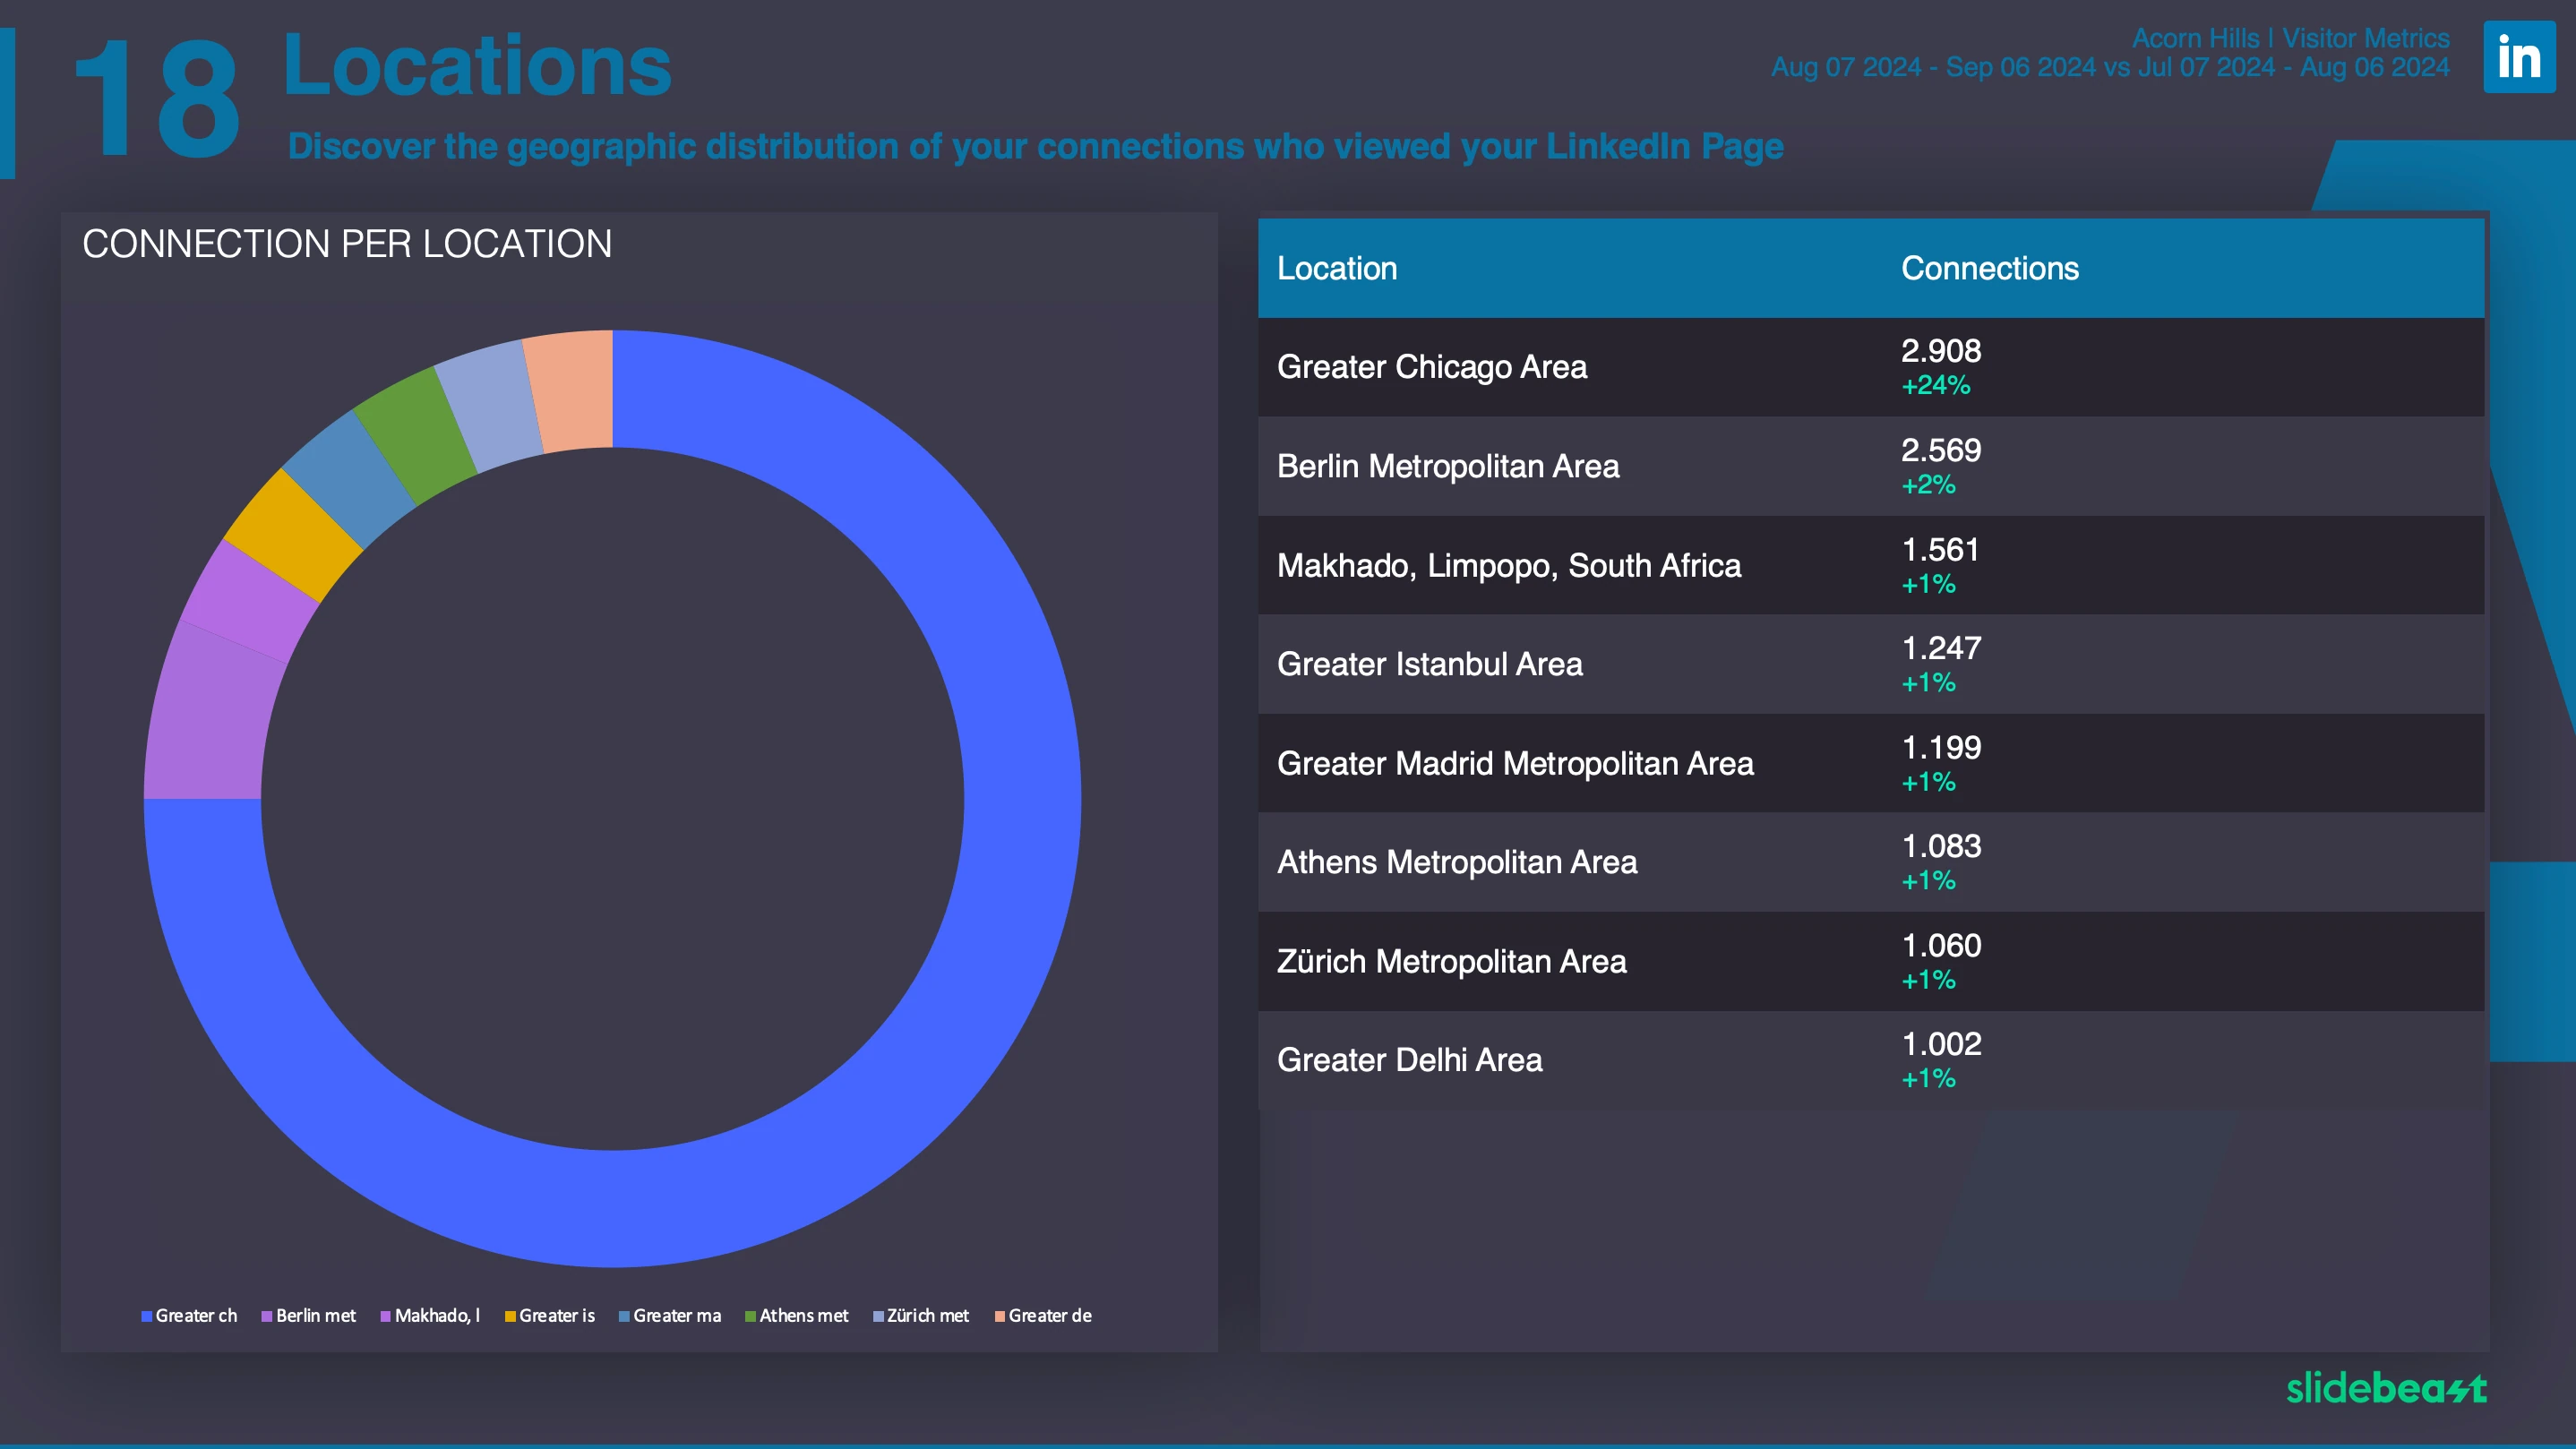
In this section, spread over 5 slides, you’ll find detailed data on the people who visited your LinkedIn profile or company page. It breaks down the metrics by demographics such as industry, job titles, and company size, giving you deeper insights into your audience.
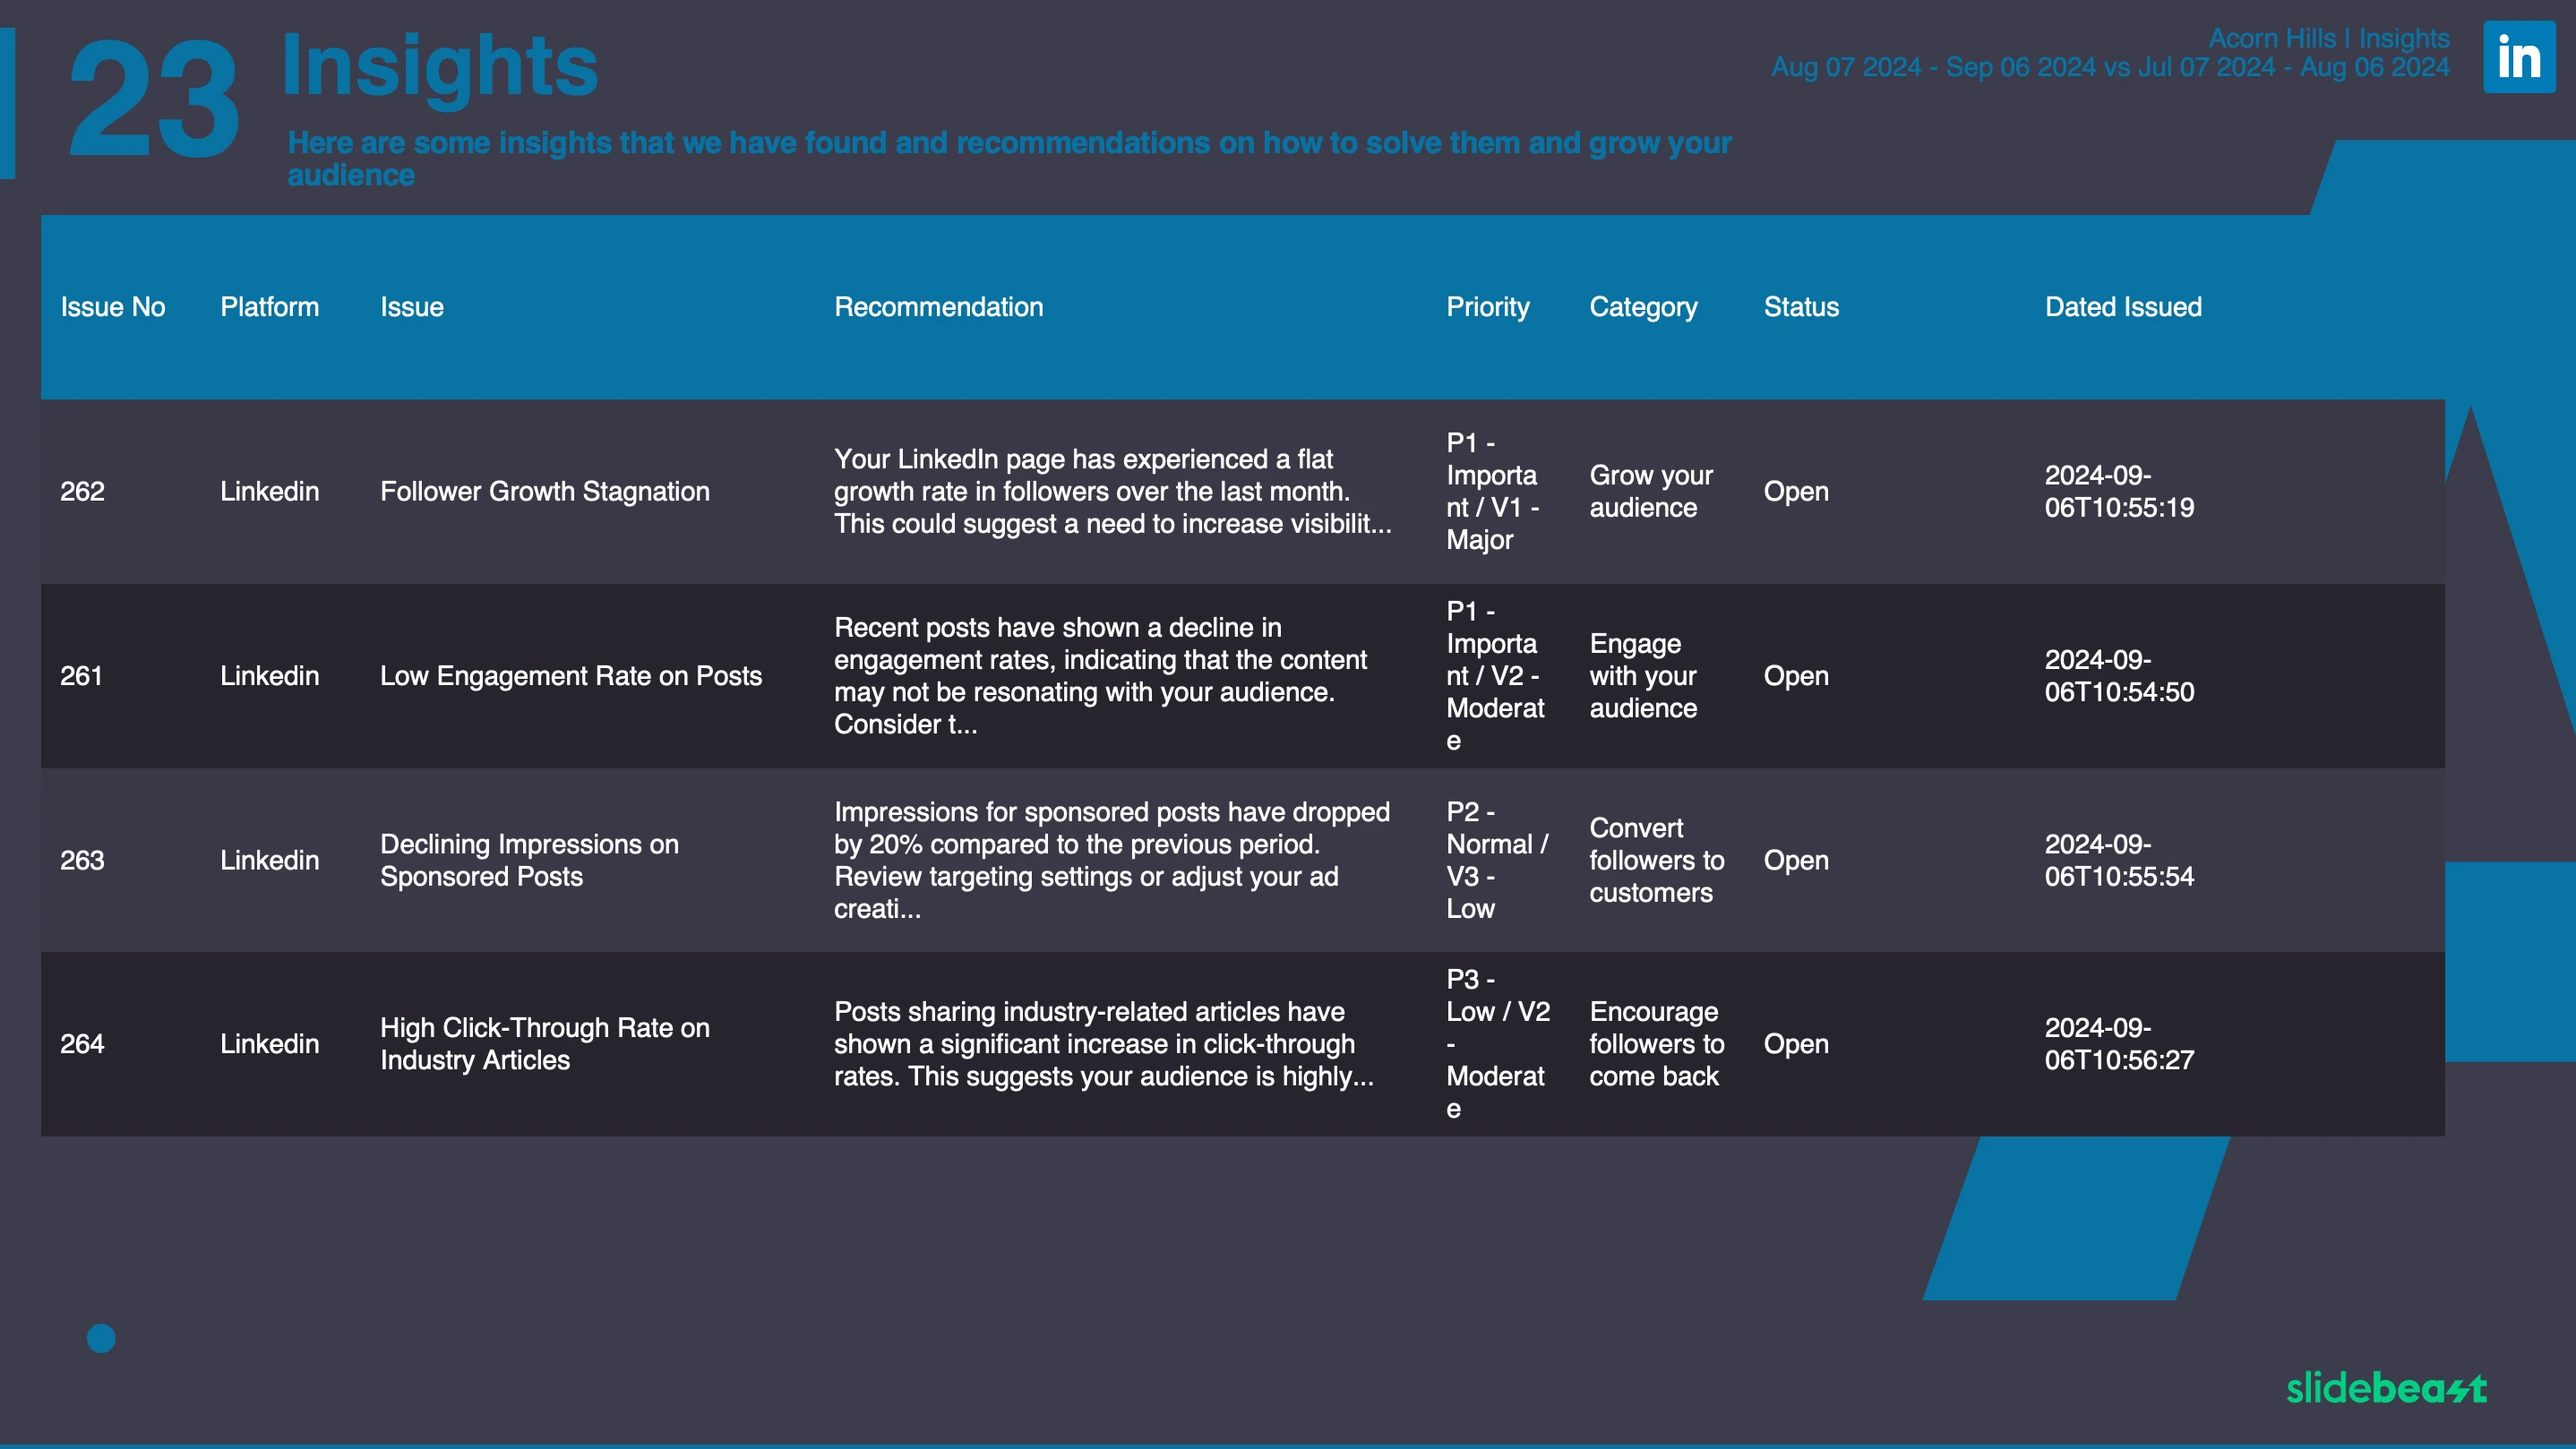
Insights about the particular LinkedIn account can be found in these slides. Only available on Enterprise package.
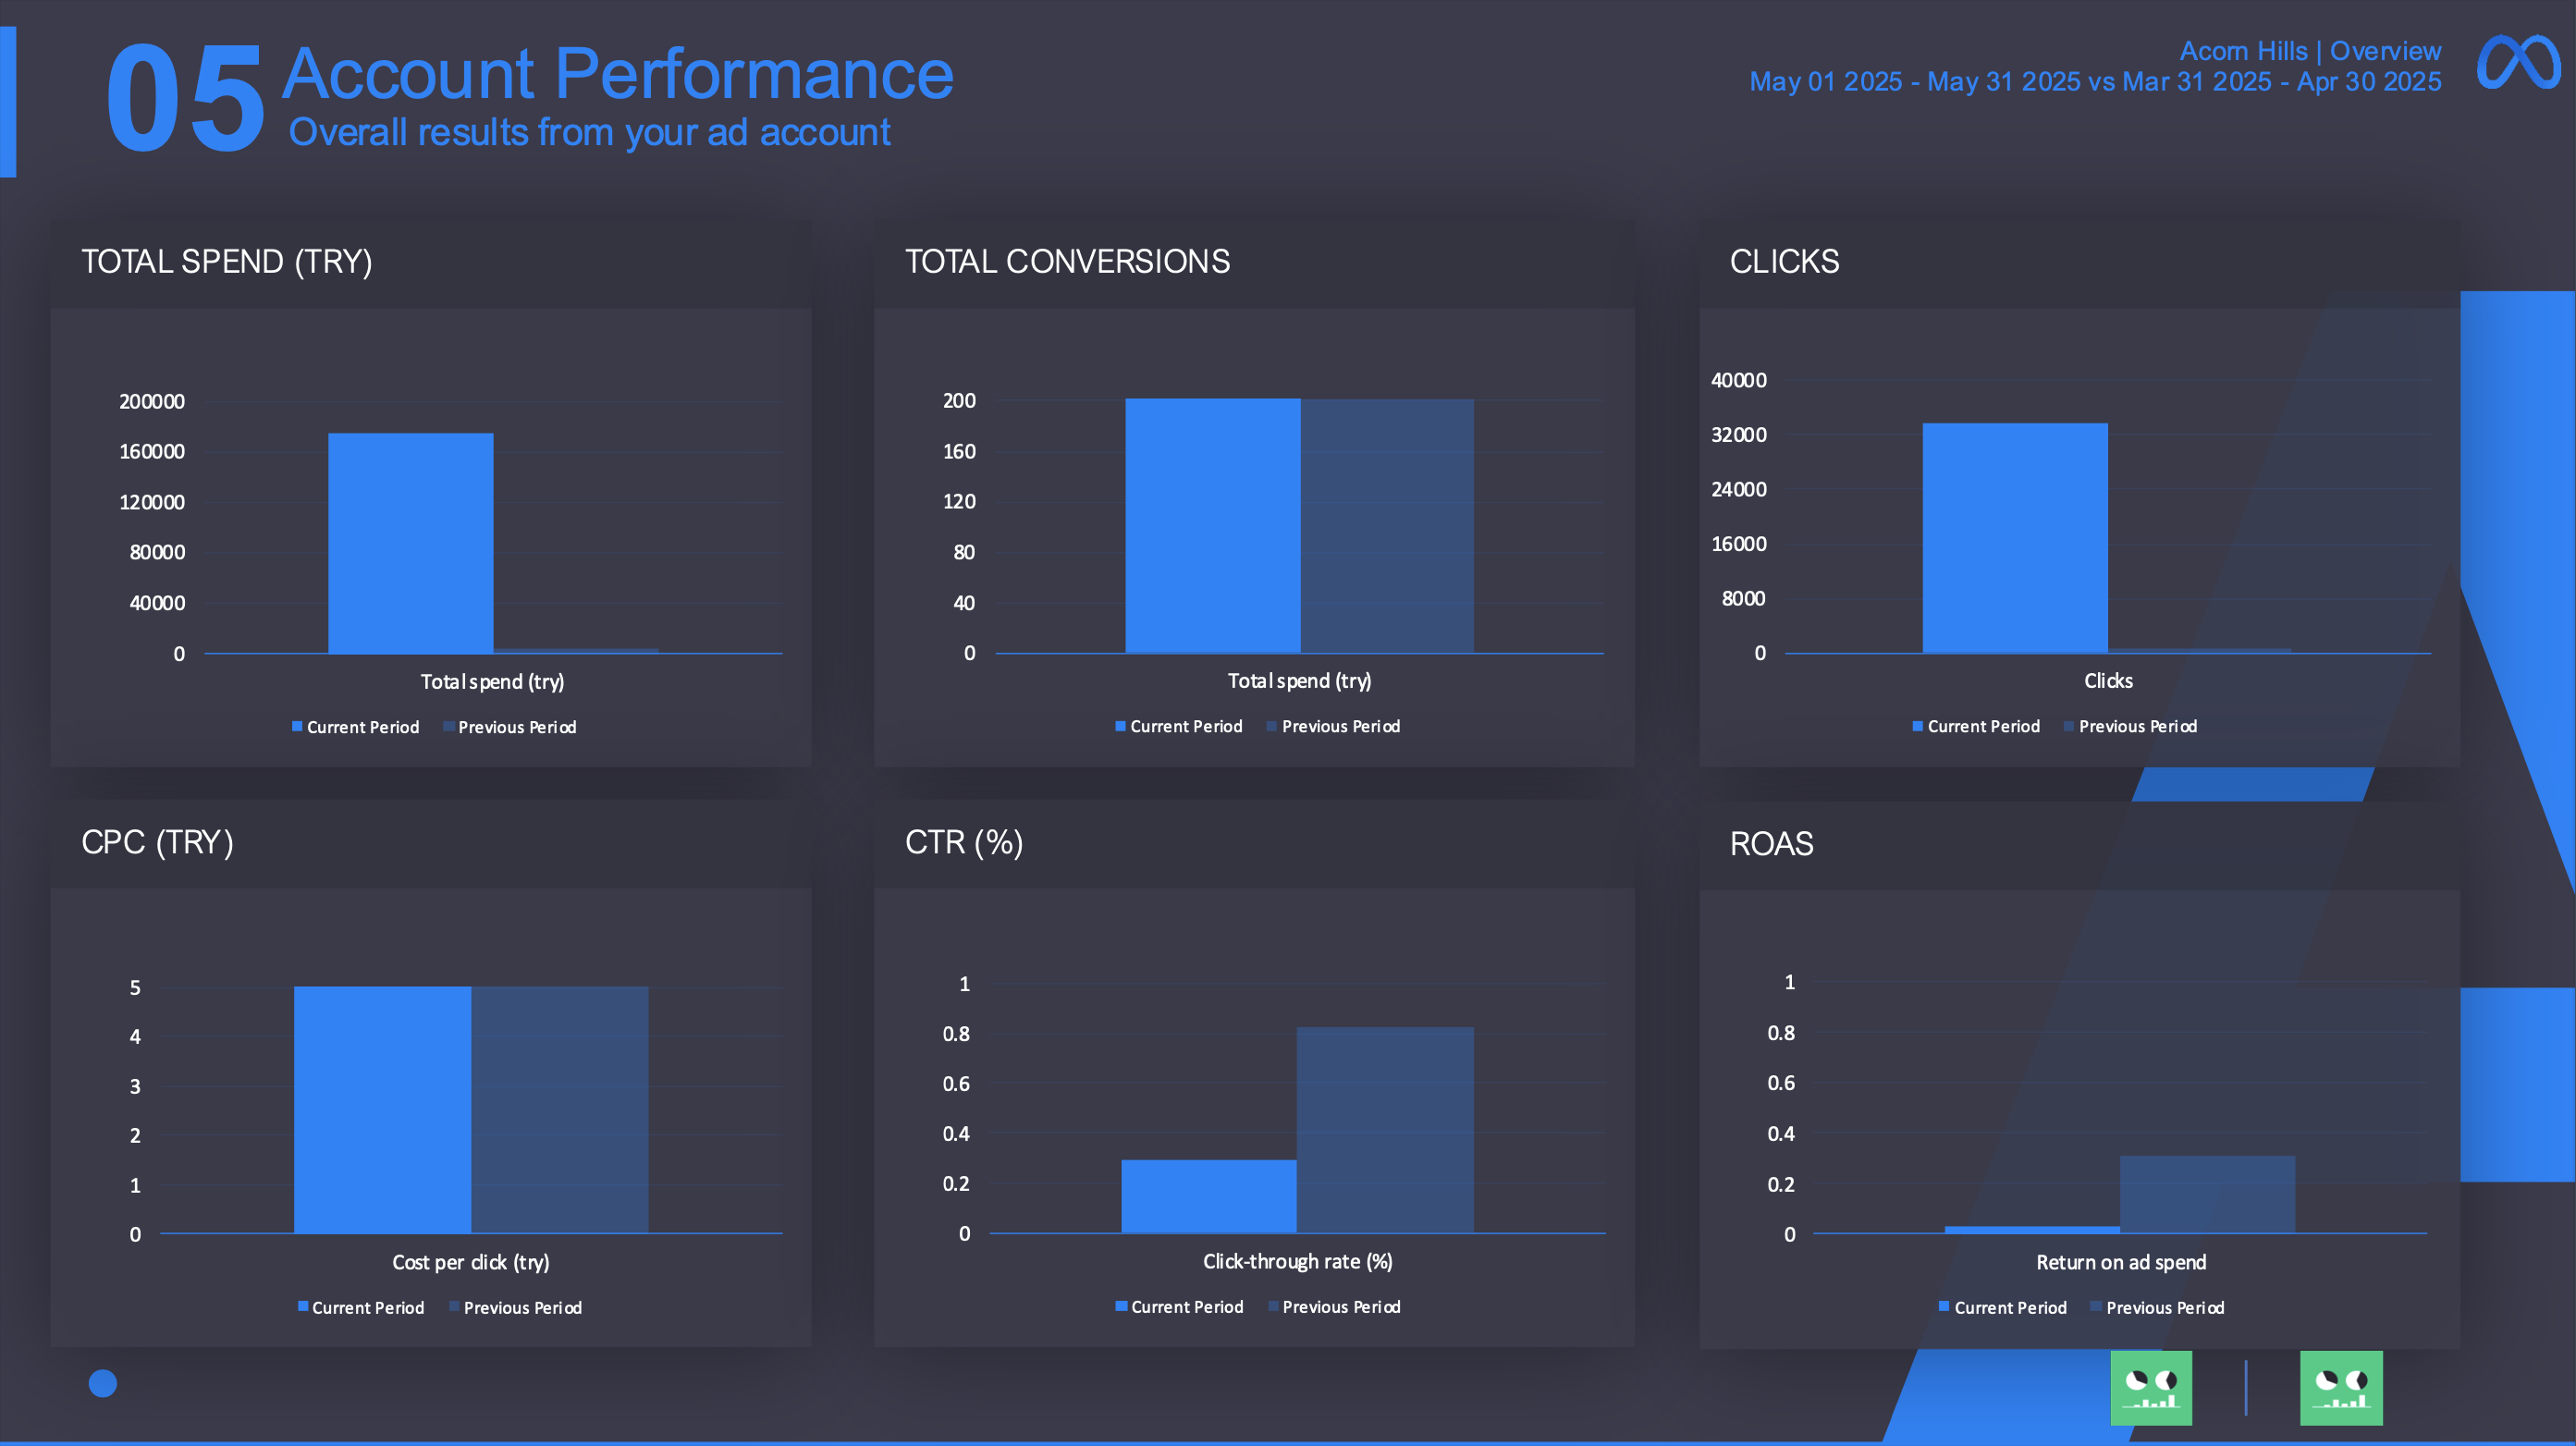
Gives a full picture of how your Meta ad account performed. Includes key metrics like impressions, reach, spend, clicks, engagement rate, and ROAS. A fast and visual way to assess the health and progress of your advertising efforts.
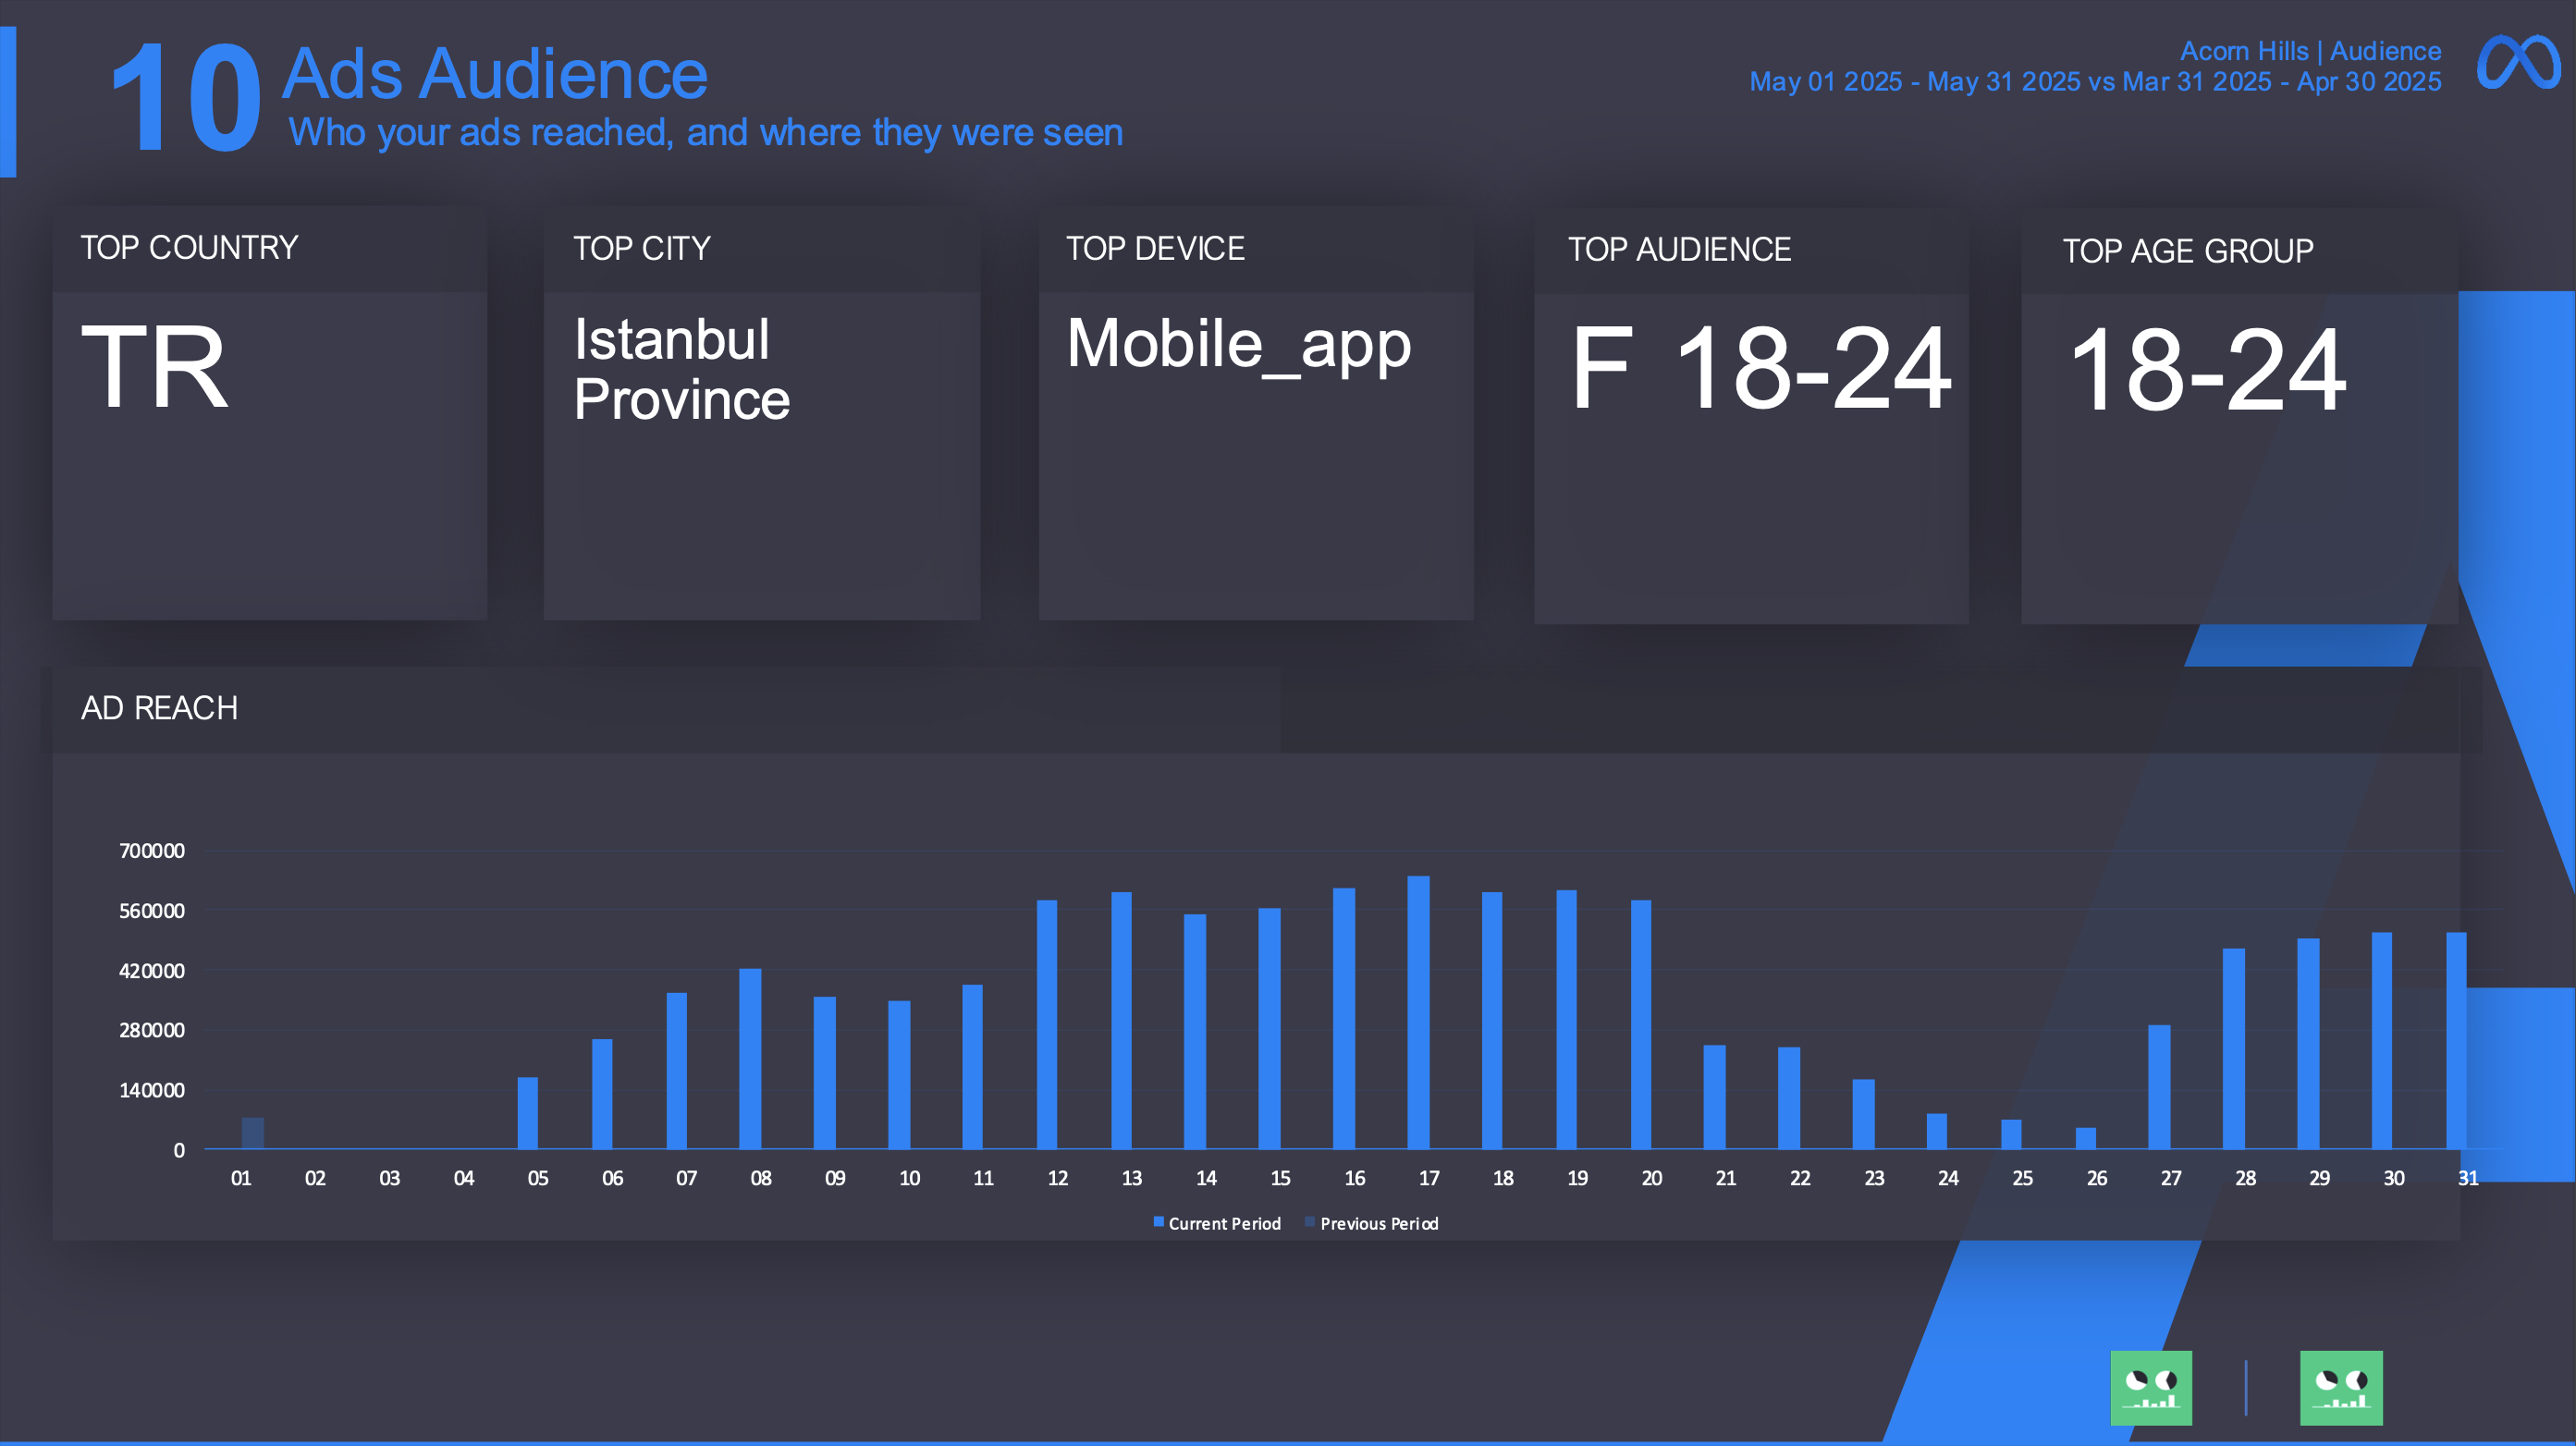
Shows who your ads reached. Breaks down countries, cities, age groups, gender, and devices to help you understand your ad delivery across segments.
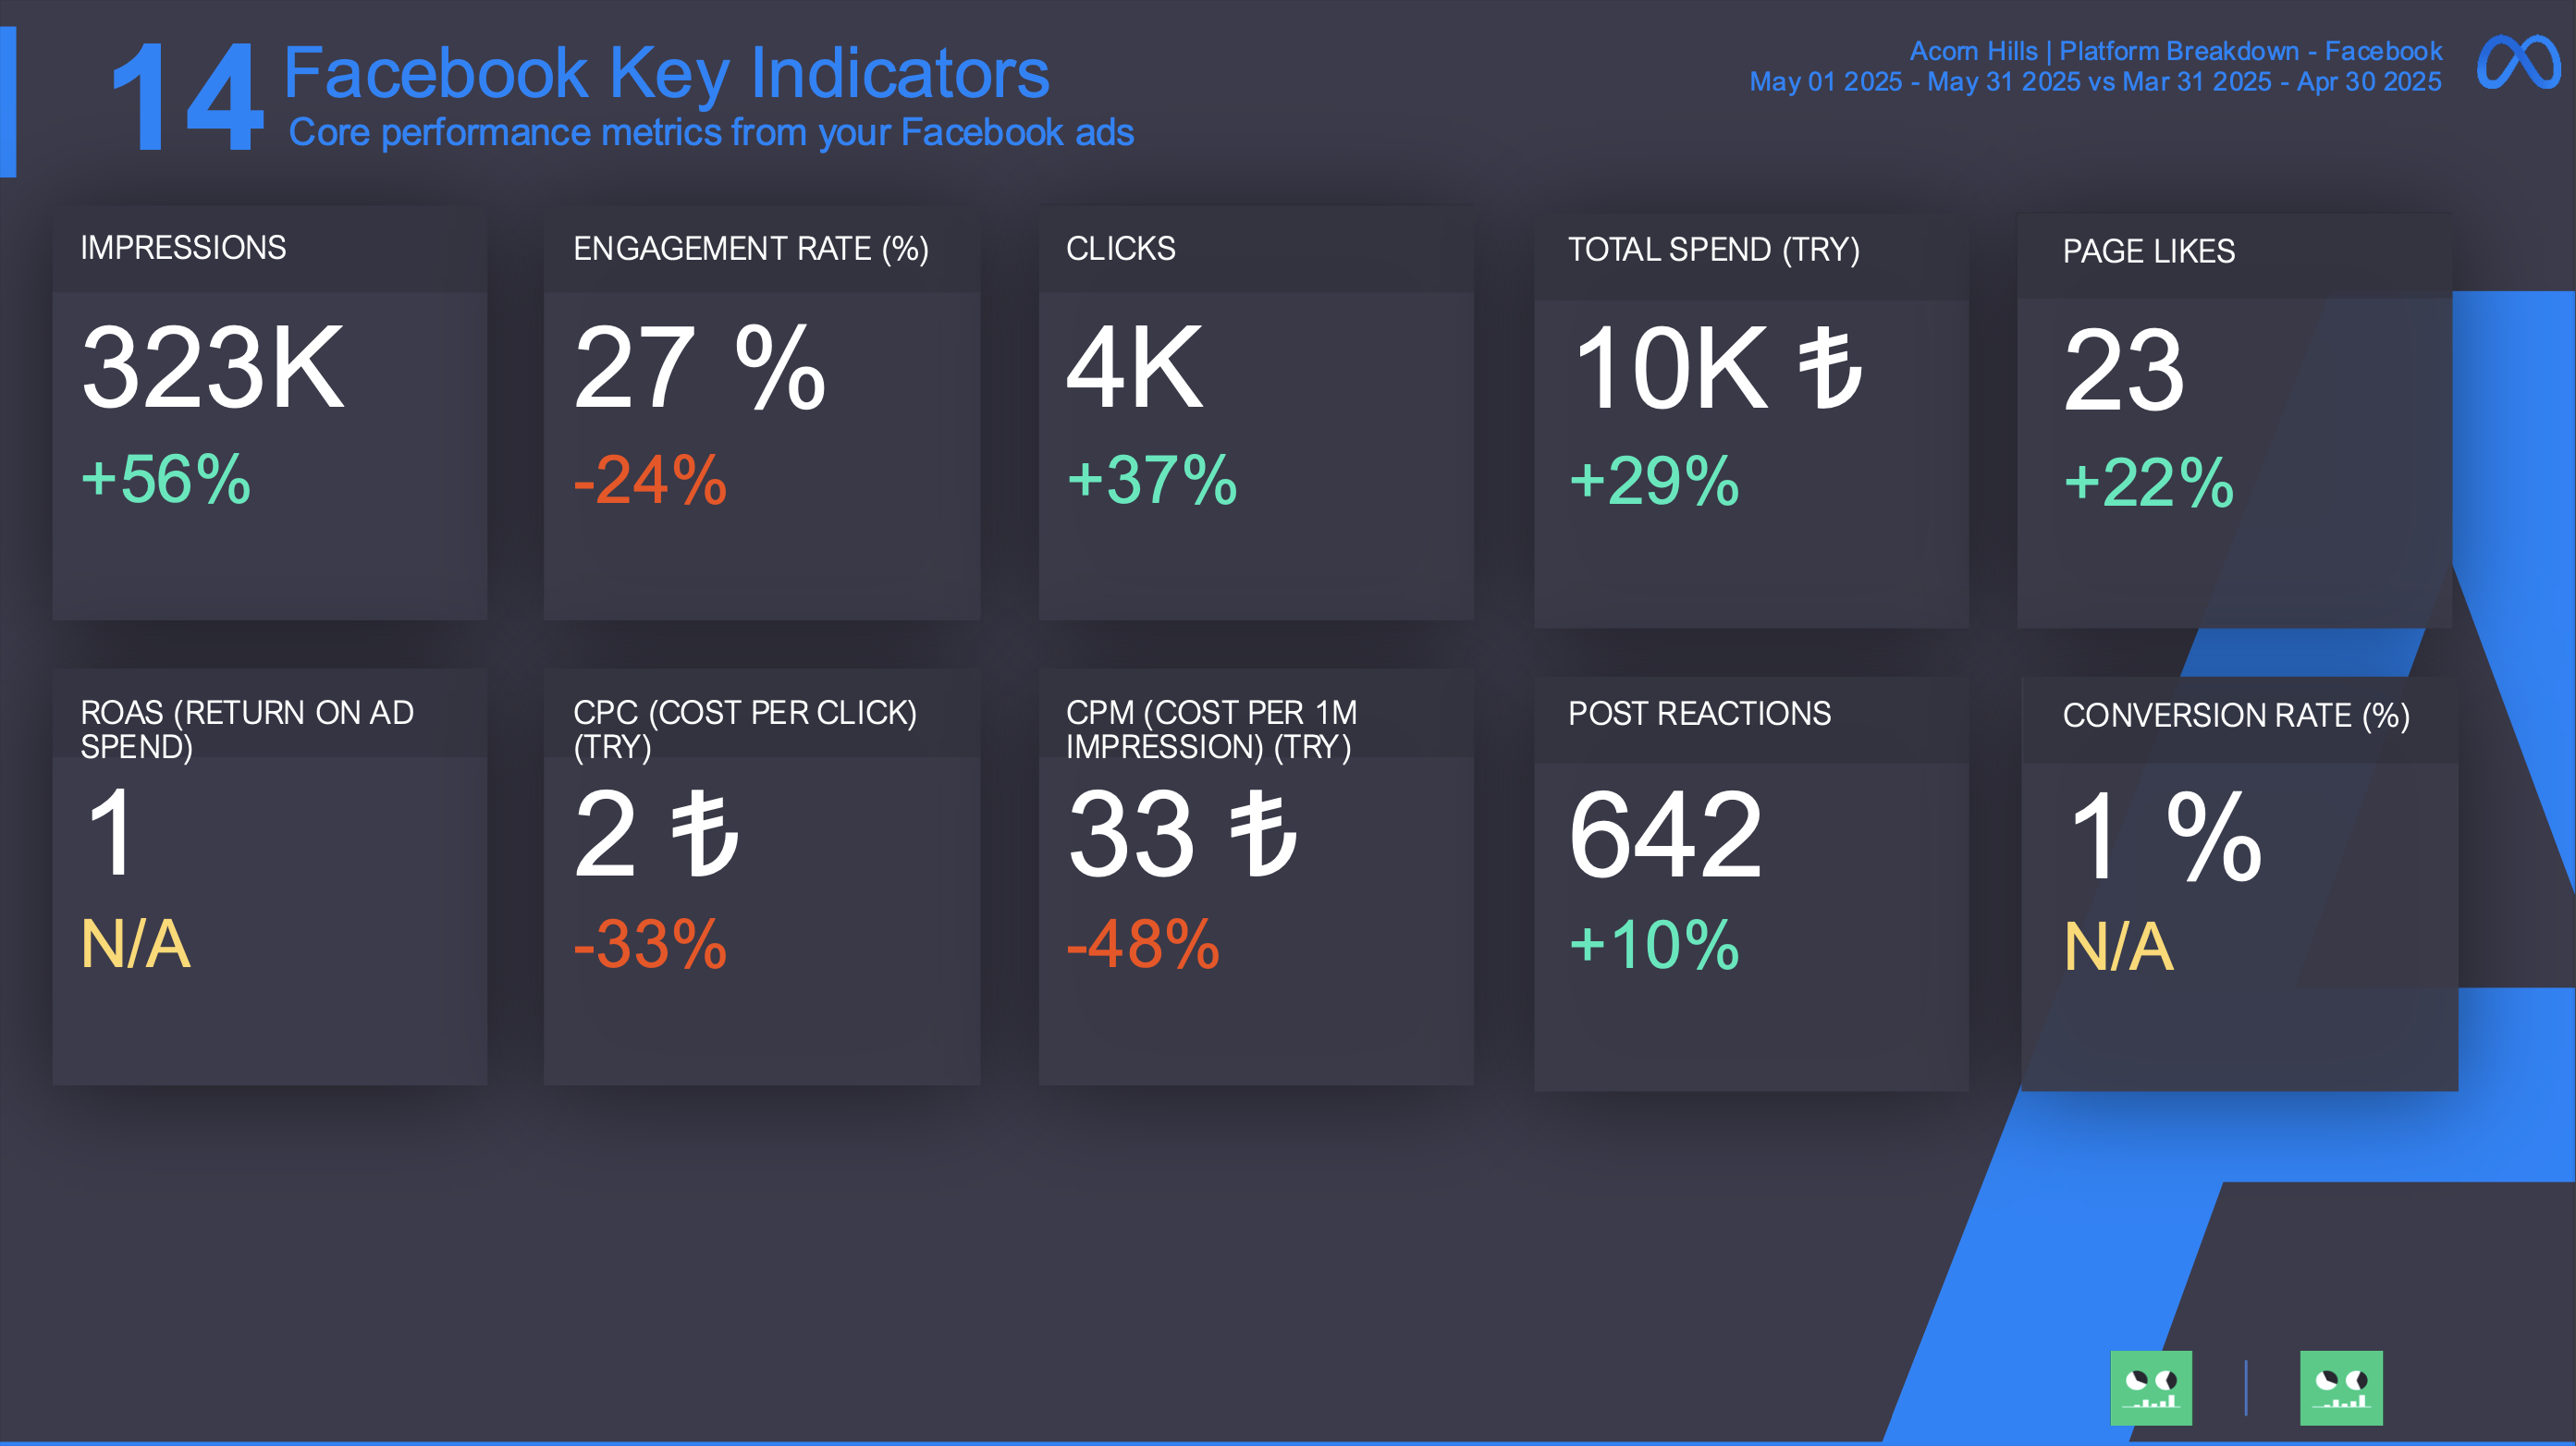
Covers Facebook ad performance only. Includes impressions, clicks, CTR, reactions, page likes, and cost metrics for posts and campaigns running on Facebook.
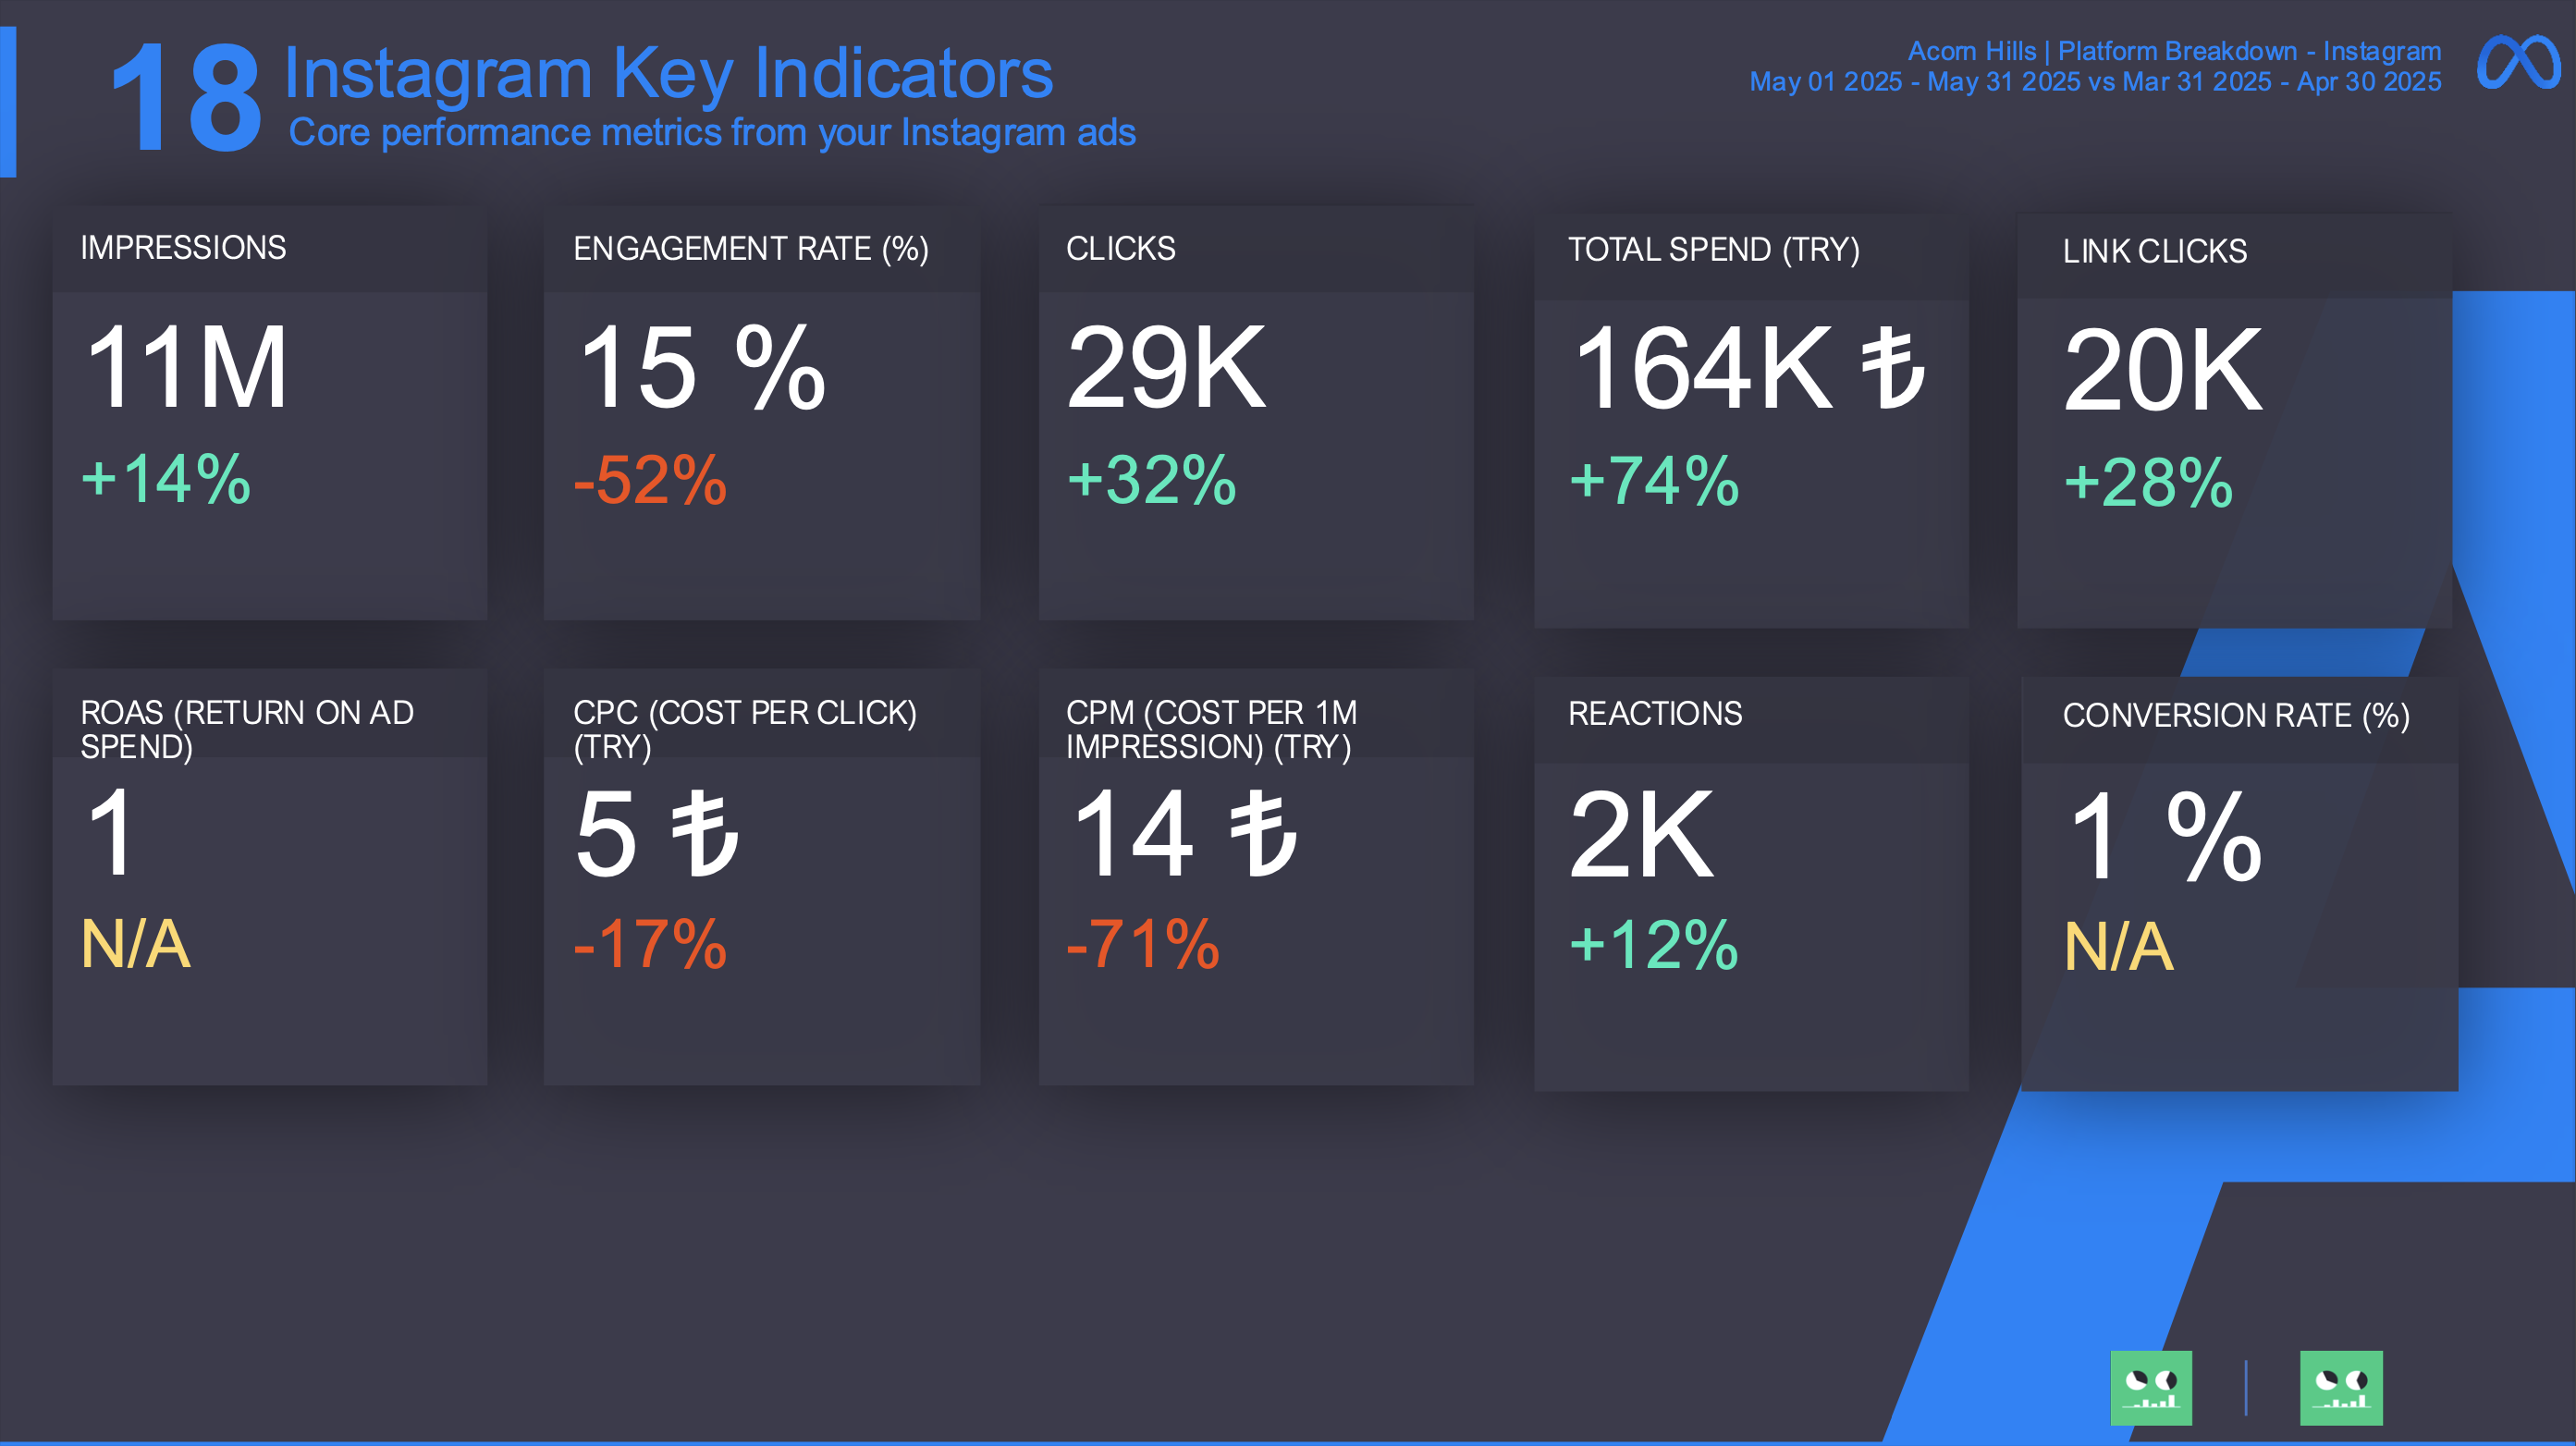
Focuses on Instagram-specific ads. Includes performance data like saves, shares, link clicks, reactions, and cost indicators unique to Instagram placements.
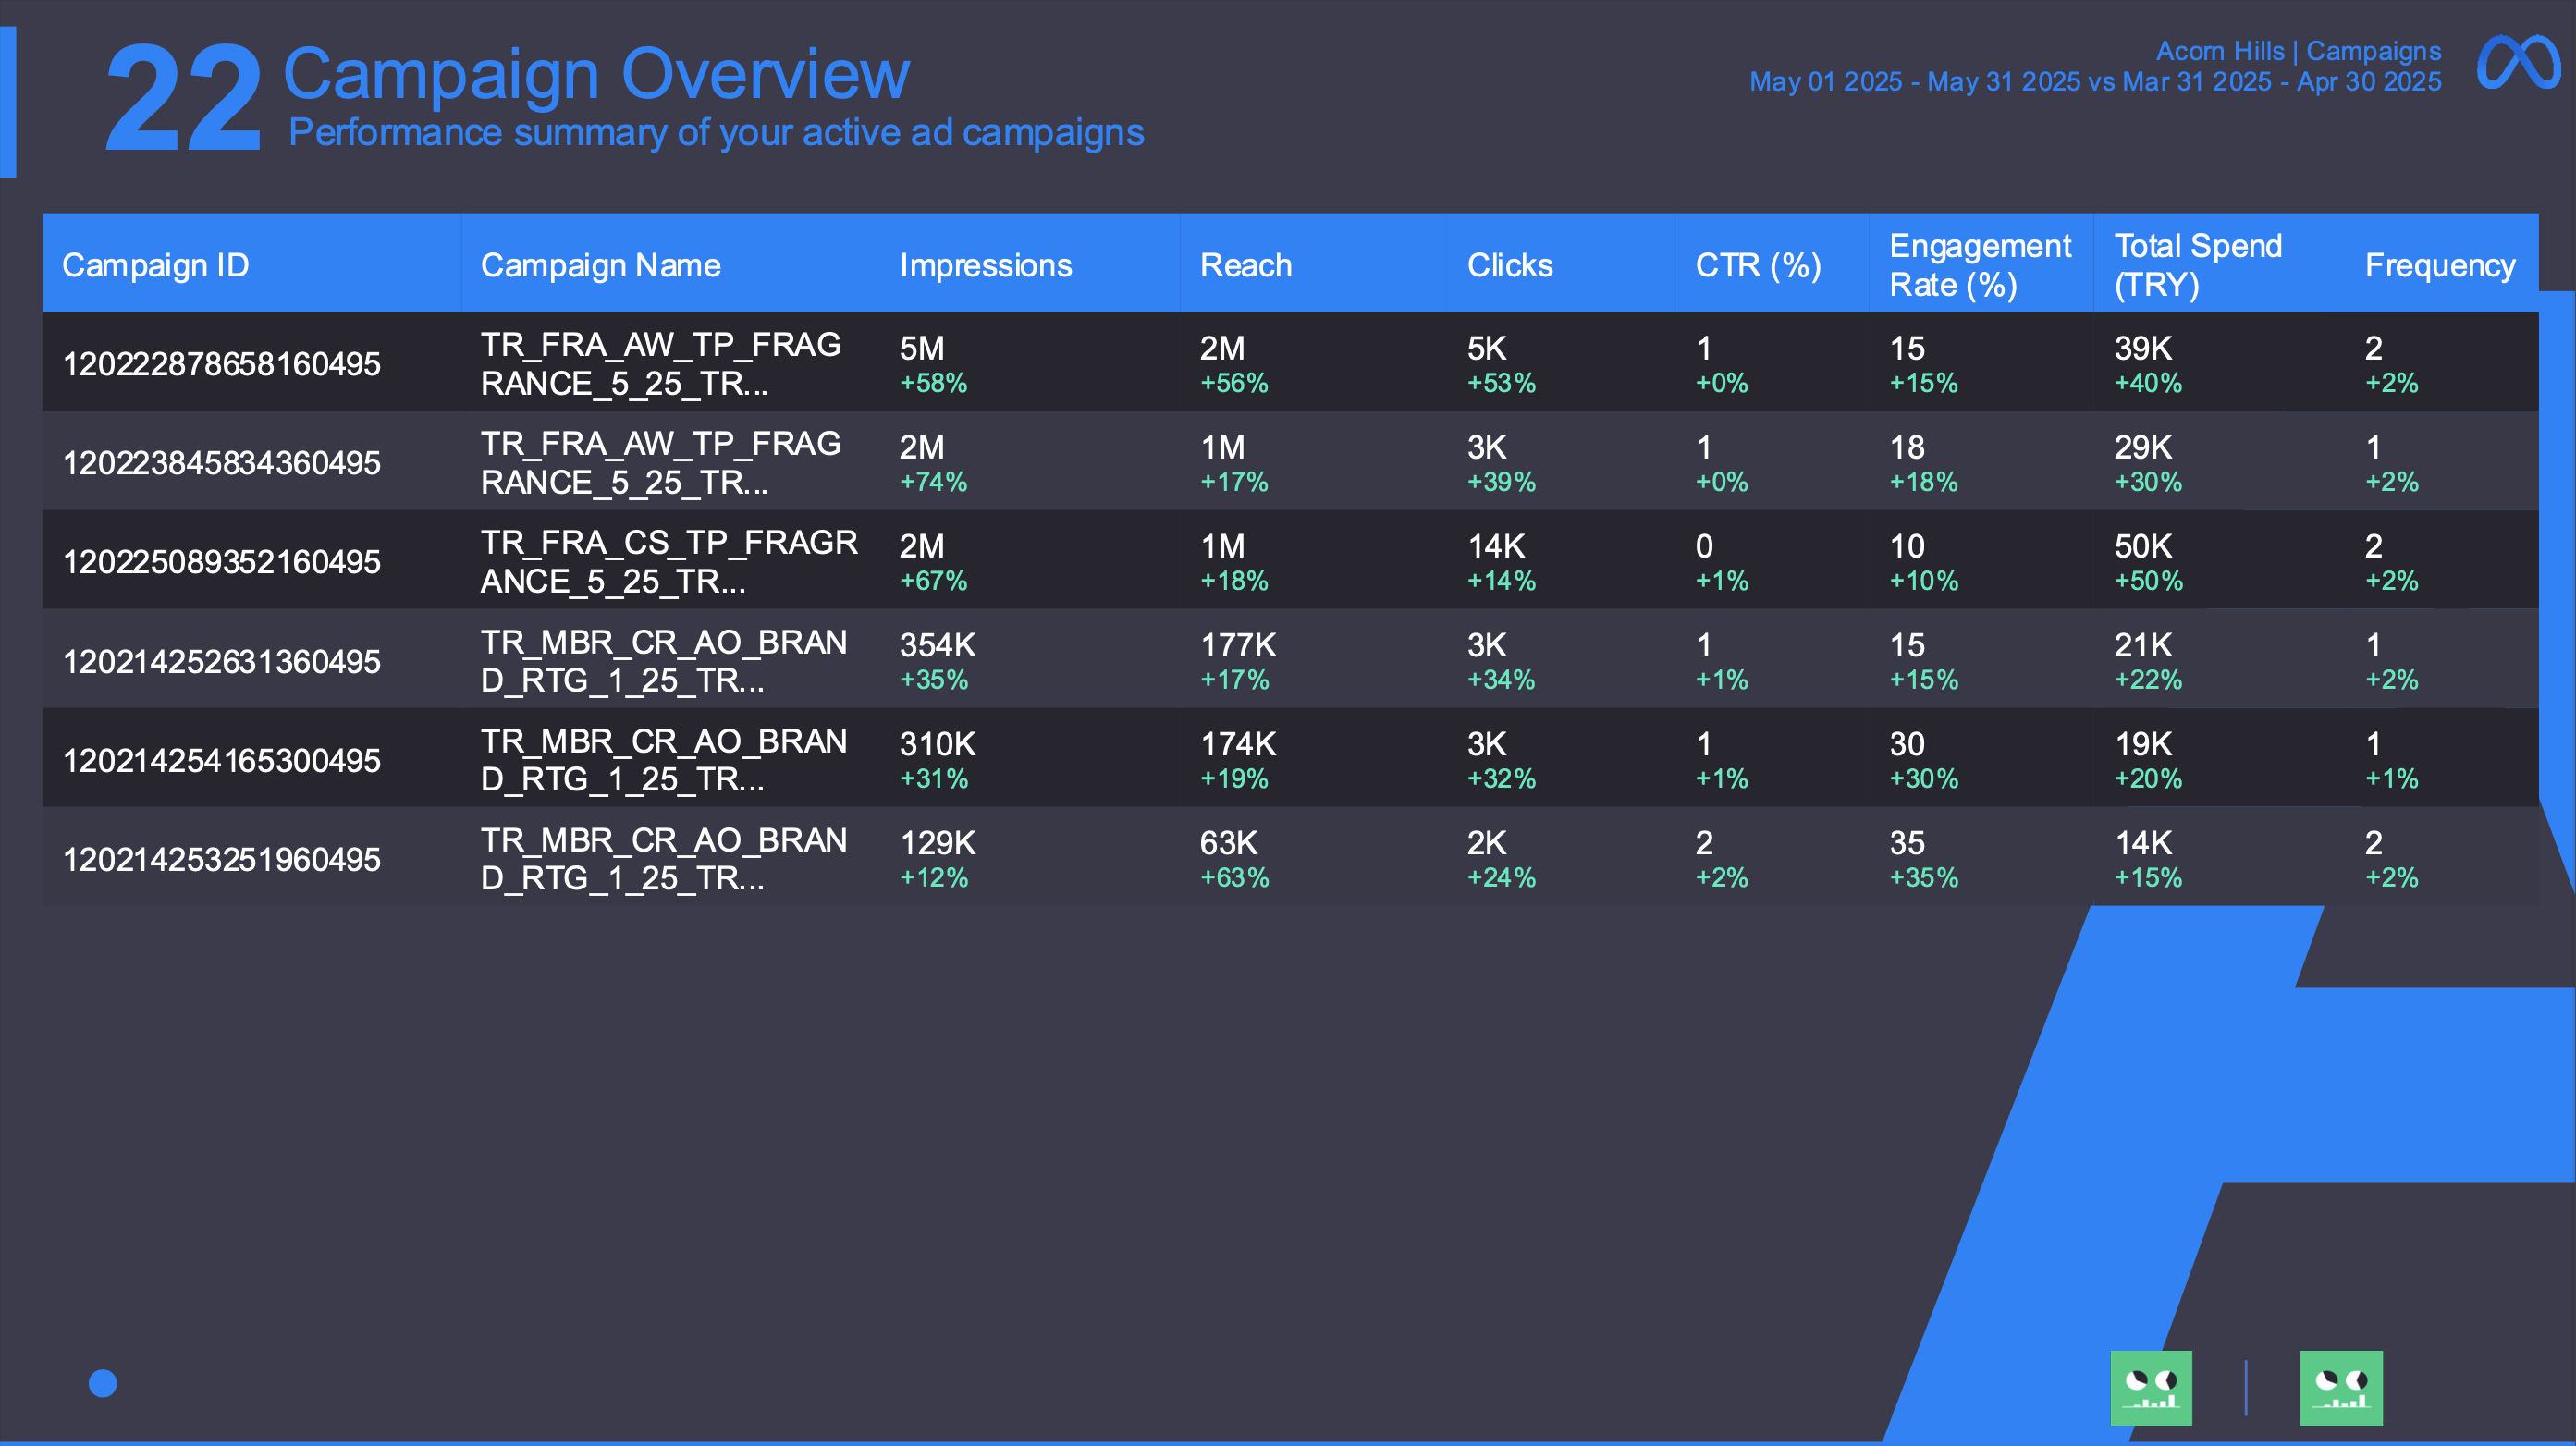
Summarizes all active and completed campaigns. Shows delivery, spend, frequency, engagement, and efficiency across each campaign to identify top and low performers.
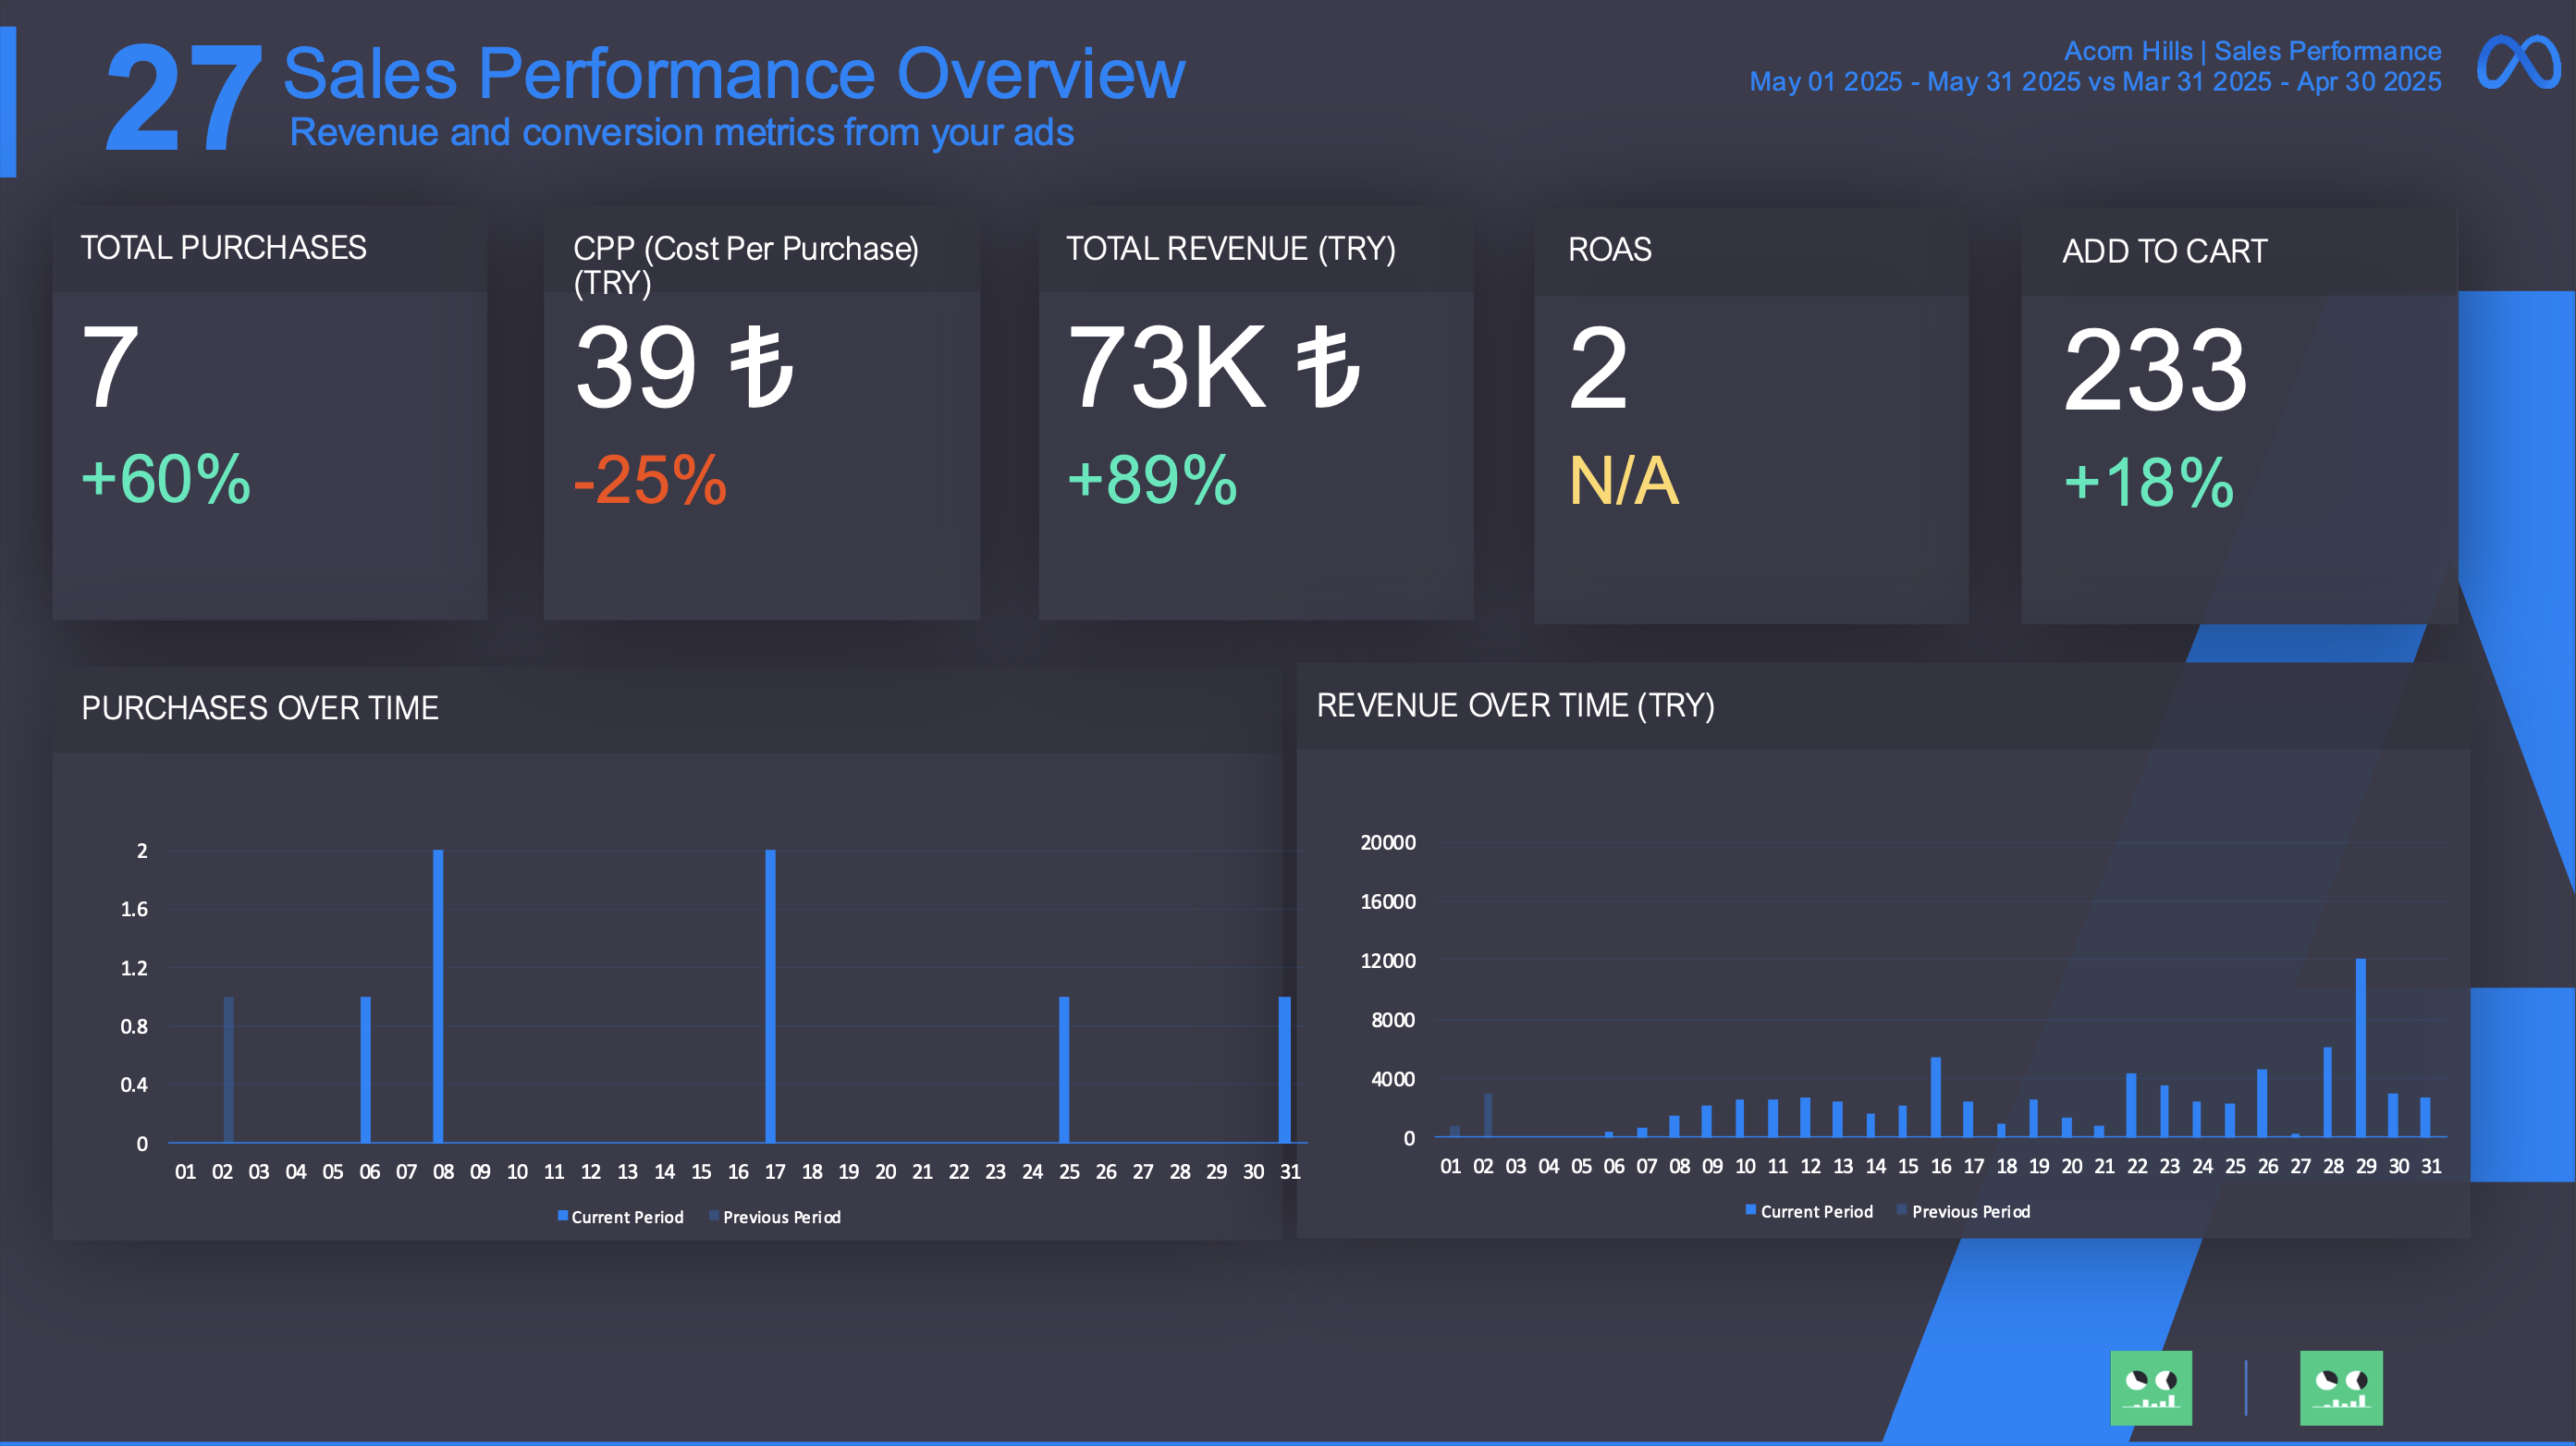
Highlights how your ads impacted sales. Includes purchases, add-to-cart data, cost per purchase, revenue, and ROAS where tracked.
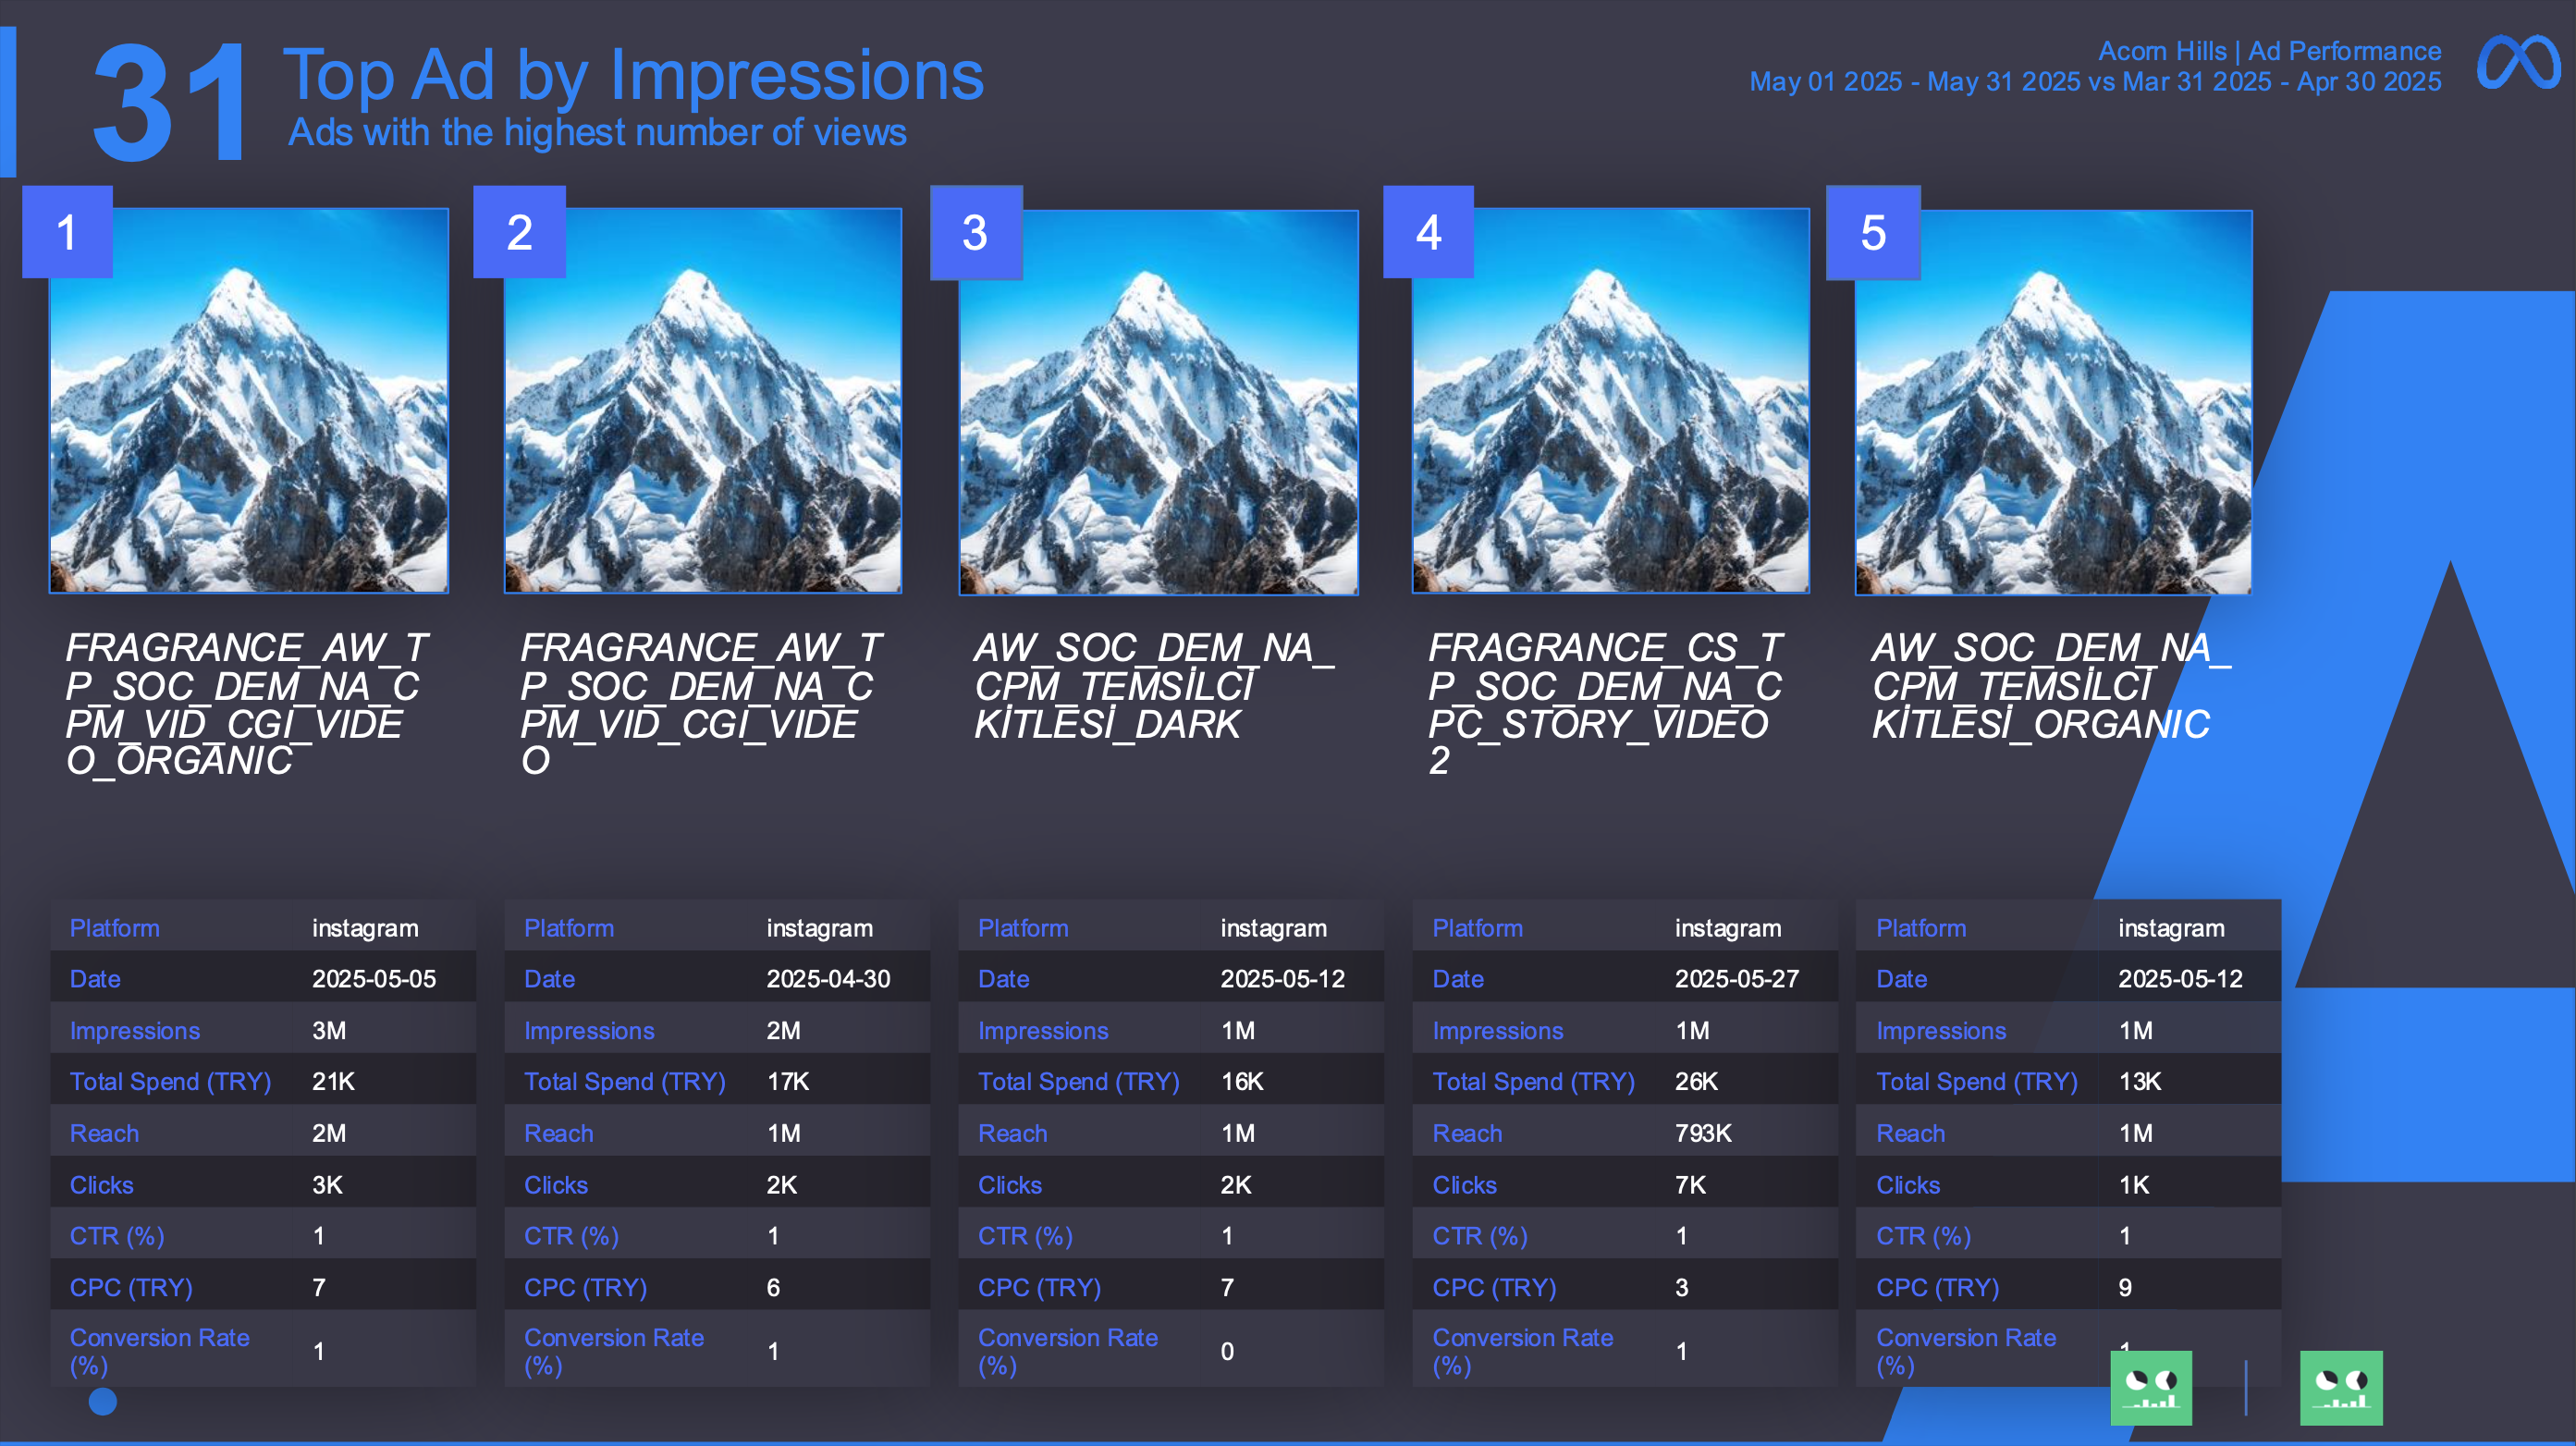
Dives into the performance of individual ad sets and creatives. Lets you compare reach, spend, clicks, CTR, engagement rate, and more across all assets.
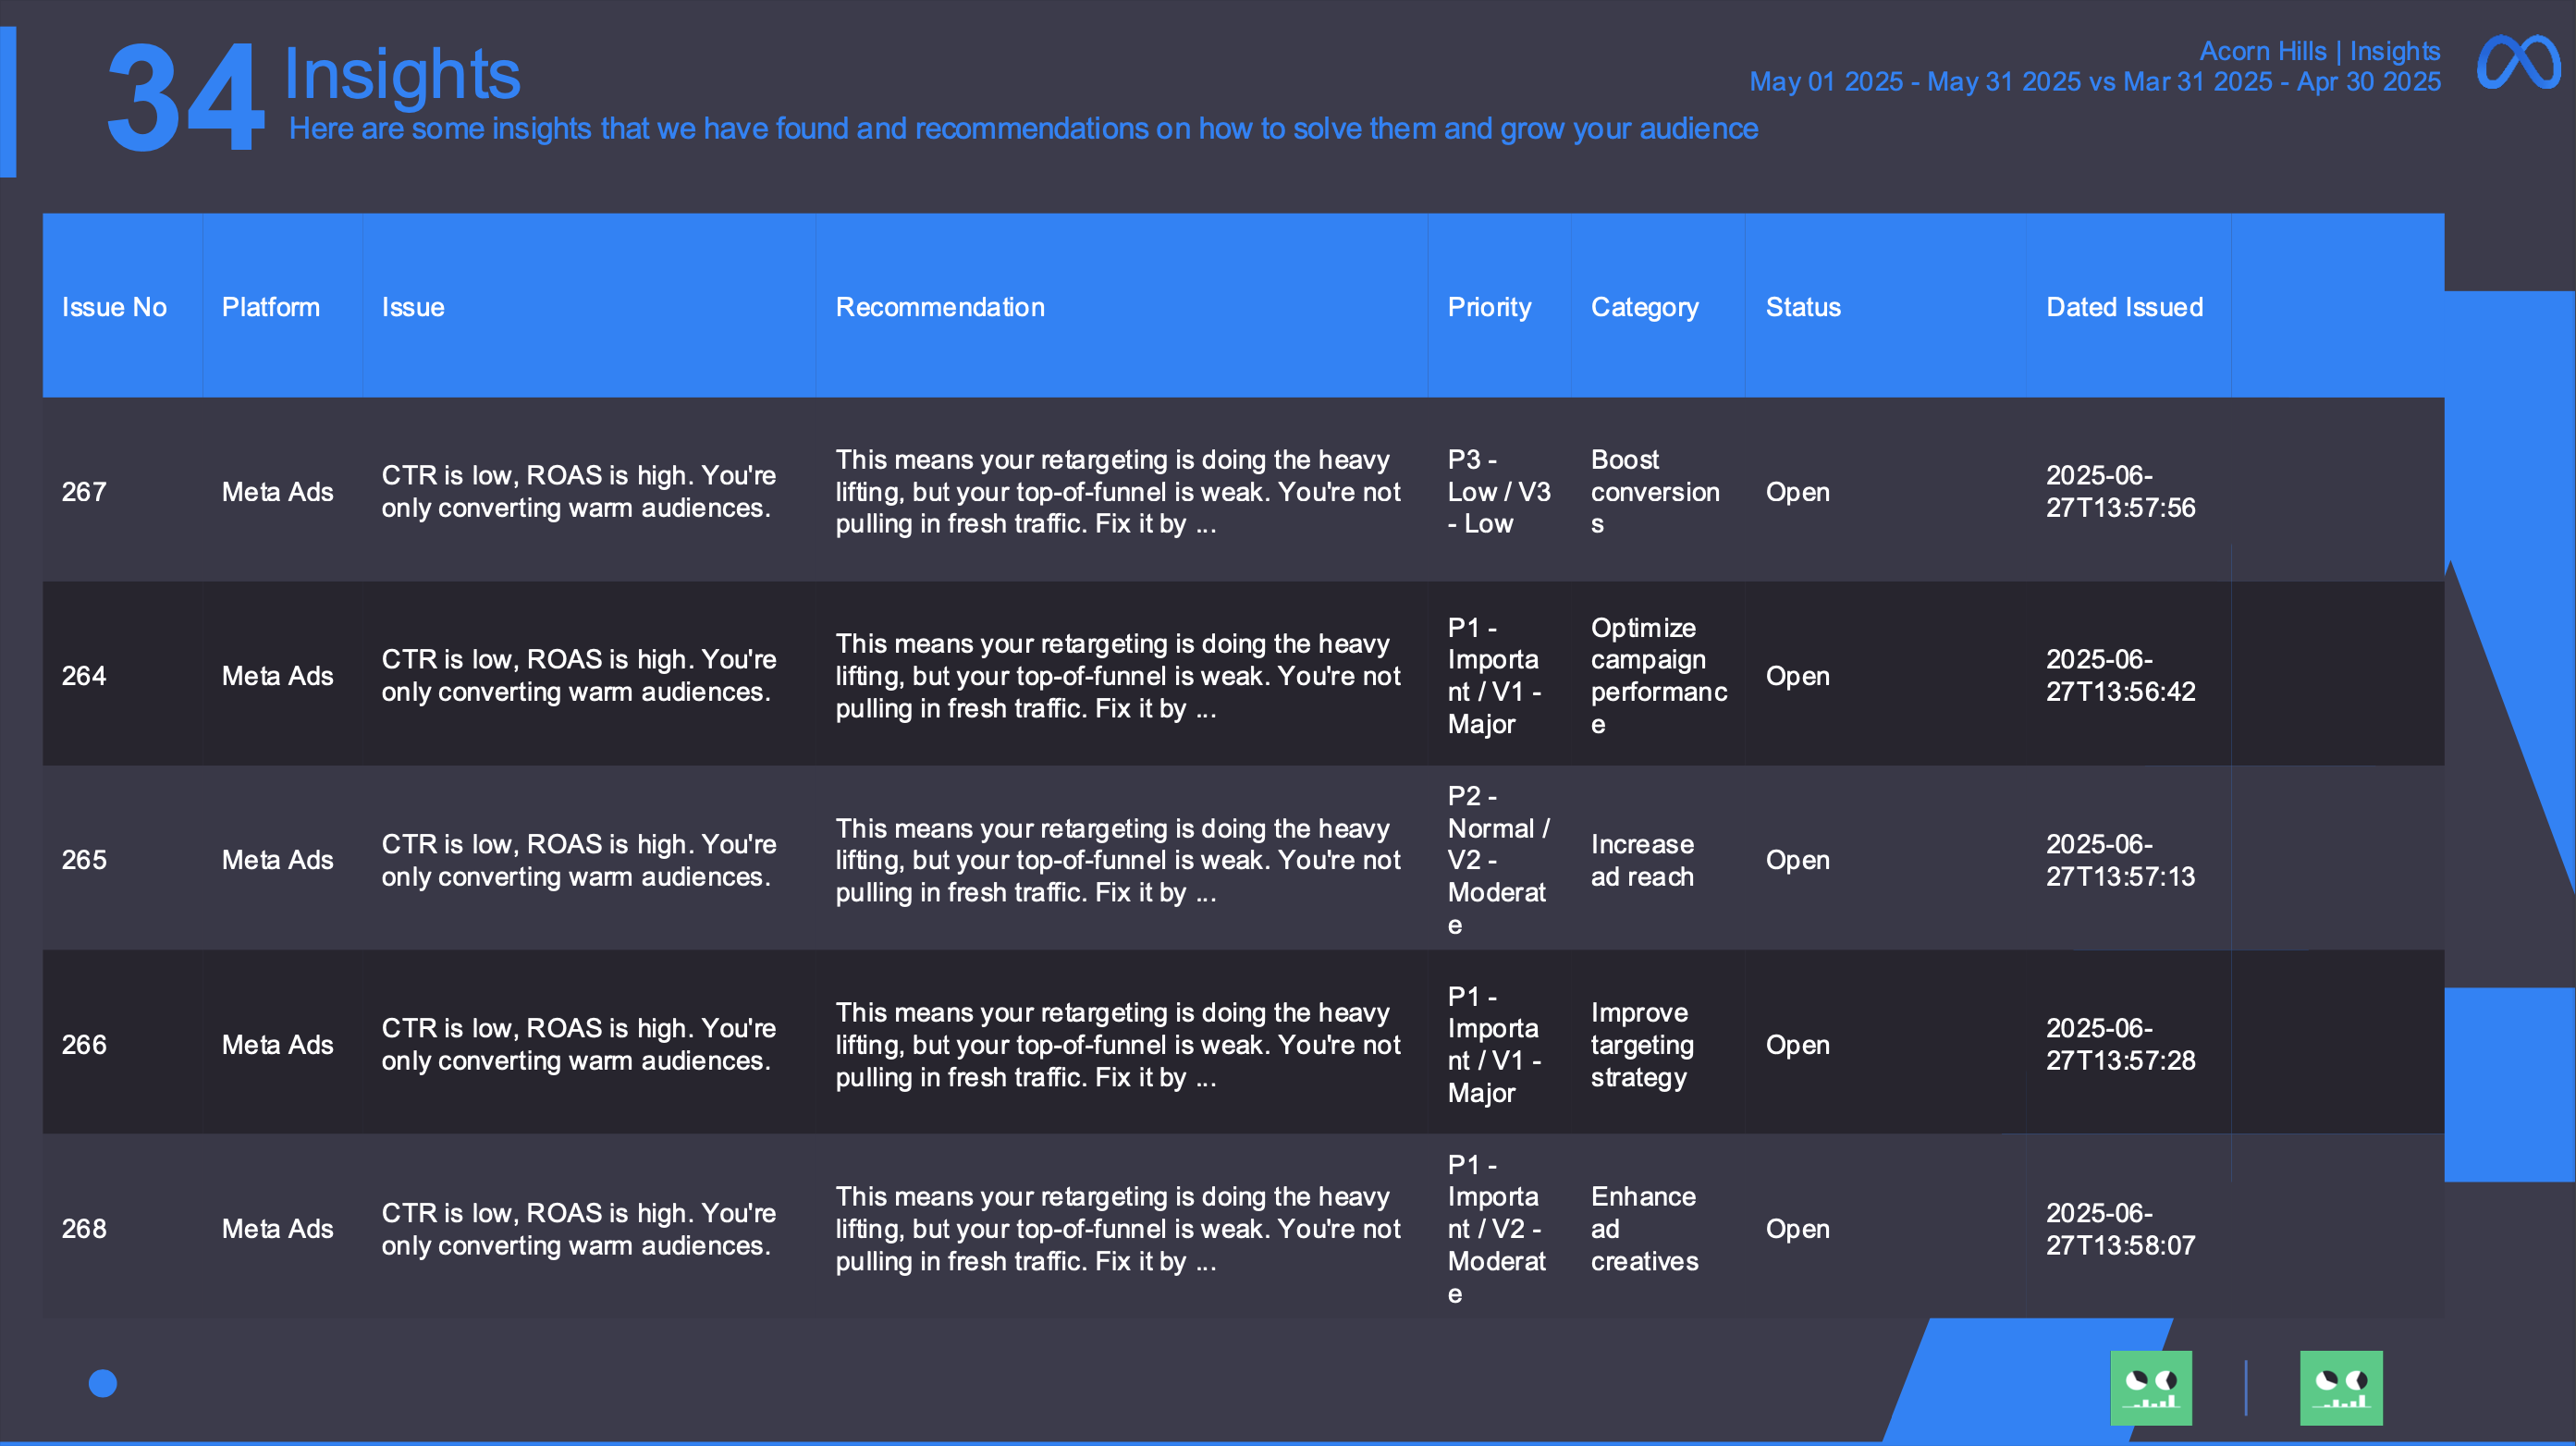
Insights about a particular report can be found in these slides. Only available on Enterprise package.
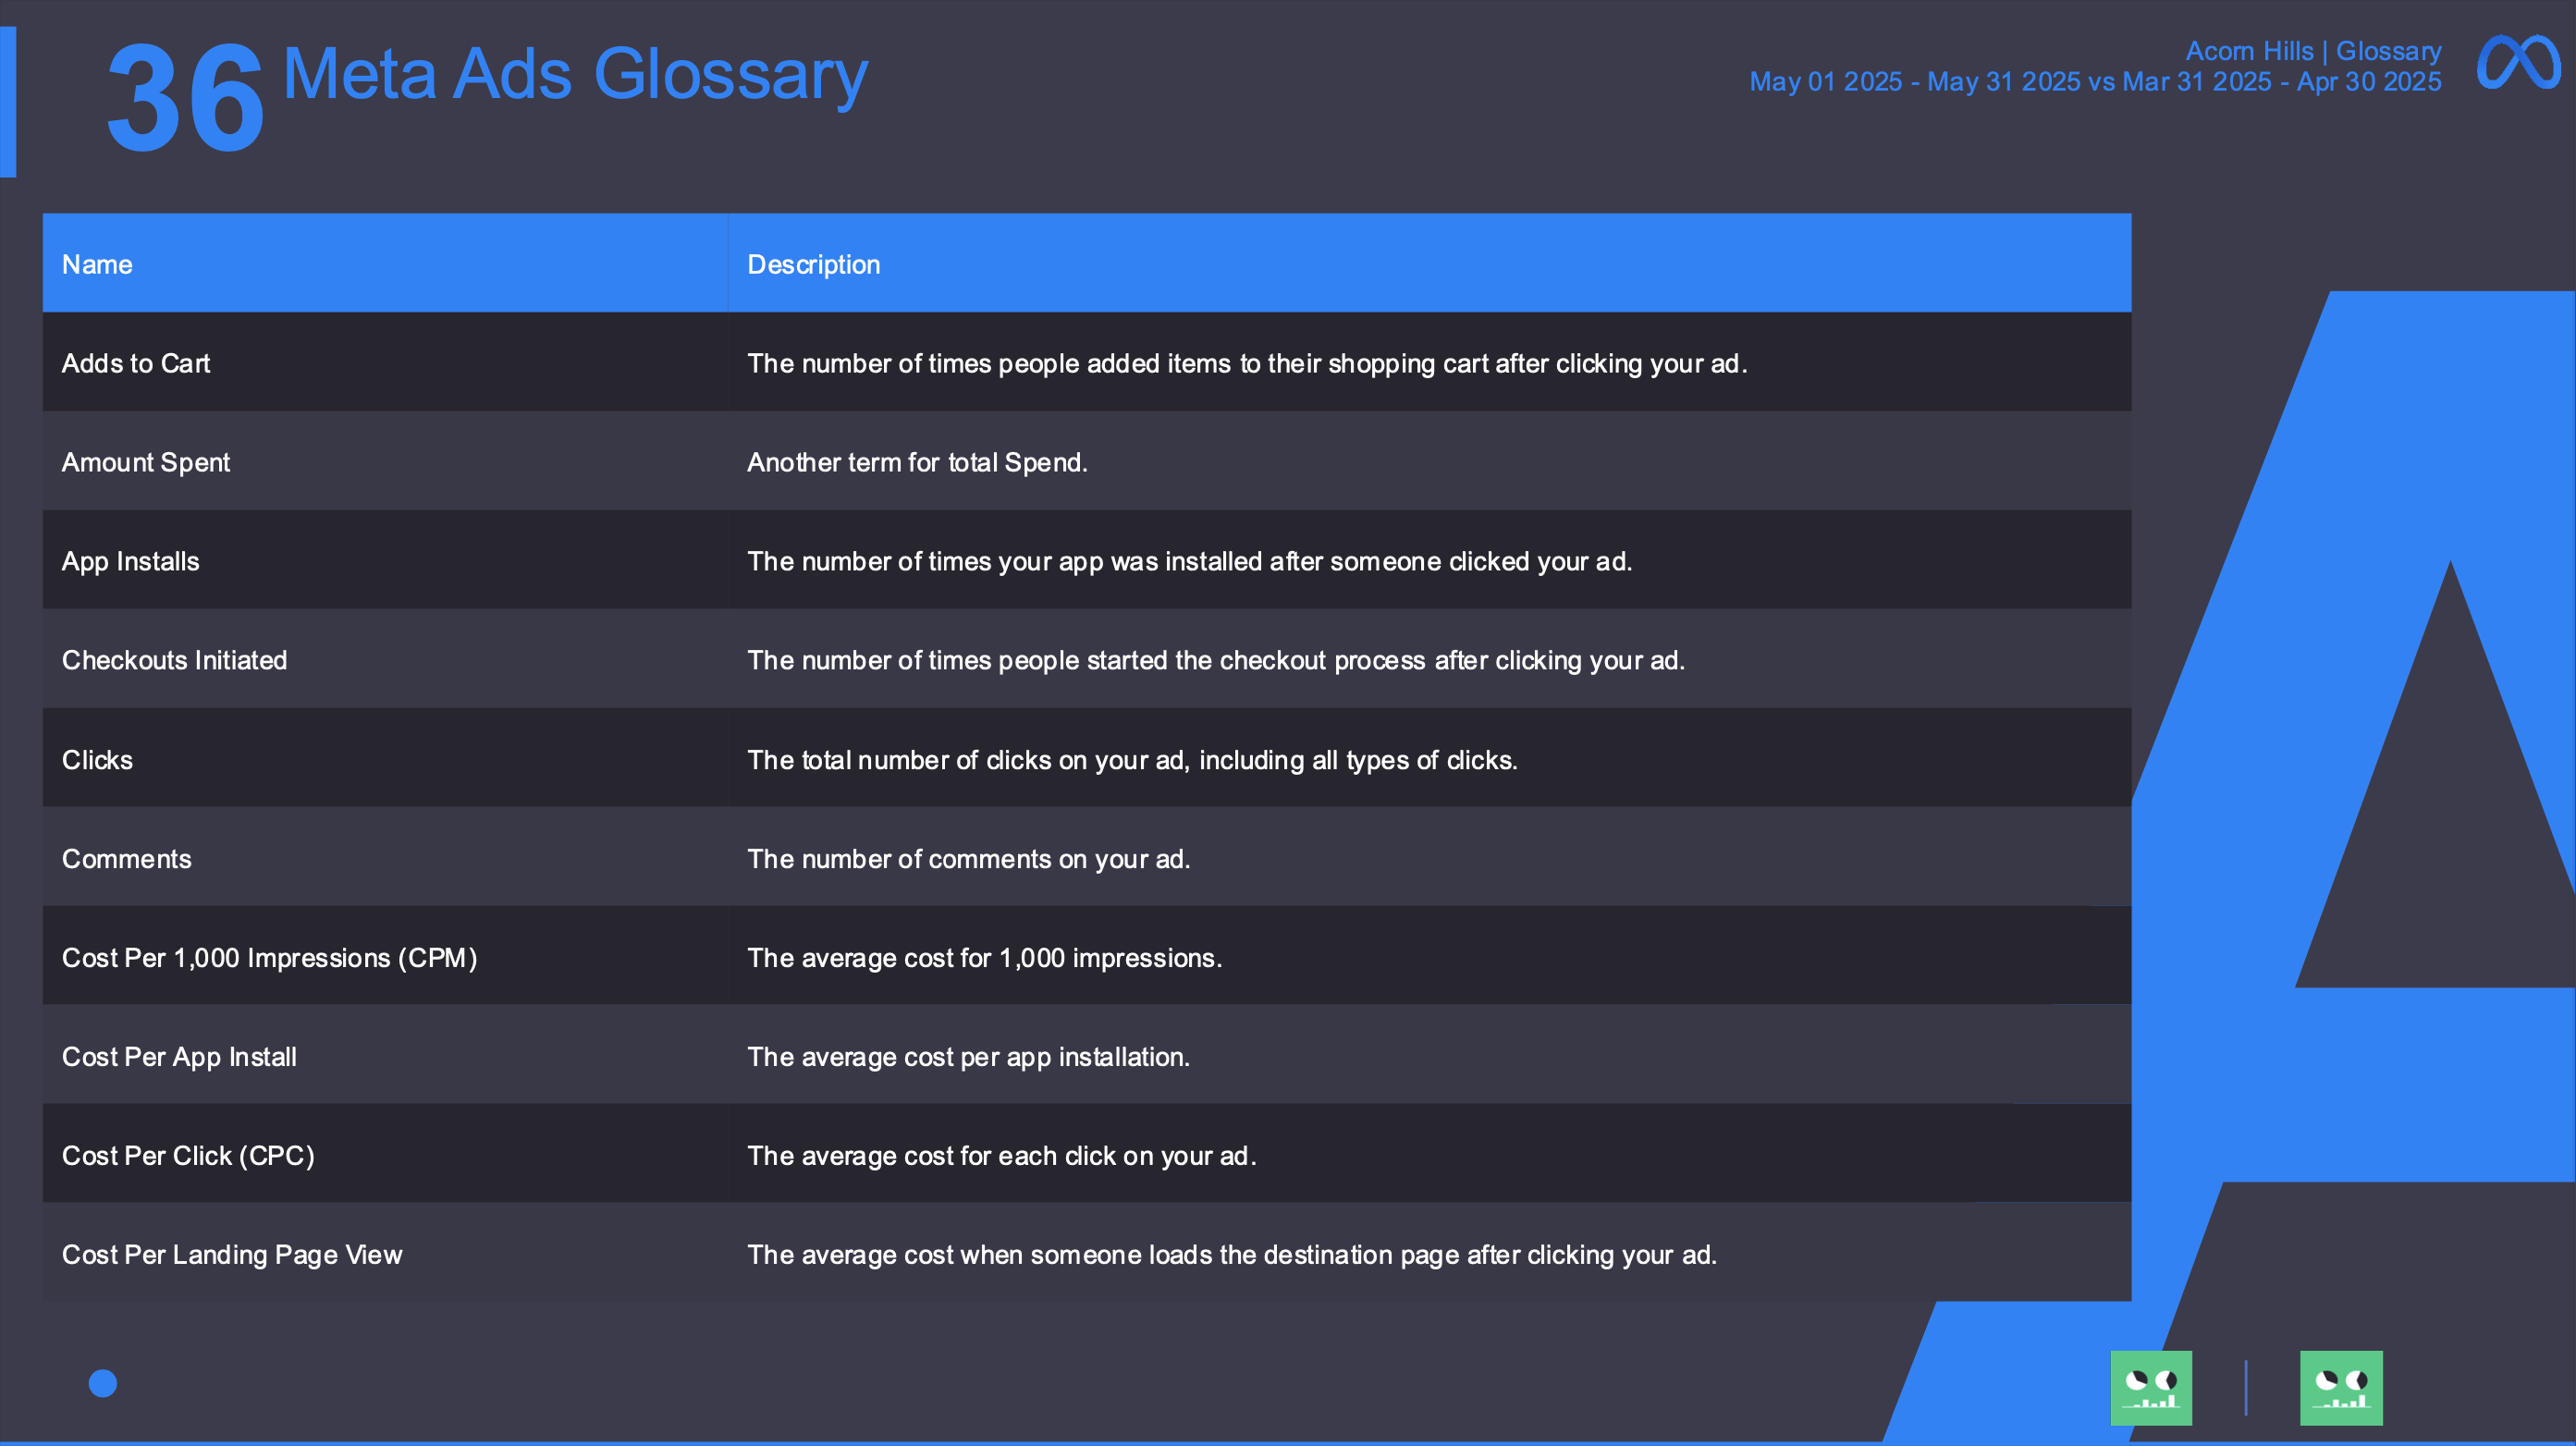
Glossary section of the report is a source for all wordings related to Meta Ads.
Pre-made Templates

Pre-made Templates
Don’t have time to even select which sections you want in your report? No worries! We also have more than 30 pre-made templates for you to choose from.
ALL TEMPLATESStyling Options
Slide backgrounds, chart colors or chart types are all customizable. Again, if you don’t want to spend your time on that either, you can always pick a theme.
Styling Options


Report Scheduling

Report
Scheduling
Scheduling your reports is easy. Once you build your report just set the frequency, time and sender list and be on your way. Again, time saved!
Compare previous periods
To understand the performance of a period of time you have to compare it to another period.
Compare previous periods

Set of Features for Agencies
Set of Features for Agencies
Slidebeast has a set of different features for agencies such as multiple accounts. This feature enables agencies to be able to switch between accounts easily and effortlessly.
- Multiple Account Management
- Client Branding
- Client Logo
- Insights Panel
- Issue Tracking
All Features
A quick recap of what Slidebeast offers
Lightening Fast Report Building
Get your reports in minutes not hours
Choose from 30+ pre-made templates
You can pick from various templates ranging from executive summaries to reach, engagement or sales templates.
No dashboard building or blank canvases
We already did the work, connect your account and get the report
Fully customizable
styling according to your or your client’s needs
Report scheduling when needed
Instead of re-building your reports, let the report come to you or to your clients
Save your own templates
Apply your favorite selections to all reports
Easy to understand section format
We combined important data into sections so that you can retrieve information on a systematic basis
All marketing platforms under one roof
Slidebeast currently offers Google Analytics 4, Google Ads, Instagram, Facebook, Meta and LinkedIn reports, but more is on the way
Mix and Match Reports
Sections are interchangeable, just drag and drop what needs your immediate attention and what can wait
Use unlimited workspace
Divide your brands, your platforms or your accounts into separate workspaces in order to keep a neat look
Comprehensive system for insight generation
Ability to add insights at the end of reports in order to follow up on important recommendations and how to implement them
Issue Tracking
Assign and track issues, open new issues, and close the ones that are completed via the Insights panel
Tailor made reports

Tailor made reports
Get tailor made reports just for you or for your company. Get in touch with us to see how we can make your white label reporting needs possible.
Get in touch