Instagram Analytics Reporting Tool
Whether you're a startup or an agency, discover the impact of Slidebeast's Instagram Reporting
The most user-friendly solution for creating Instagram reports
Slidebeast's Instagram reports offer an in-depth analysis of your social media performance, presenting vital data and visual insights in an organized structure, much like an engaging presentation.
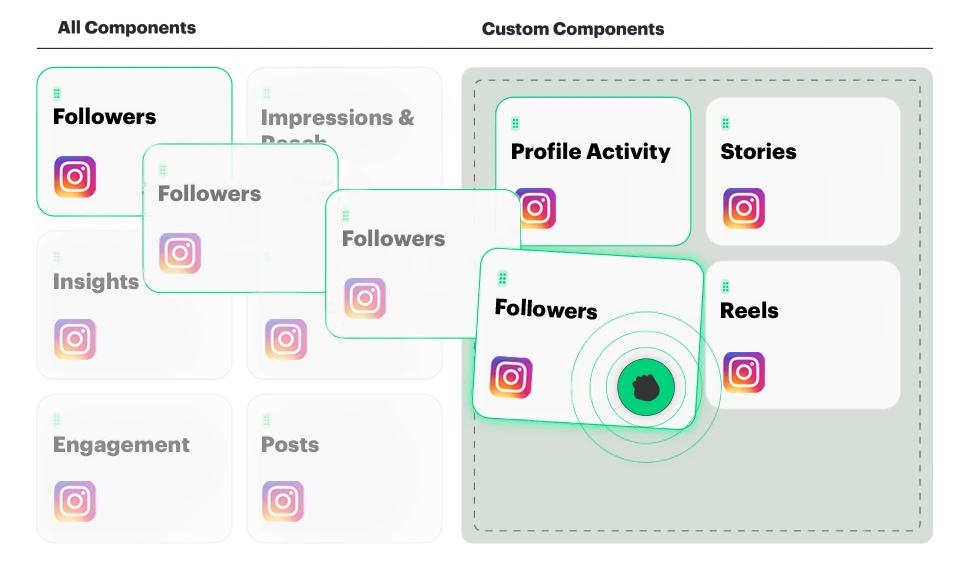
Creating a report is effortless. Just drag and drop key data sections
Tailor your report to meet your specific data requirements such as your Reels or Stories performance by effortlessly adding or removing sections as needed.
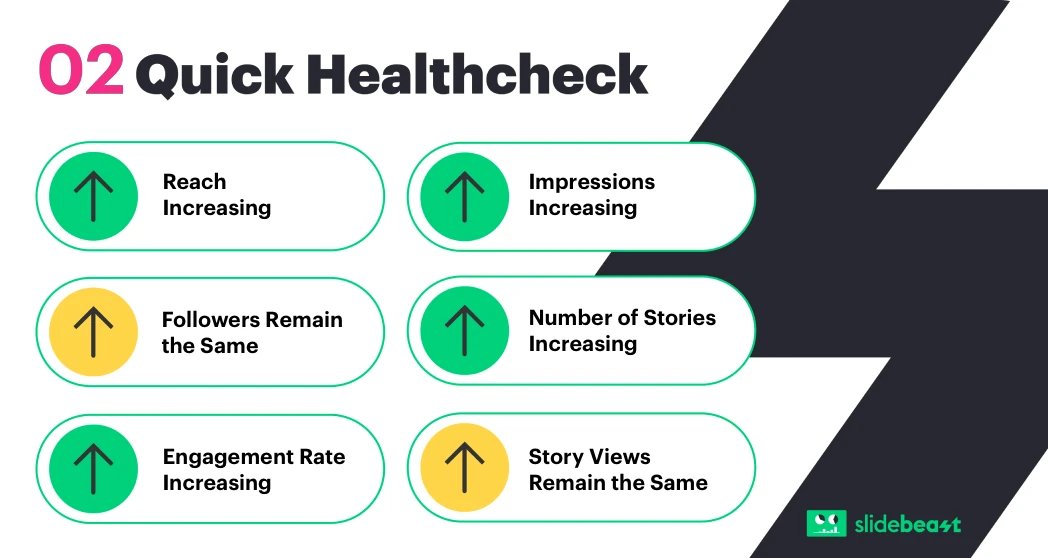
Quickly evaluate your performance with a concise snapshot.
If you're on the move and prefer a quick overview without delving into details, Slidebeast offers succinct yet comprehensive slides for rapid insights.
Getting Started with Slidebeast Instagram Reporting
In every data section, discover vital information crucial for your business. Be confident that we've diligently incorporated all the essential details, ensuring no pertinent information has been disregarded.
Connect your Instagram Account
Pick a pre-made reporting template or start from scratch
Follow the Create Report Wizard steps
Download & Schedule your report

Instagram Report Sections You Can Get With Slidebeast
We take pride in our reporting approach. Slidebeast provides 12 diverse sets of data sections to ensure you gain all the insights you require for your Instagram reporting
- OVERVIEW
- FOLLOWERS
- DEMOGRAPHICS
- IMPRESSIONS & REACH
- ENGAGEMENT
- GEOGRAPHY
- POSTS
- STORIES
- REELS
- INSIGHTS
- GOAL PERFORMANCE
- GLOSSARY
No time to create a report from scratch?
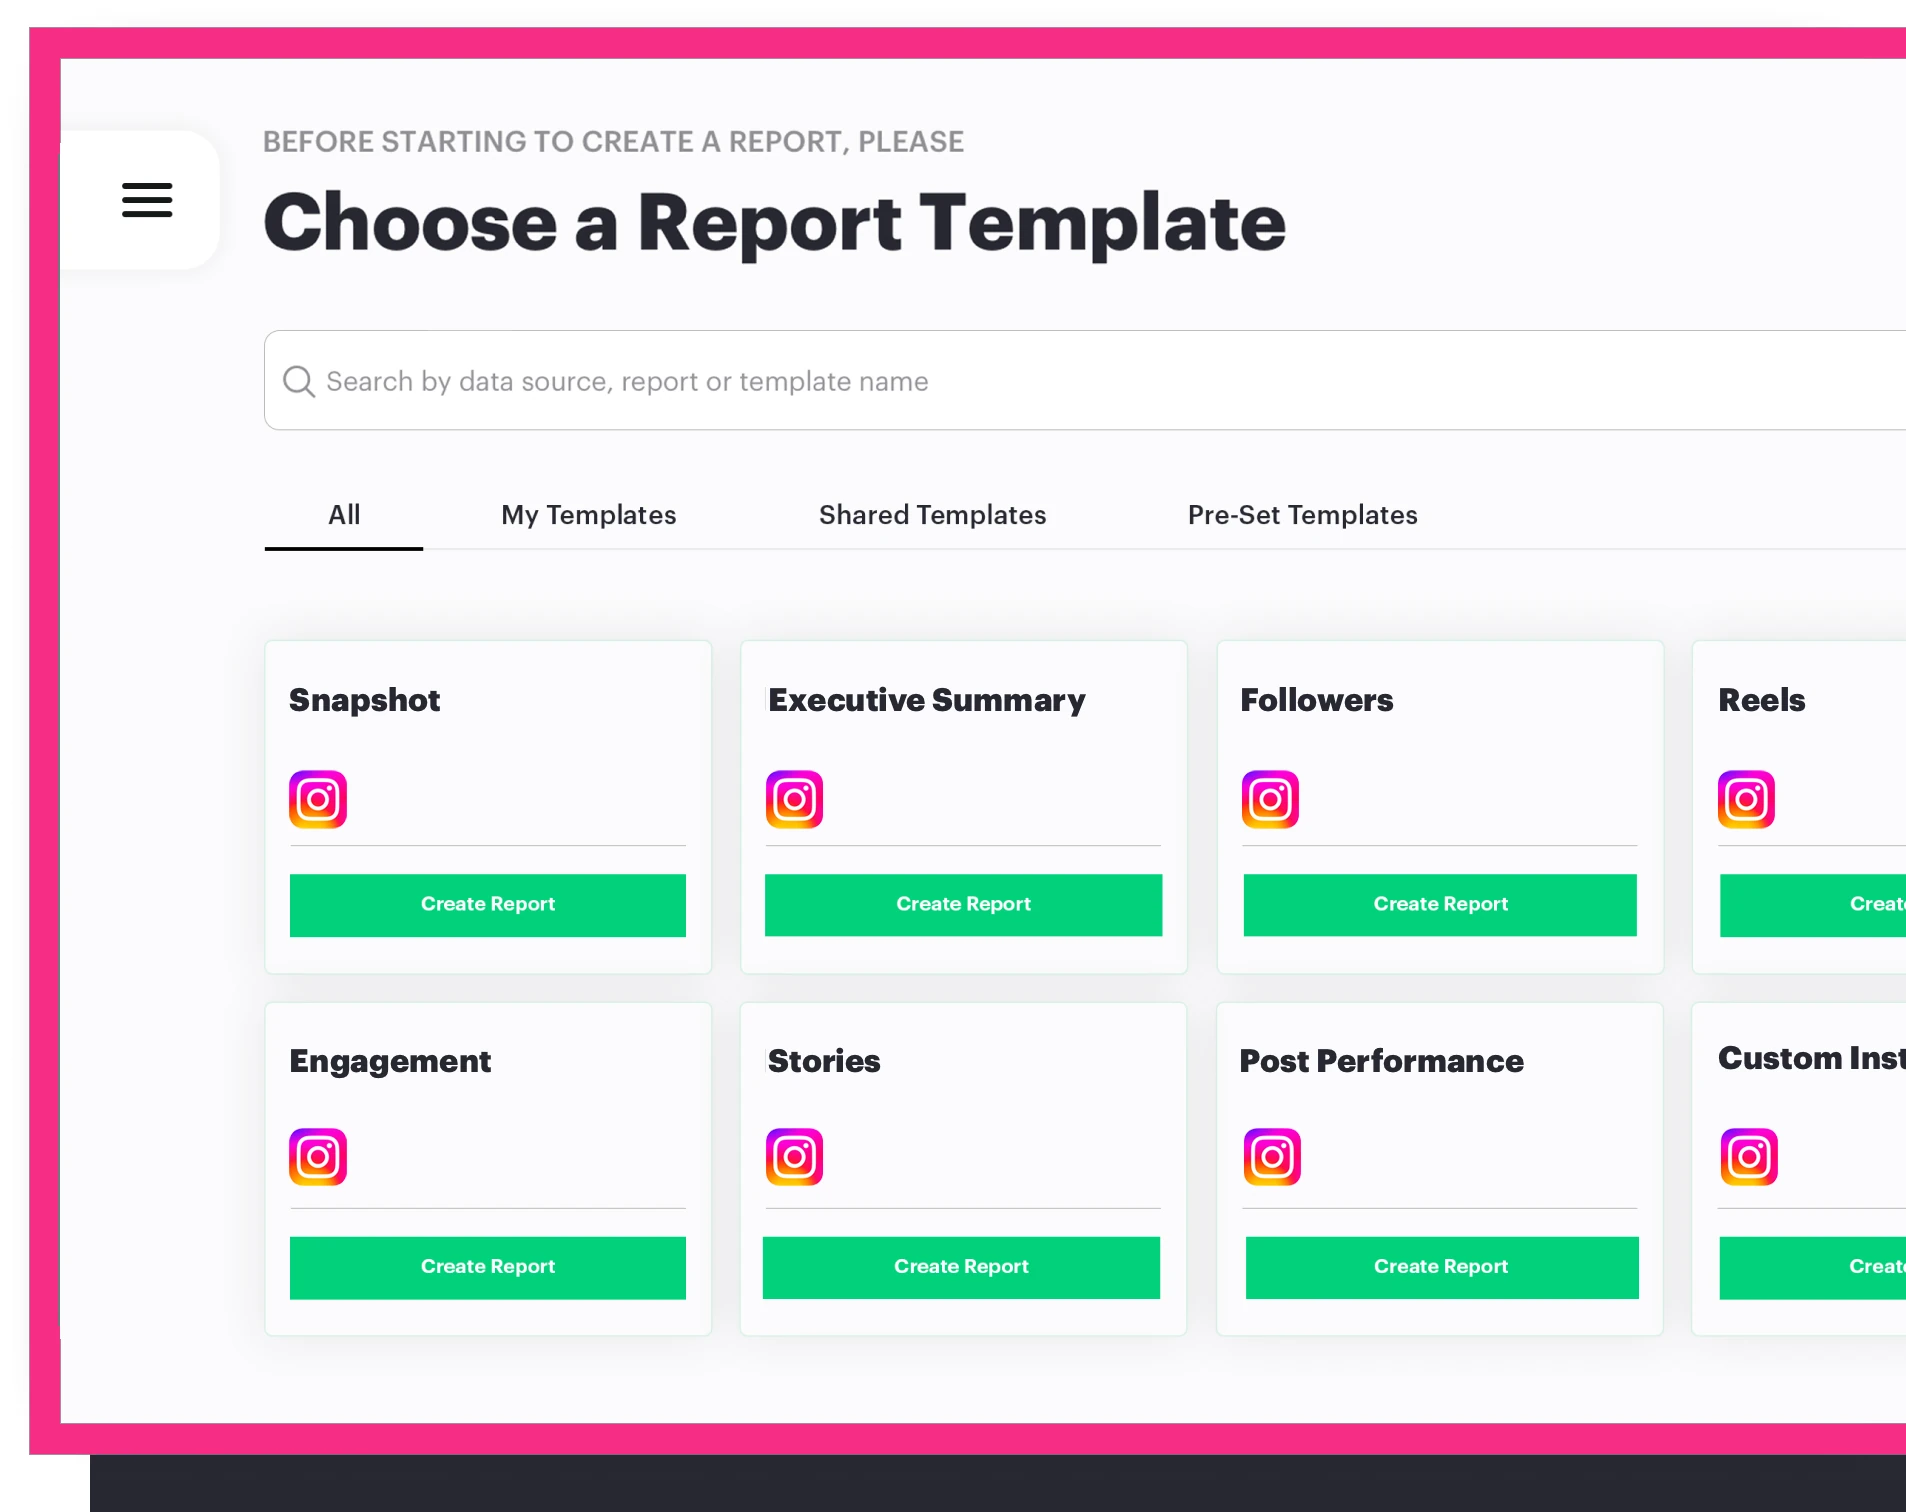
Explore impactful Instagram metrics
In every data section, discover vital information crucial for your business. Be confident that we've diligently incorporated all the essential details, ensuring no pertinent information has been disregarded.

A Quick Look at Performance
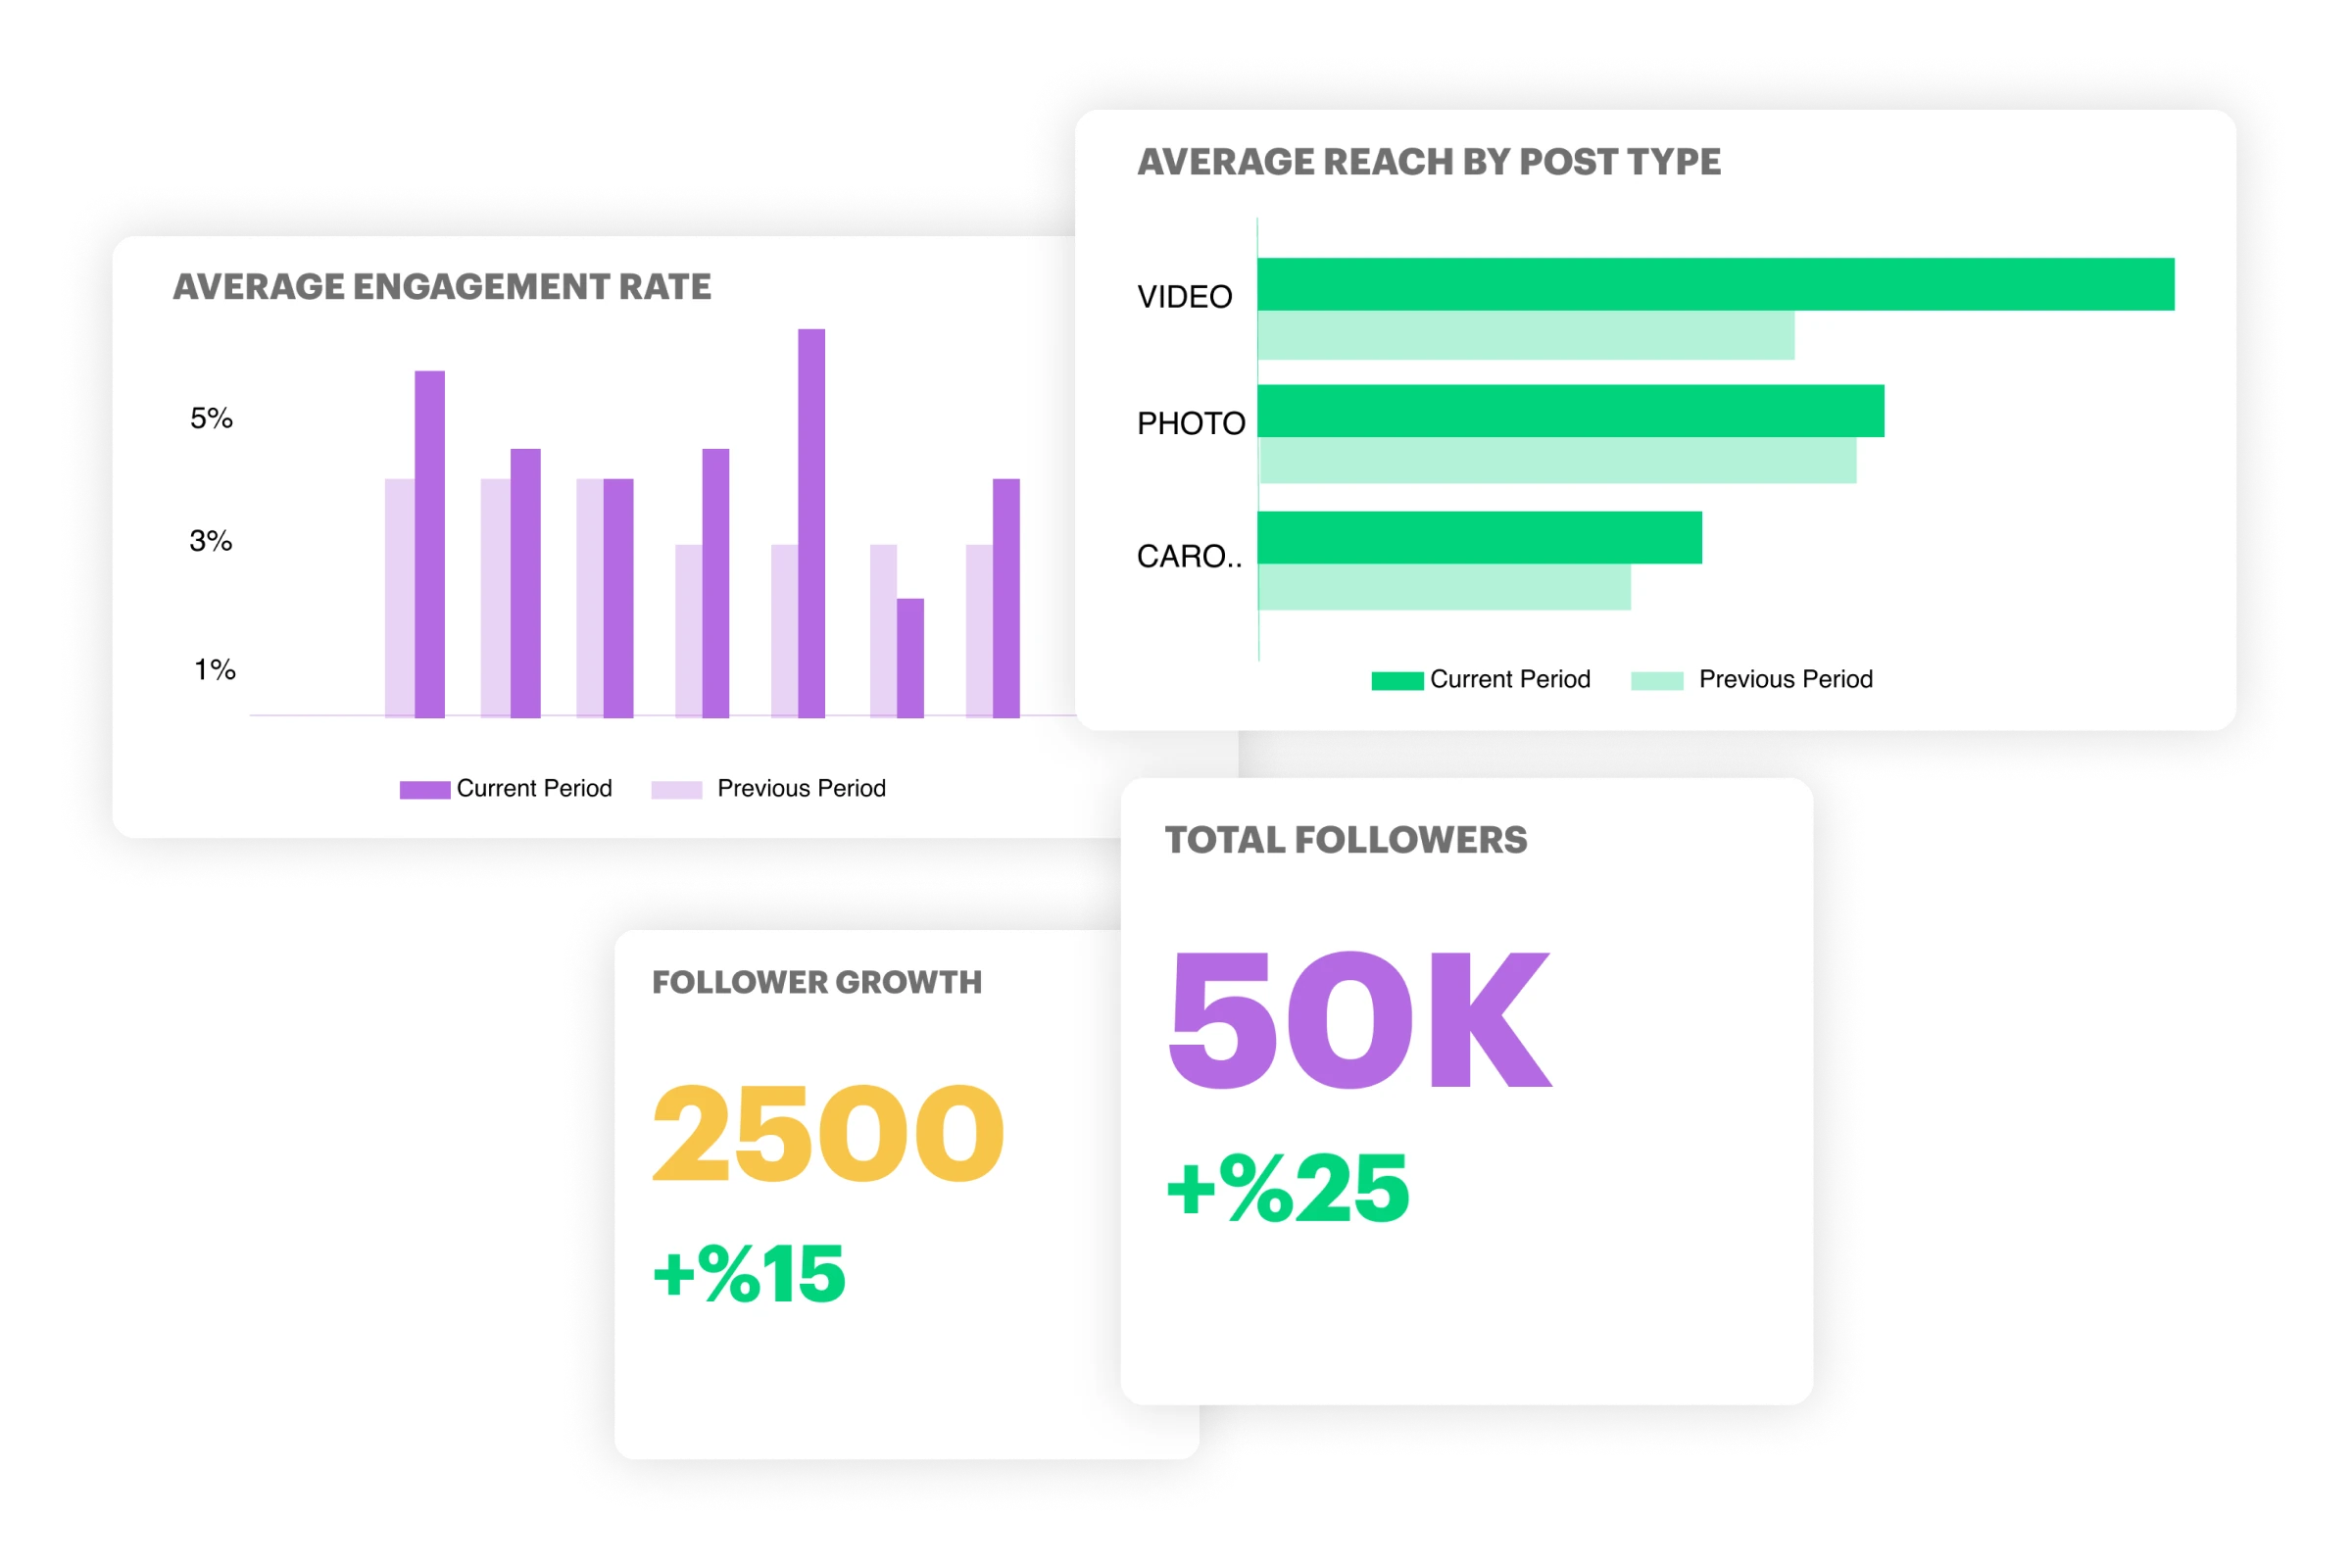
- Total Followers
- Follower Growth
- Engagement Rate
- Impressions
- Reach
- Total Posts
- Story Reach
- Interactions
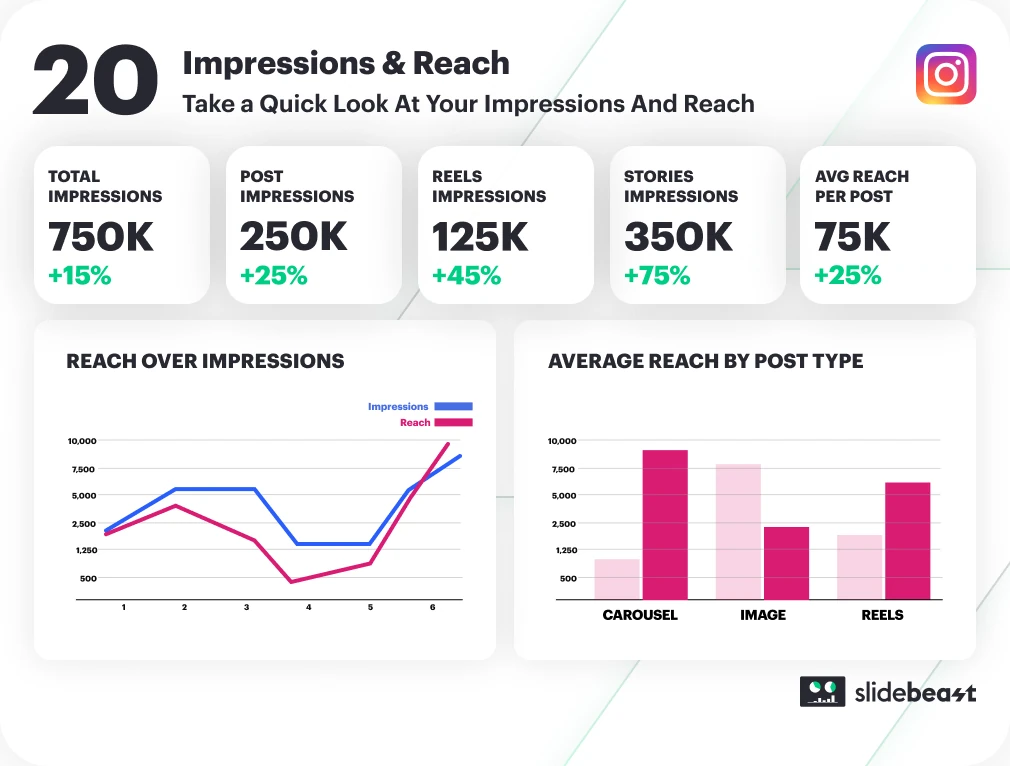
Understanding Impressions & Reach
- Total Impressions
- Post Impressions
- Story Impressions
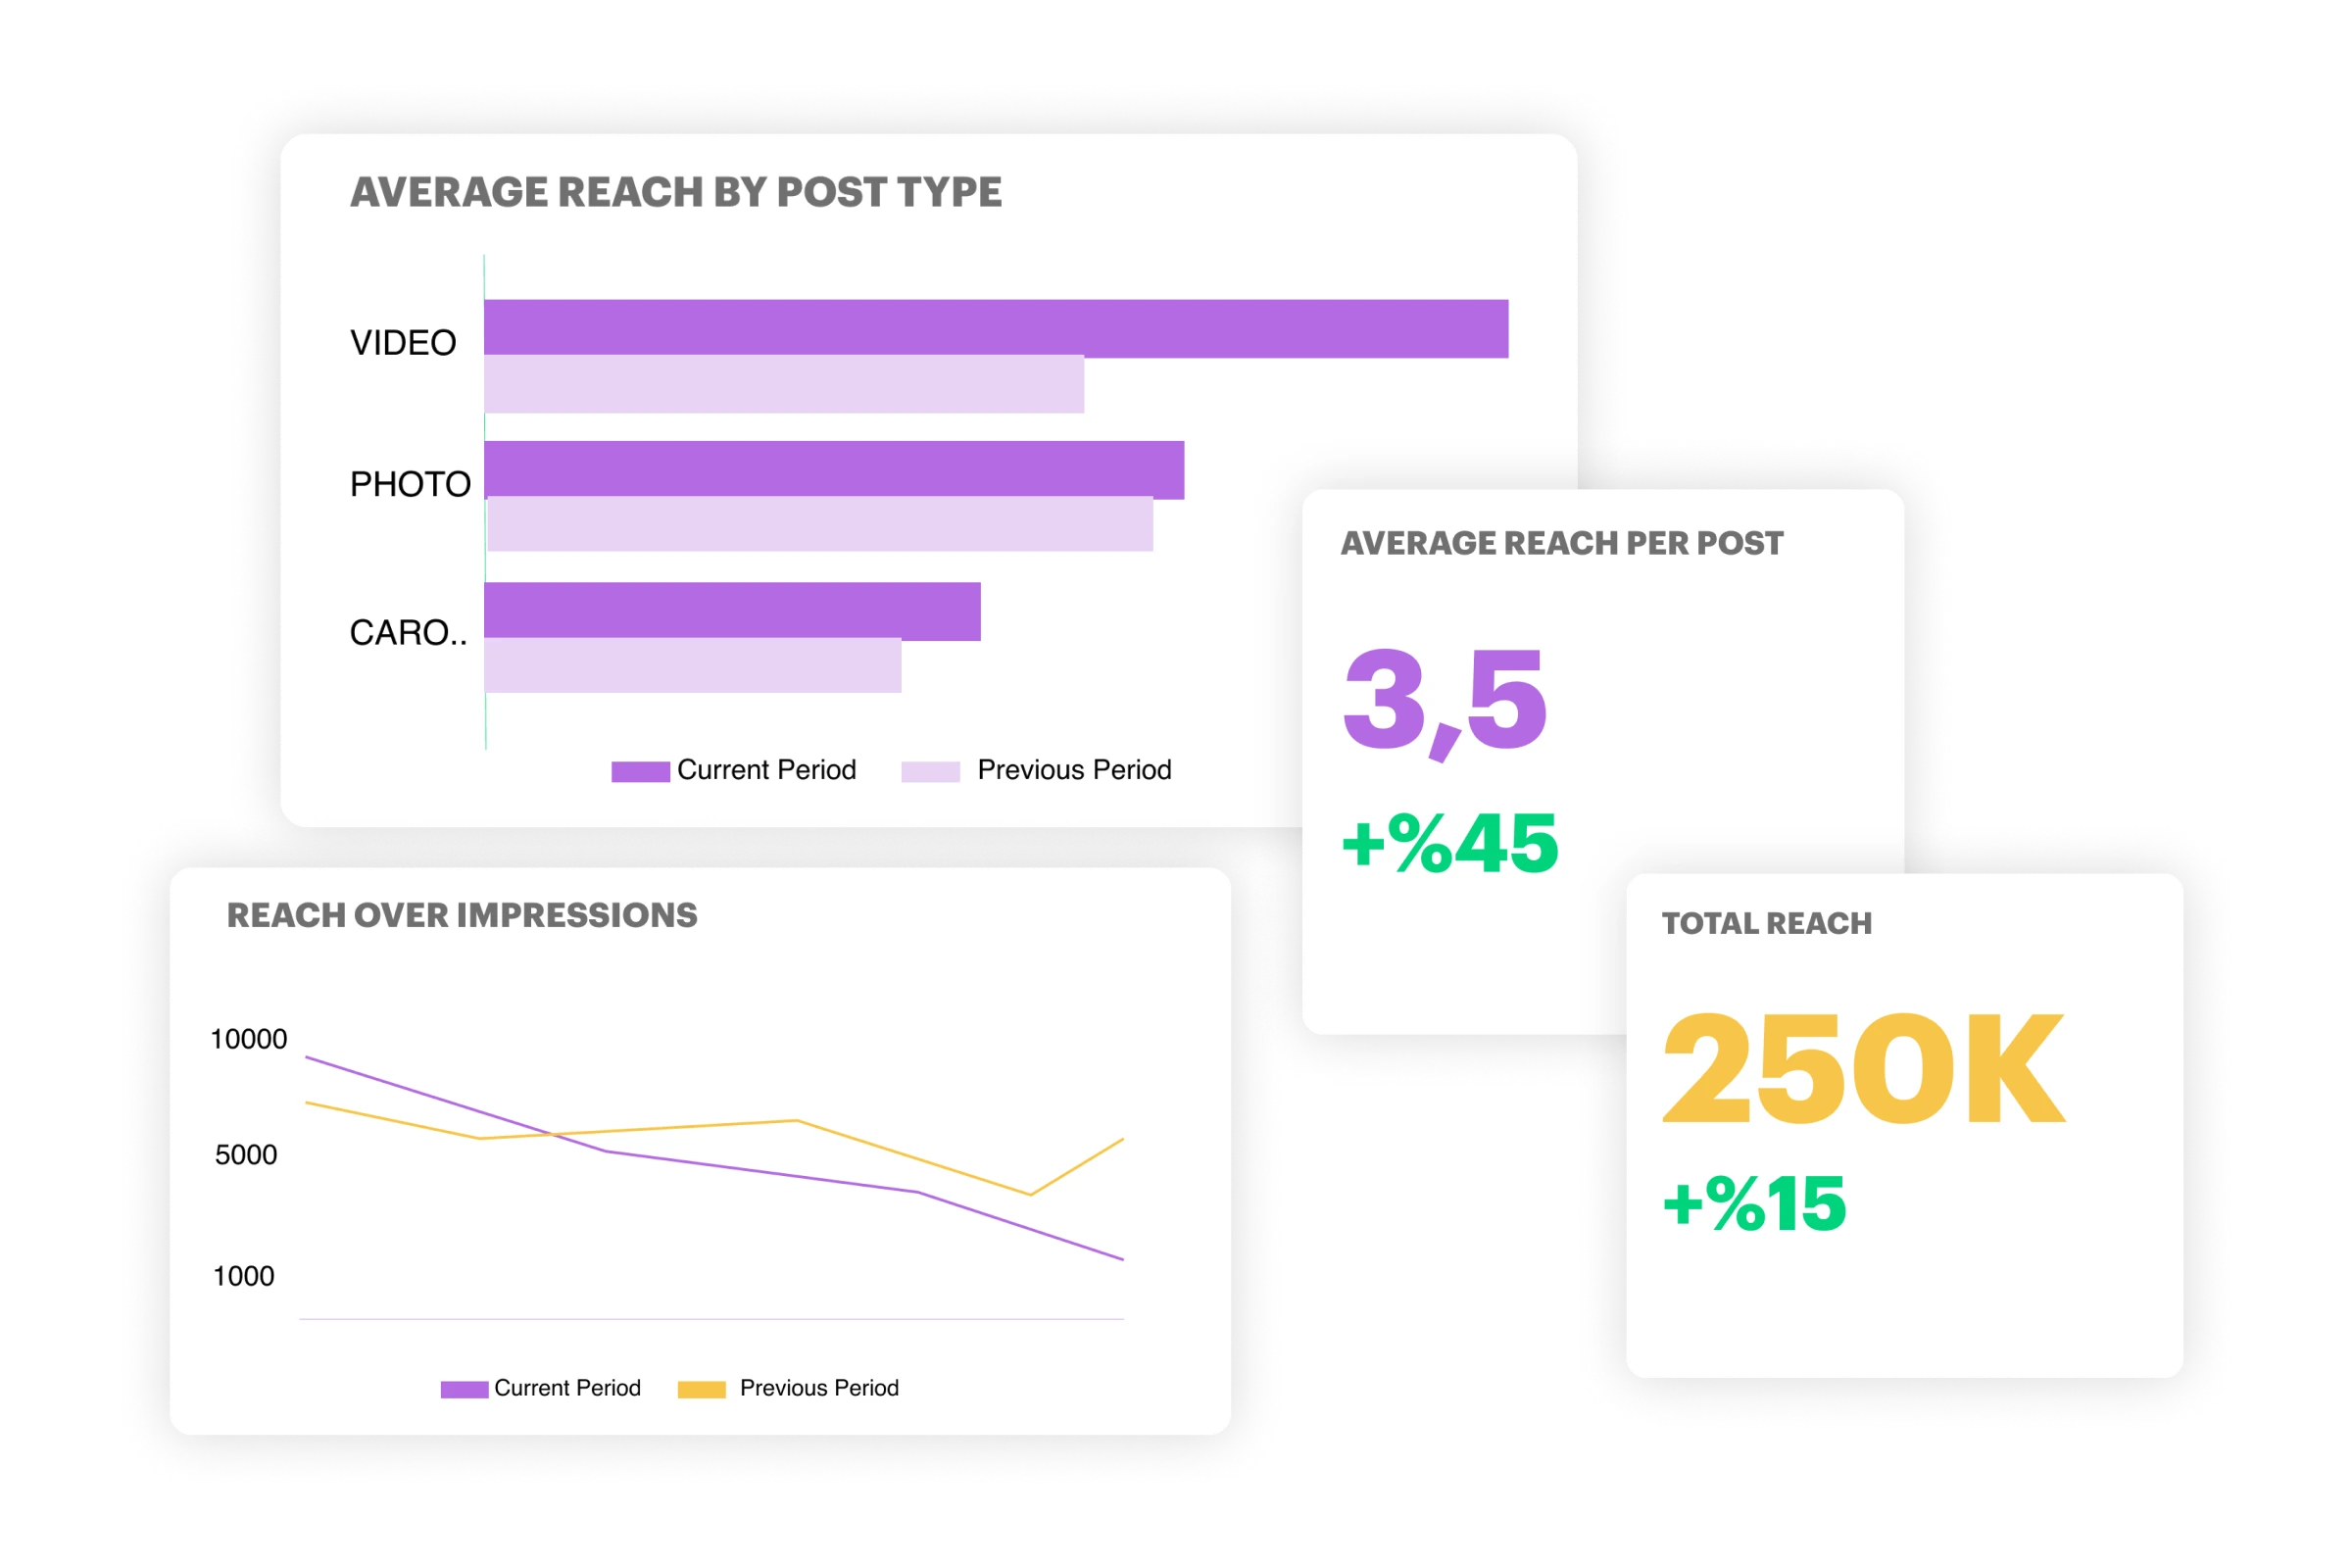
- Total Reach
- Avg. Reach by Post Type
- Avg. Reach per Post
- Reach Over Impressions
Overview of User Interaction
- Avg. Engagement Rate
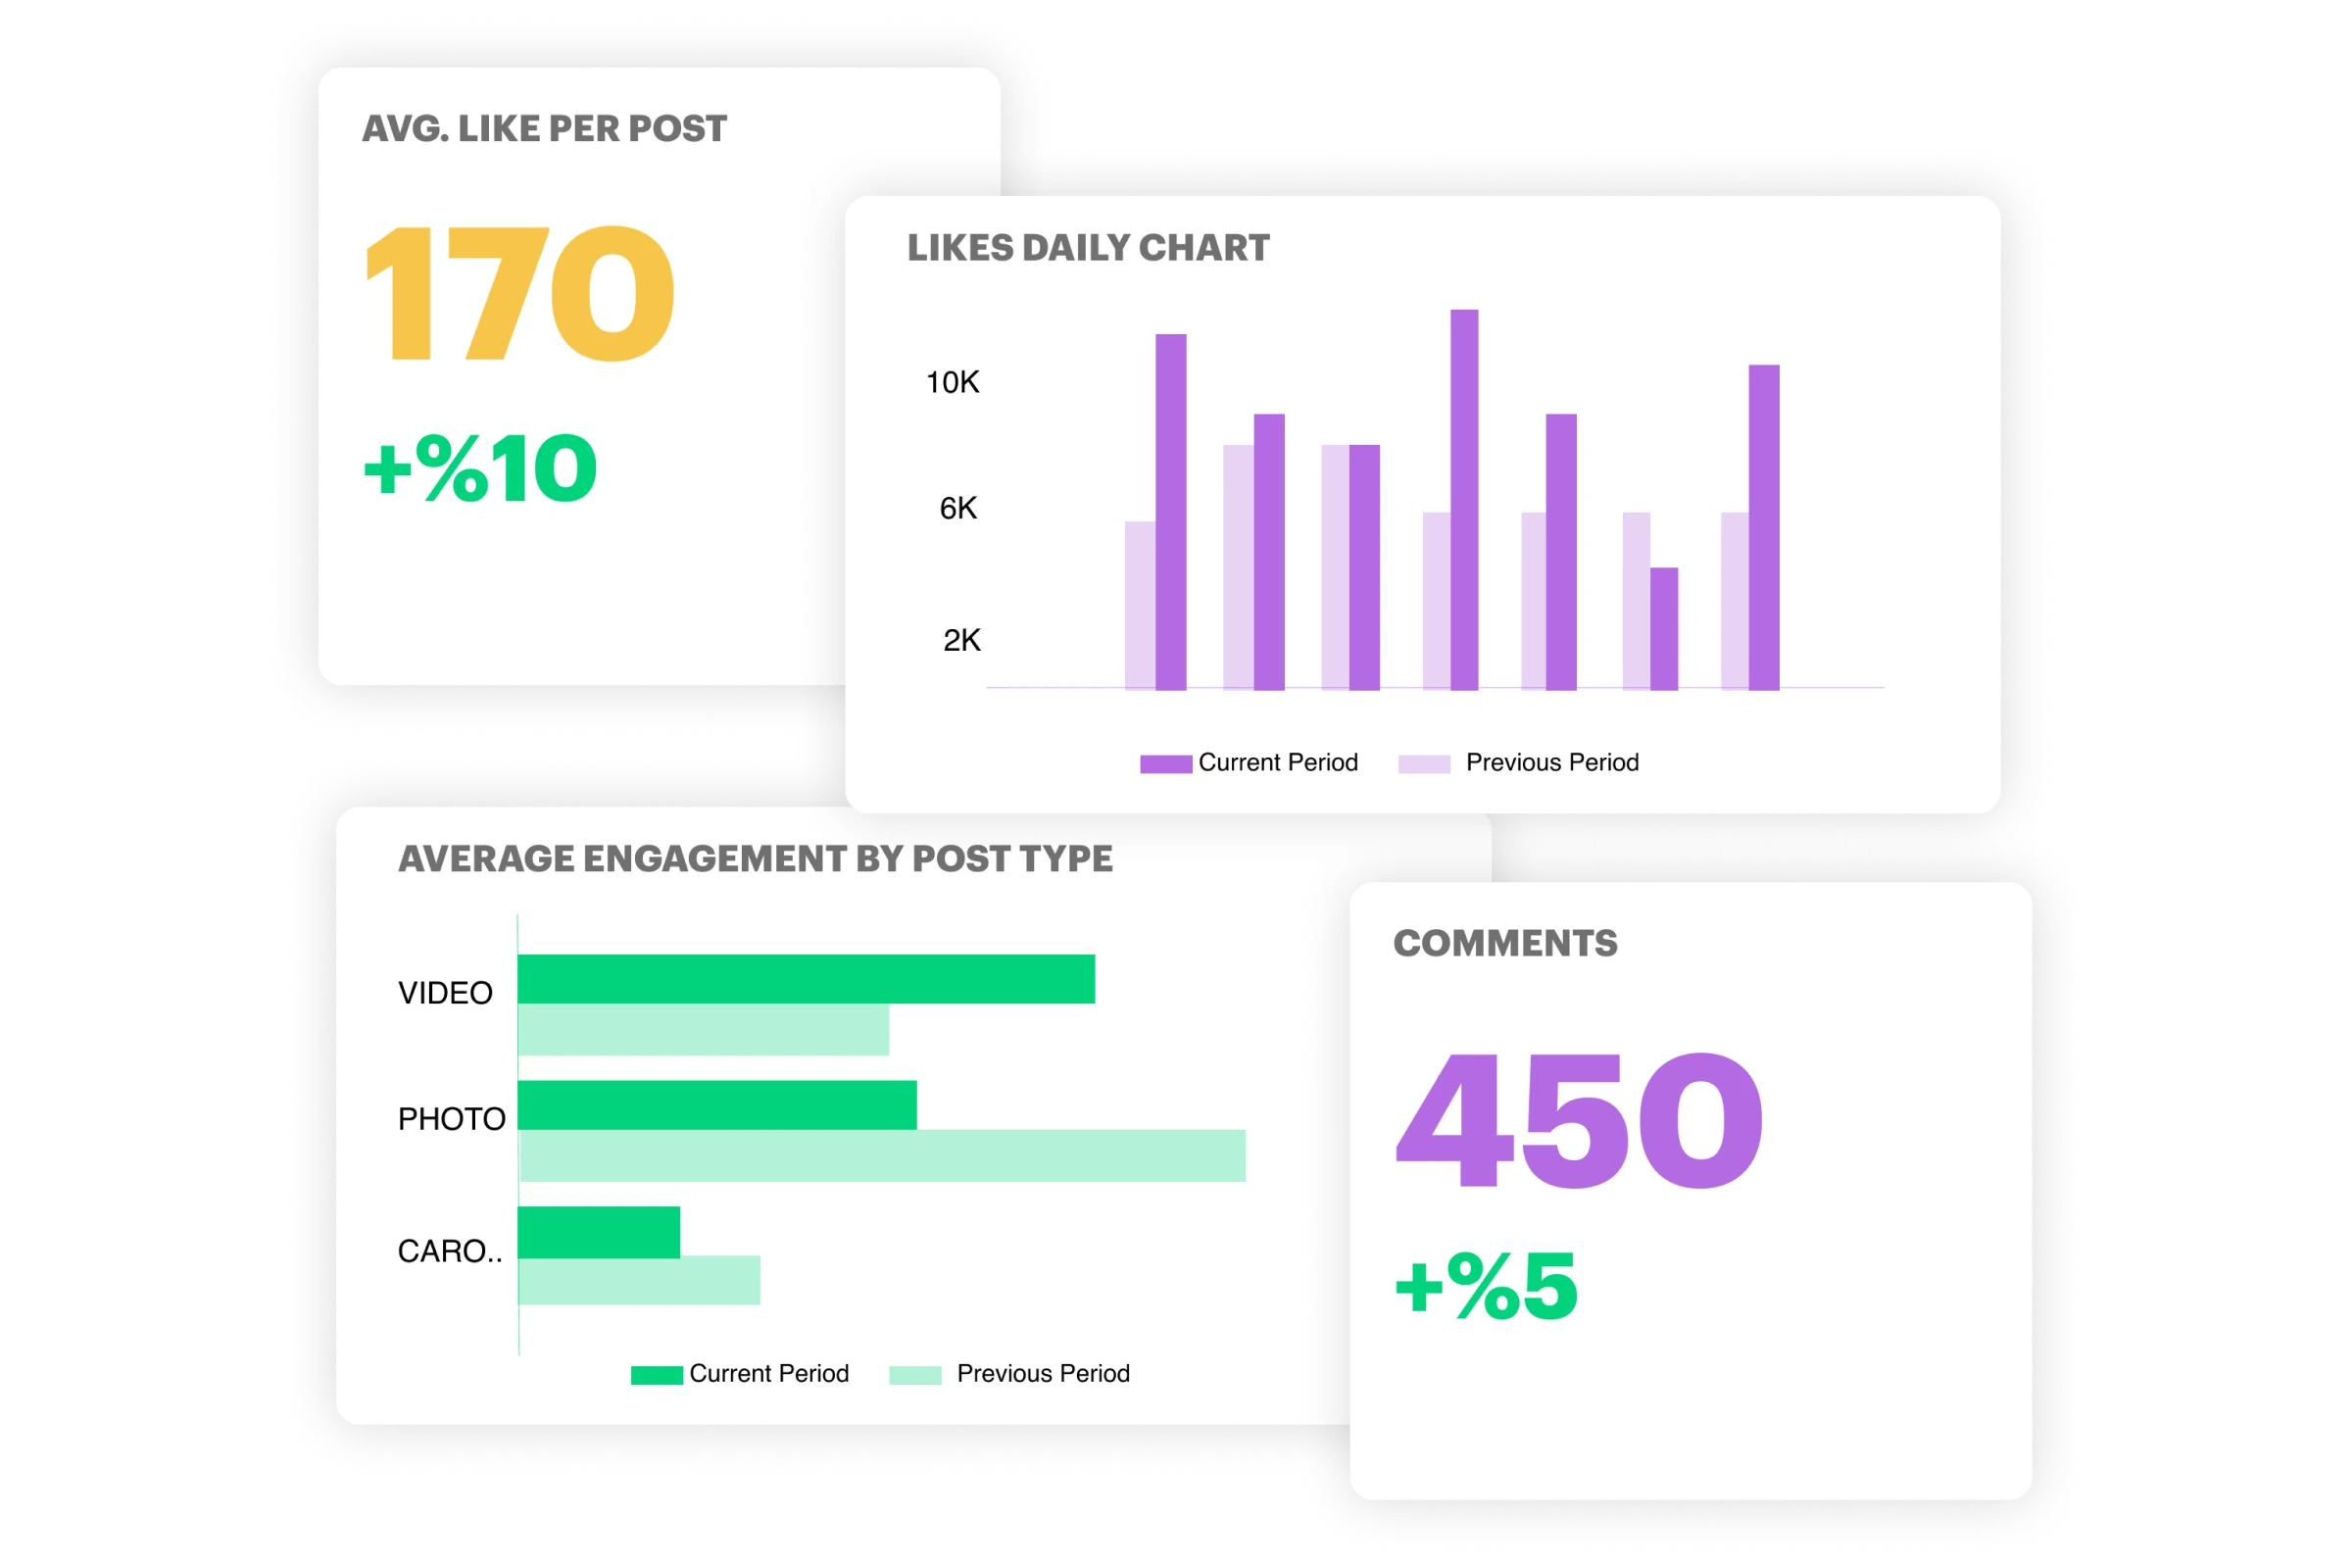
- Likes
- Avg. Like Per Post
- Comments
- Videos
- Avg. Video Views
- Post Saves
- Avg. Post Saves
Grasping Story Performance
- Number of Stories
- Story Impressions
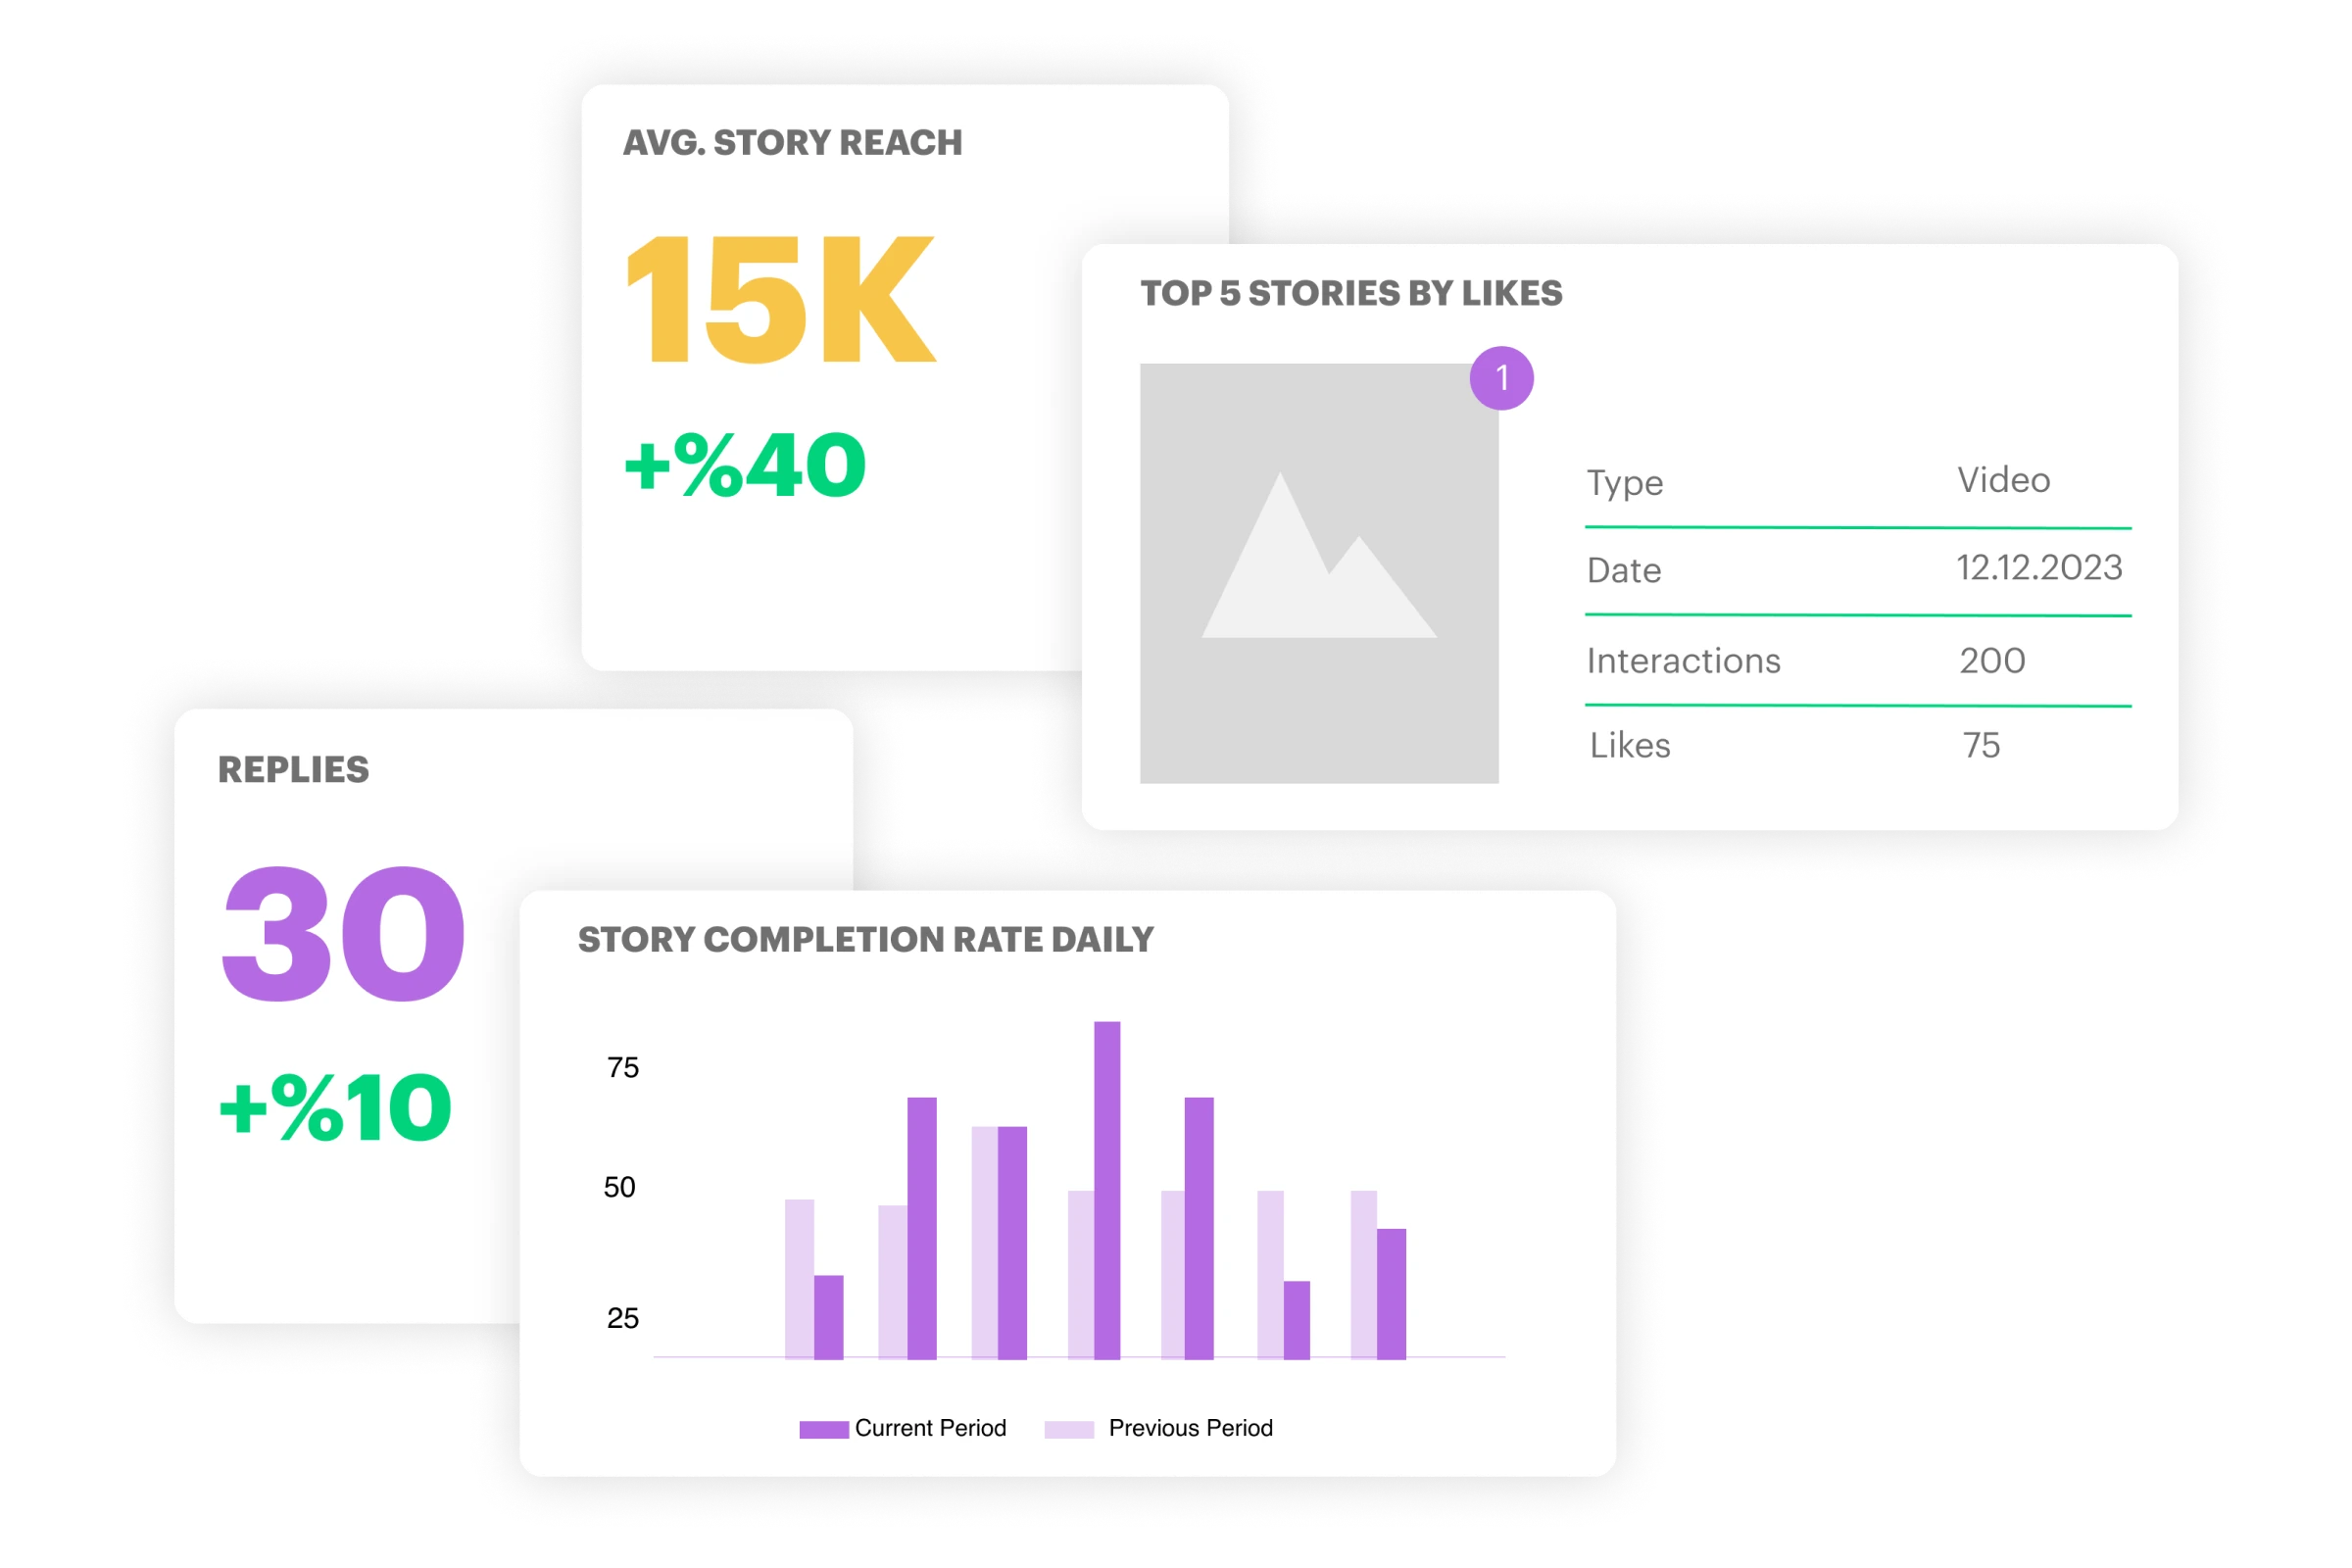
- Completion Rate
- Exits
- Replies
- Avg. Story Reach
- Top 5 Stories by Impressions
- Top 5 Stories by Reach
- Top 5 Stories by Completion Rate
- Top 5 Stories by Replies
- Top 5 Stories by Exits
- Top 5 Stories by Taps Back/Forward
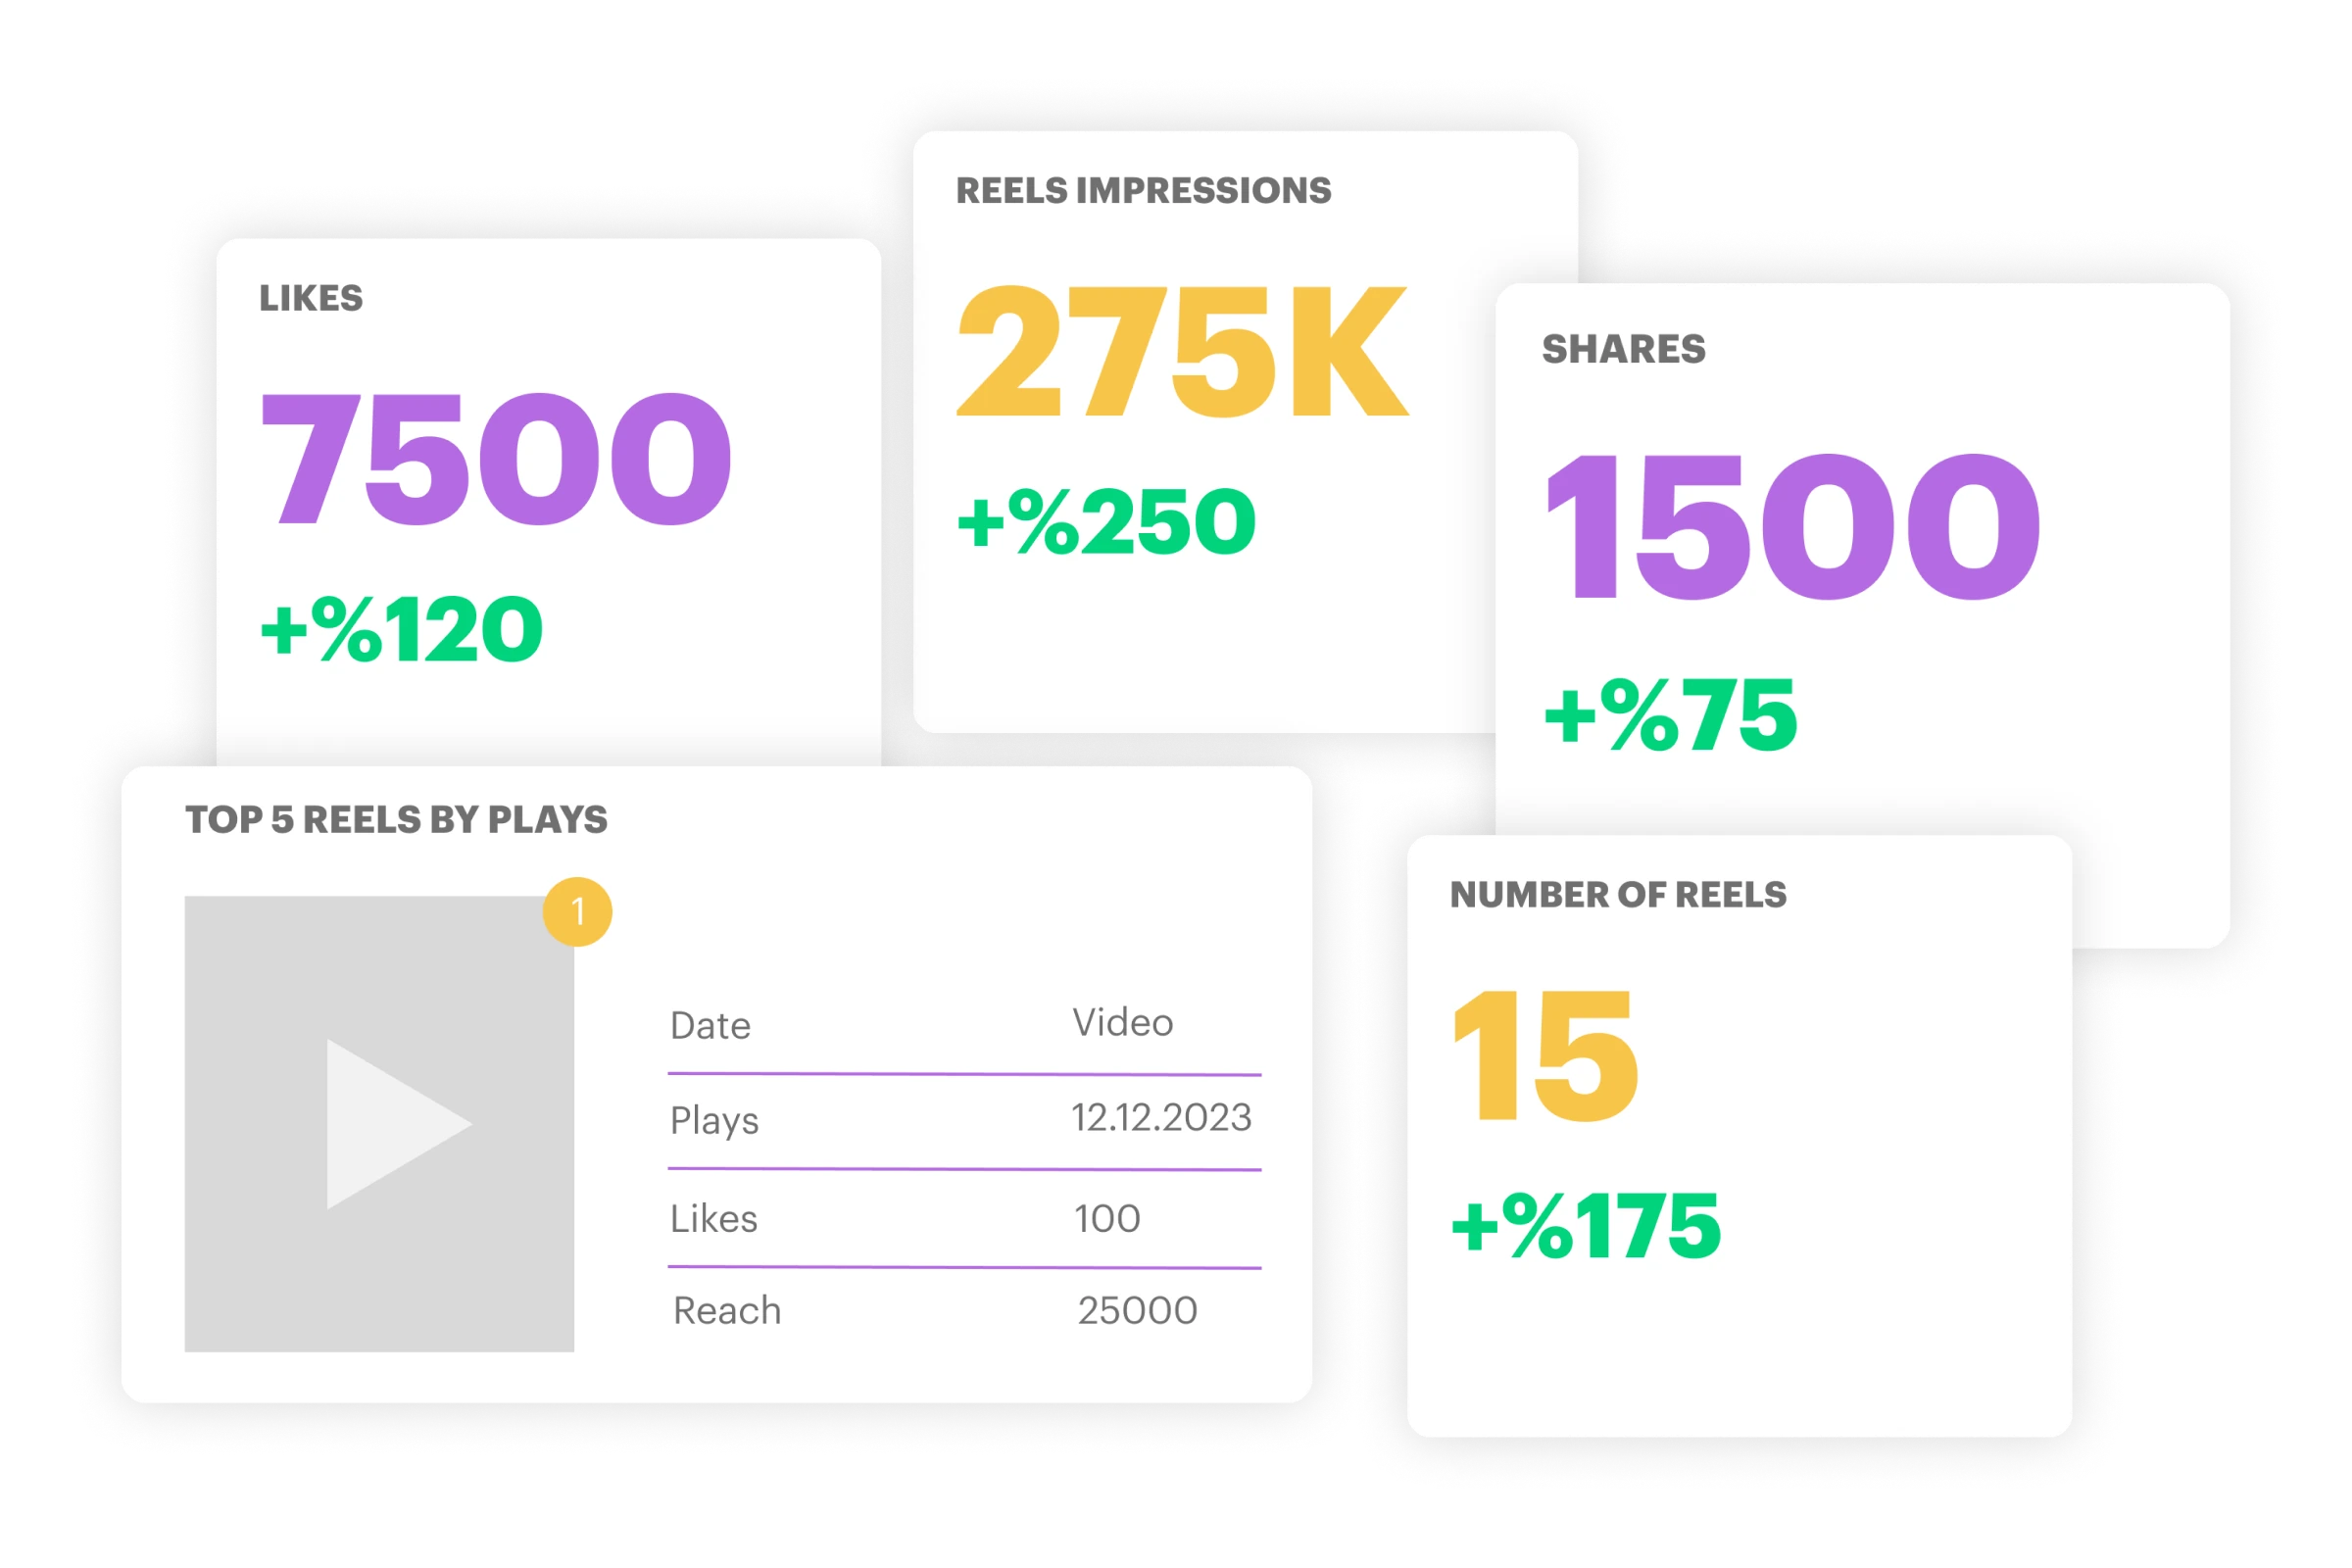
Insights into Reel Impact
- Number of Reels
- Number of Times Played
- Reels Reach
- Total Interactions
- Avg. Reels Reach
- Likes / Comments / Saves / Shares
- Top 5 Reels by Plays
- Top 5 Reels by Reach
- Top 5 Reels by Likes

Create Report Wizard will make everything super easy for you
Create Report Wizard, a tool designed to streamline the report process, helps our clients at every step of the report creating journey, ensuring a seamless and highly efficient experience
Tailor made reports

Tailor made reports
Get tailor made reports just for you or for your company. Get in touch with us to see how we can make your white label reporting needs possible.
Get in touch