LinkedIn Dashboard Report Template
About this Template
Featured Metrics
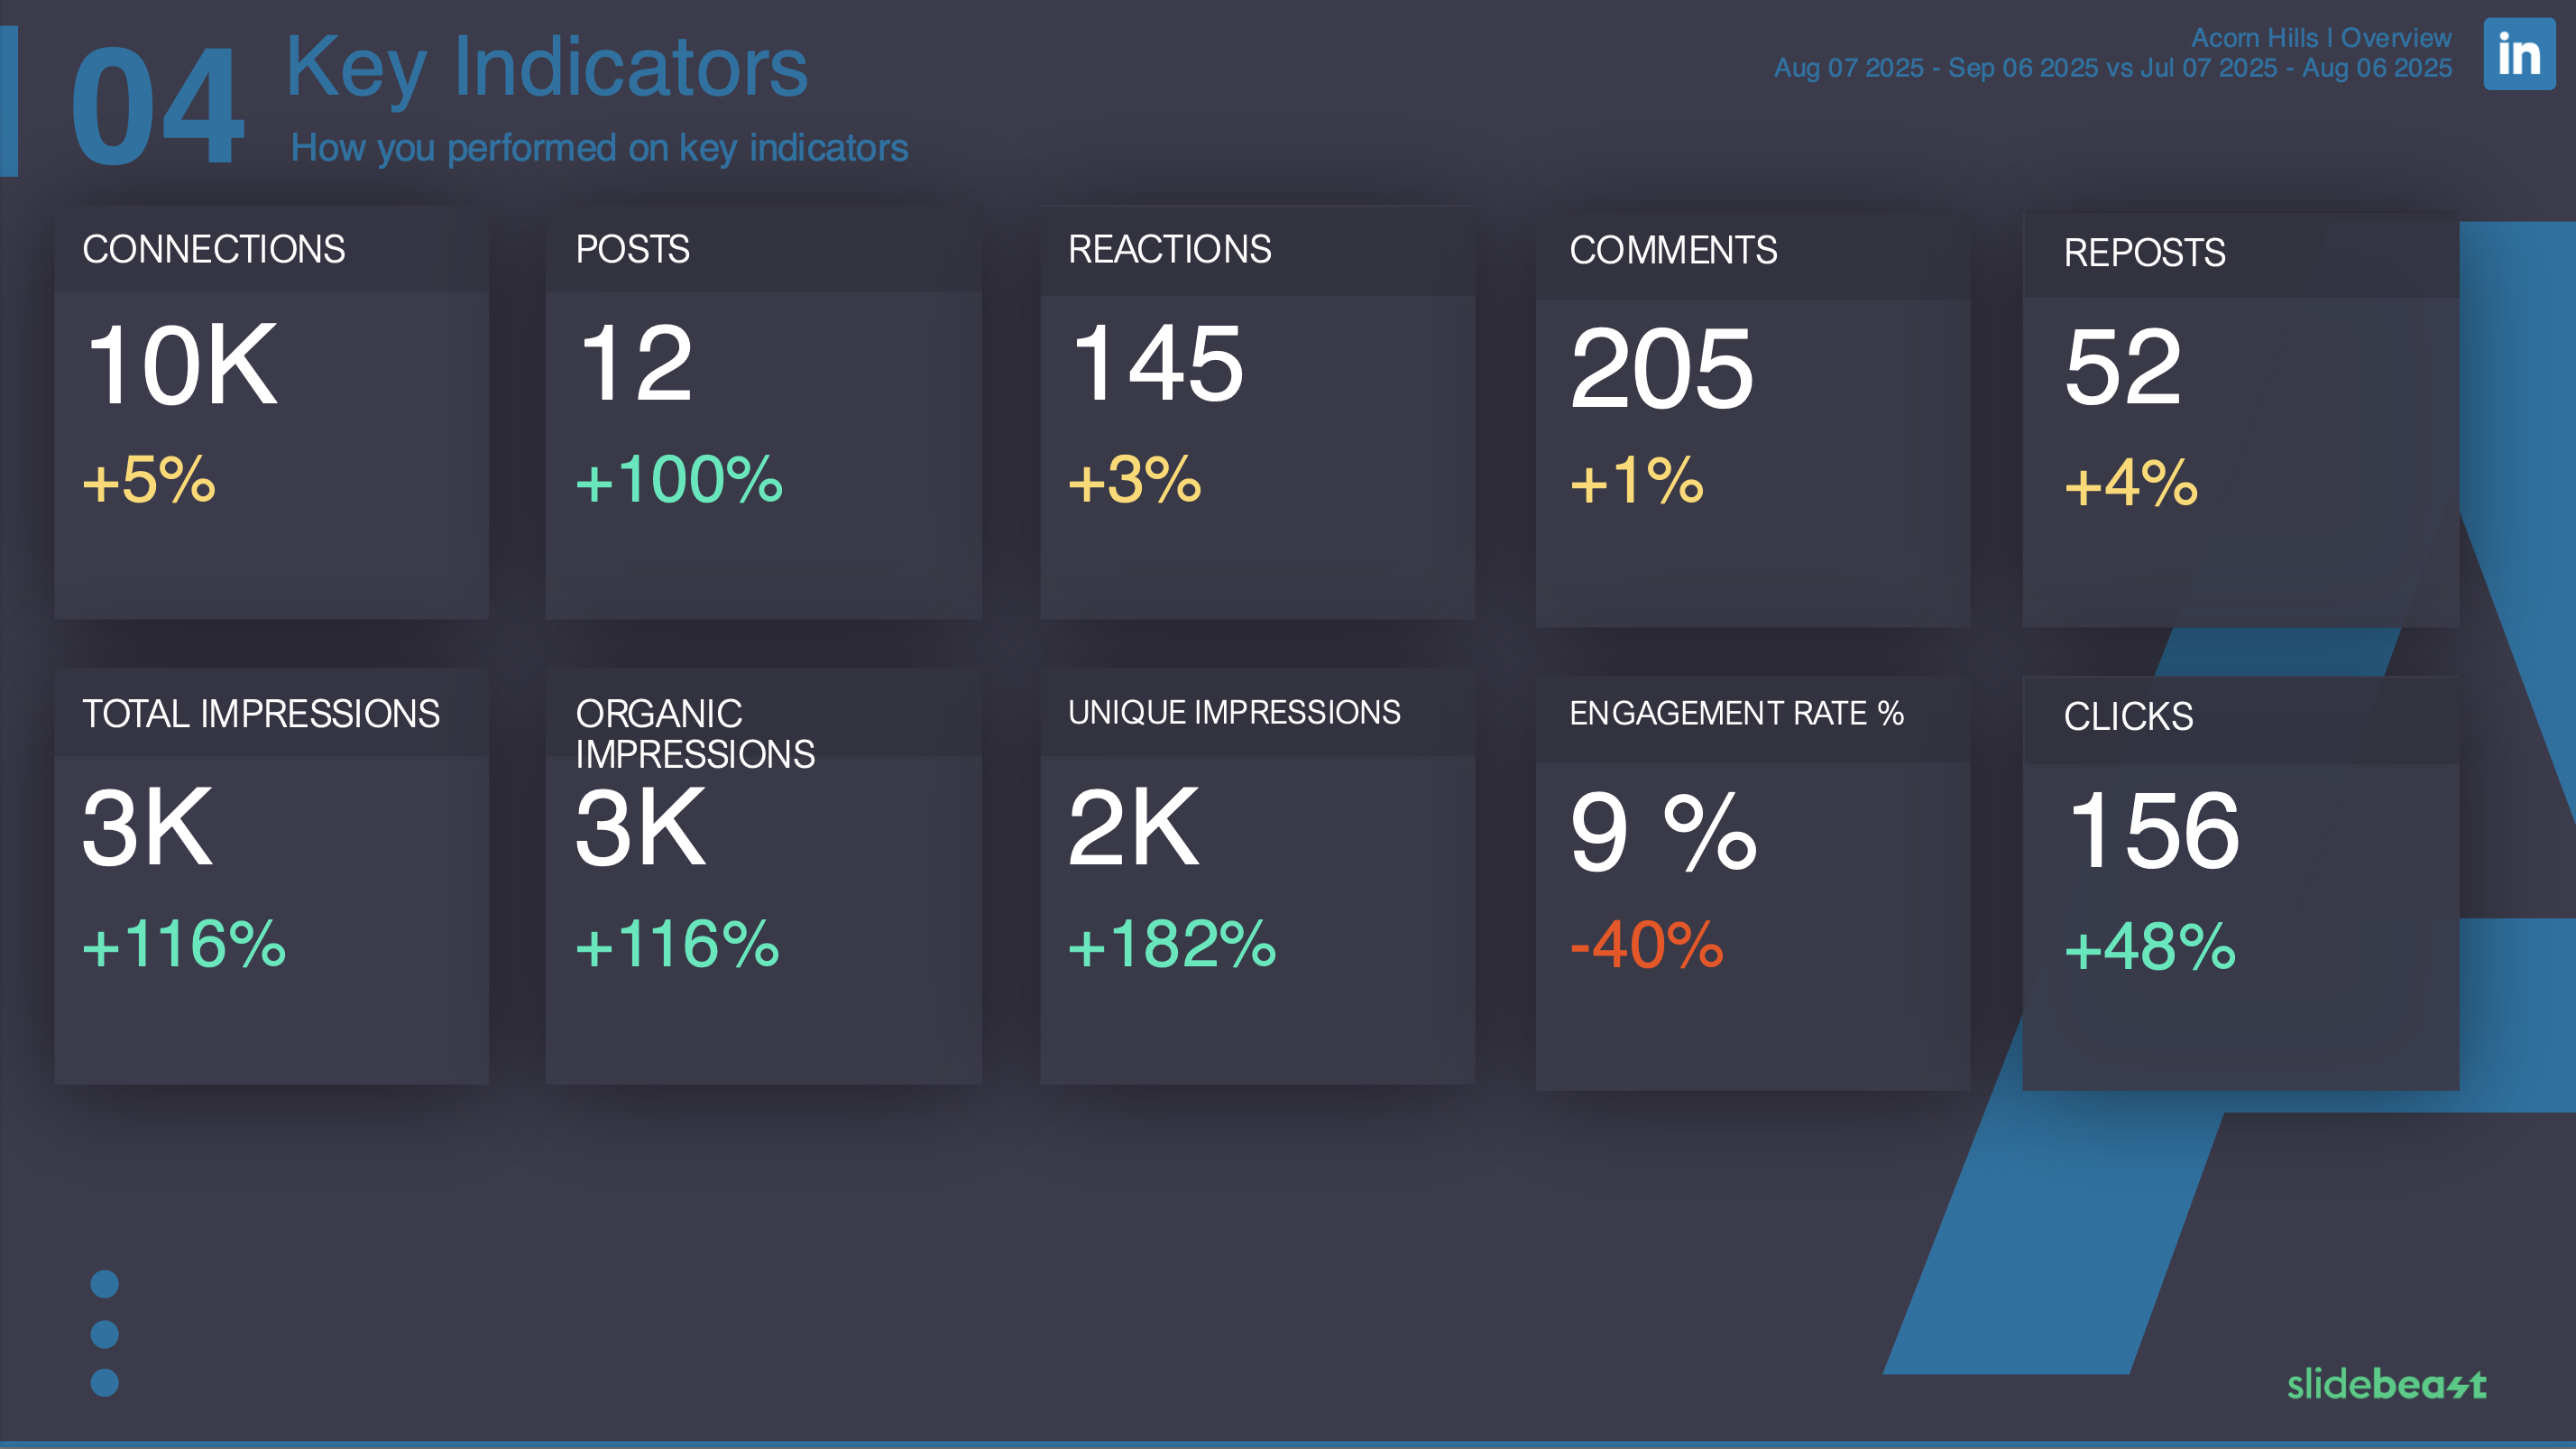
- Key Indicators
- Engagement Overview
- Impressions and Page Views
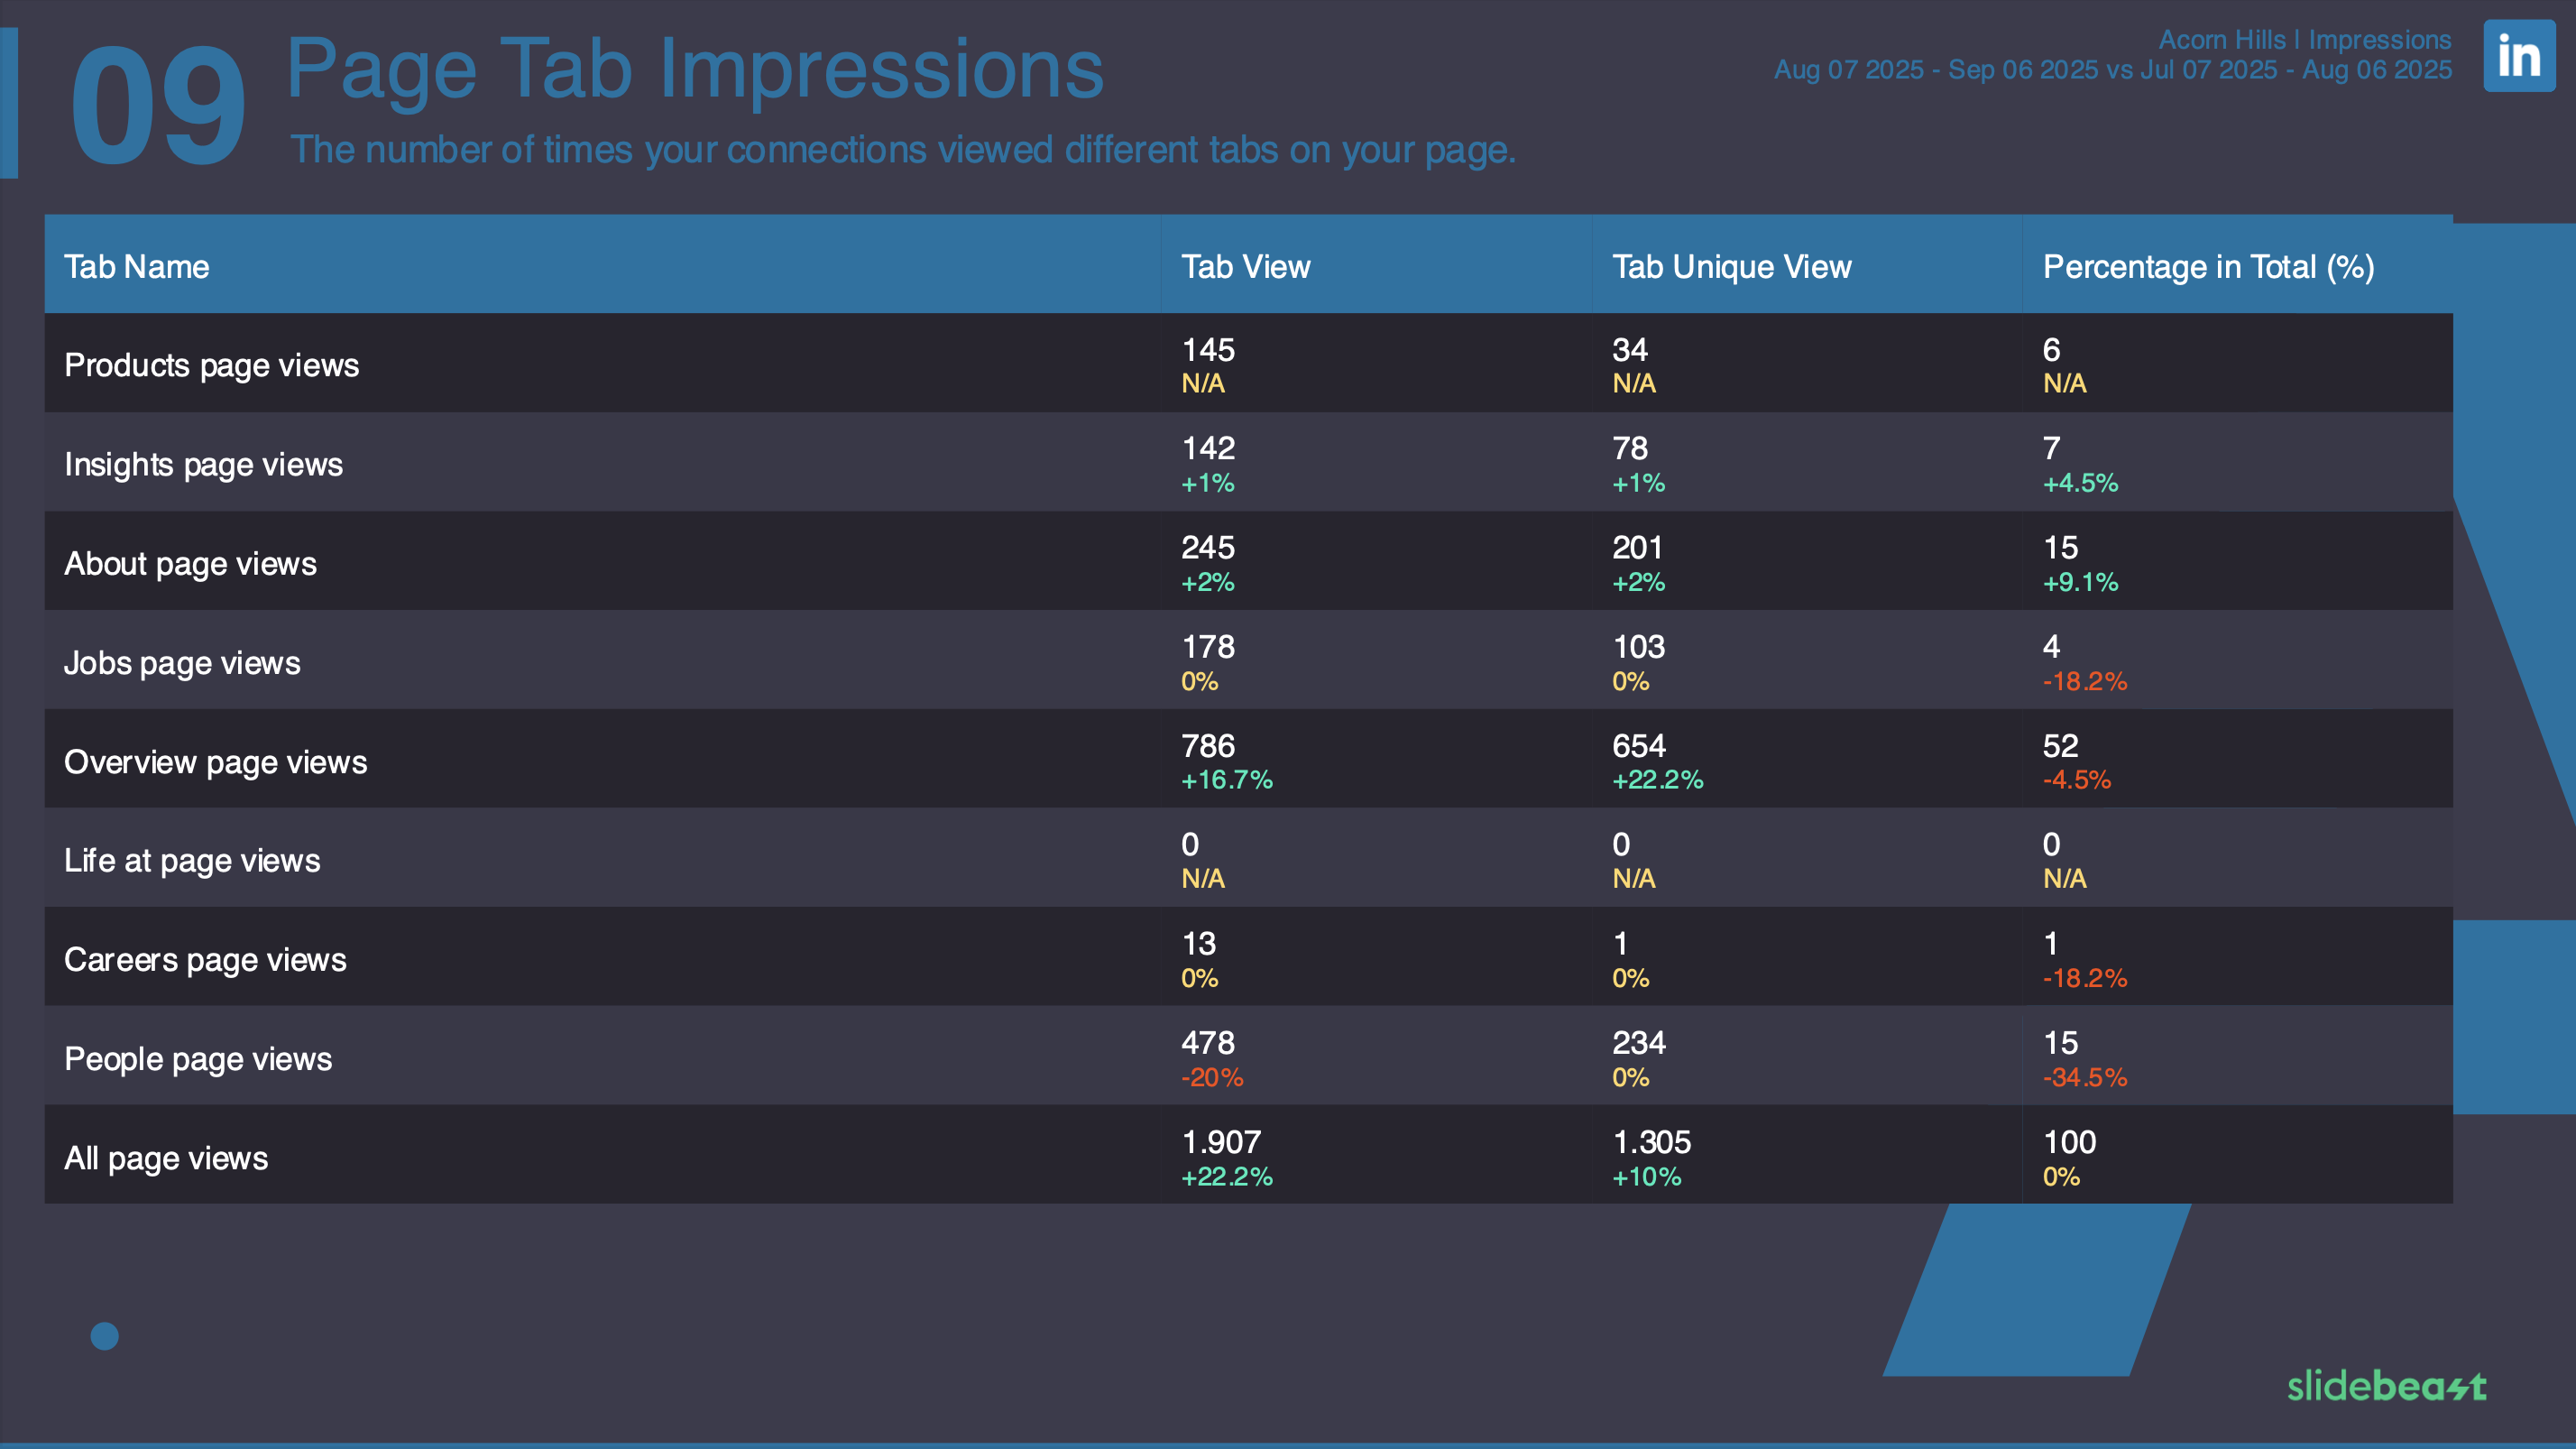
- Page Tab Impressions
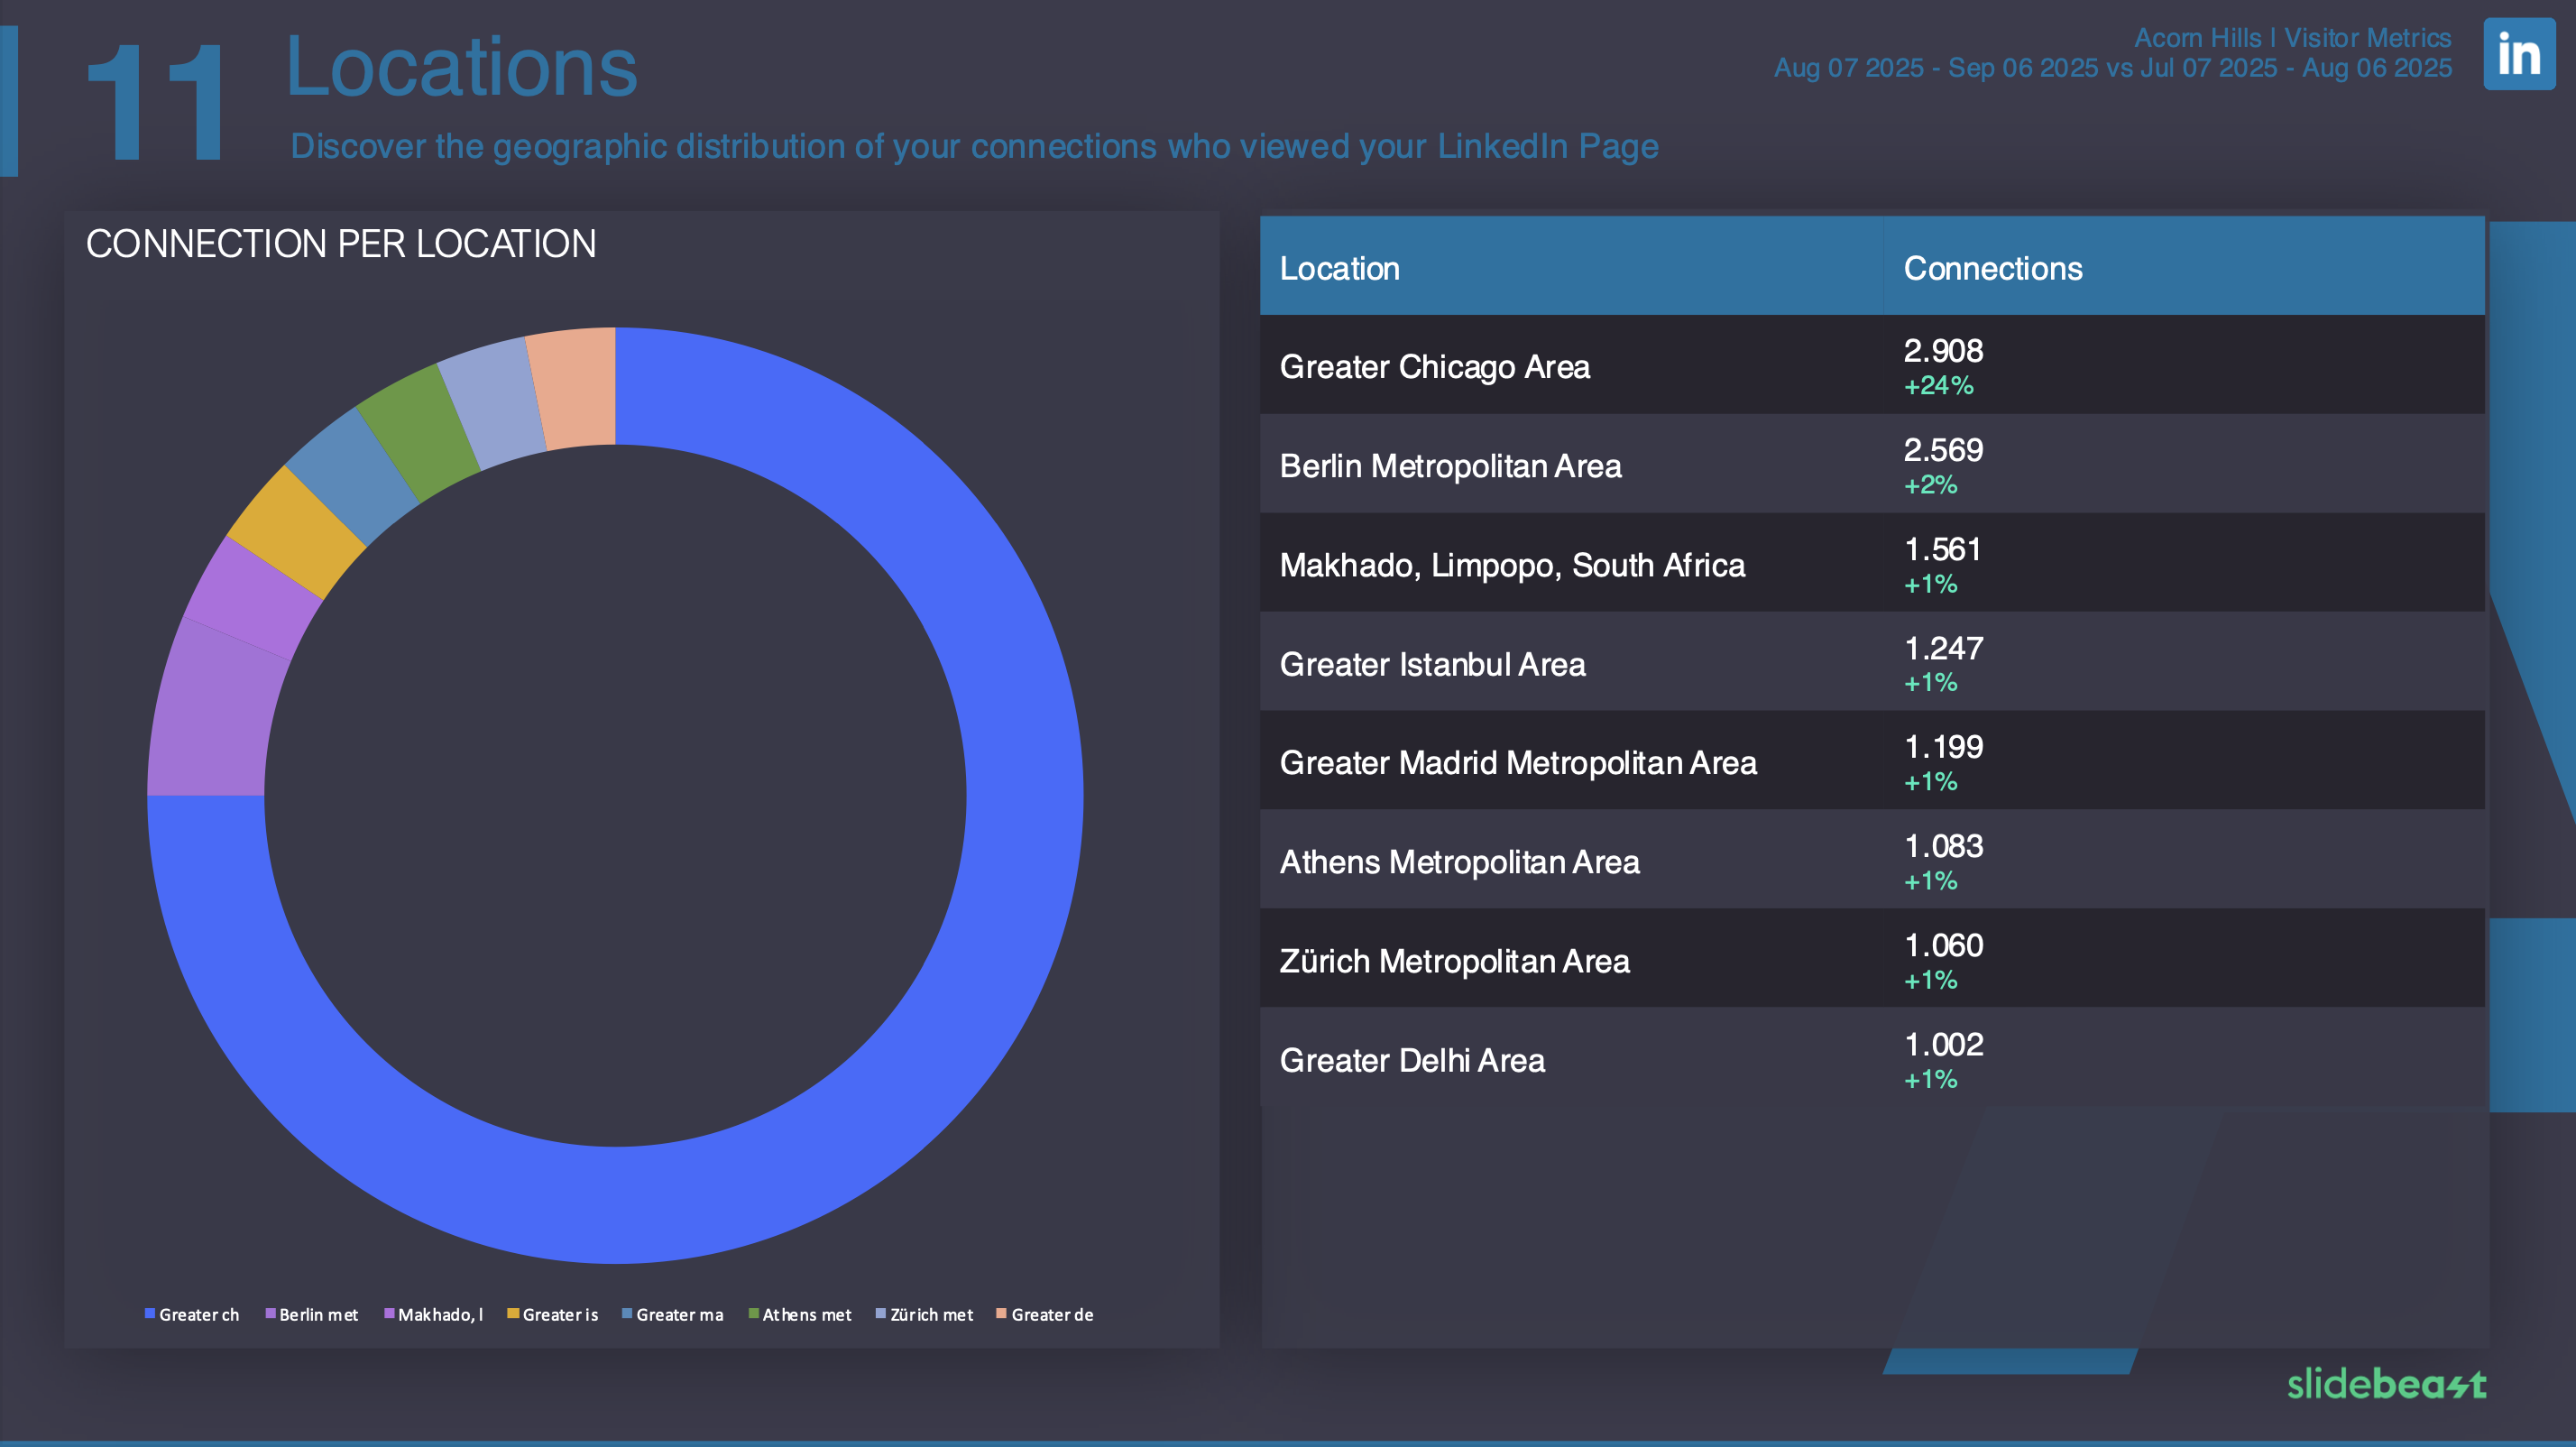
- Locations
- Seniority
Connected Sources

Sections:
What is Included in the LinkedIn Dashboard Report Template?
Slidebeast report templates are organized into sections, pre-structured with critical information essential for your business or client. We have meticulously included all necessary details to ensure no important information is overlooked.
Overview
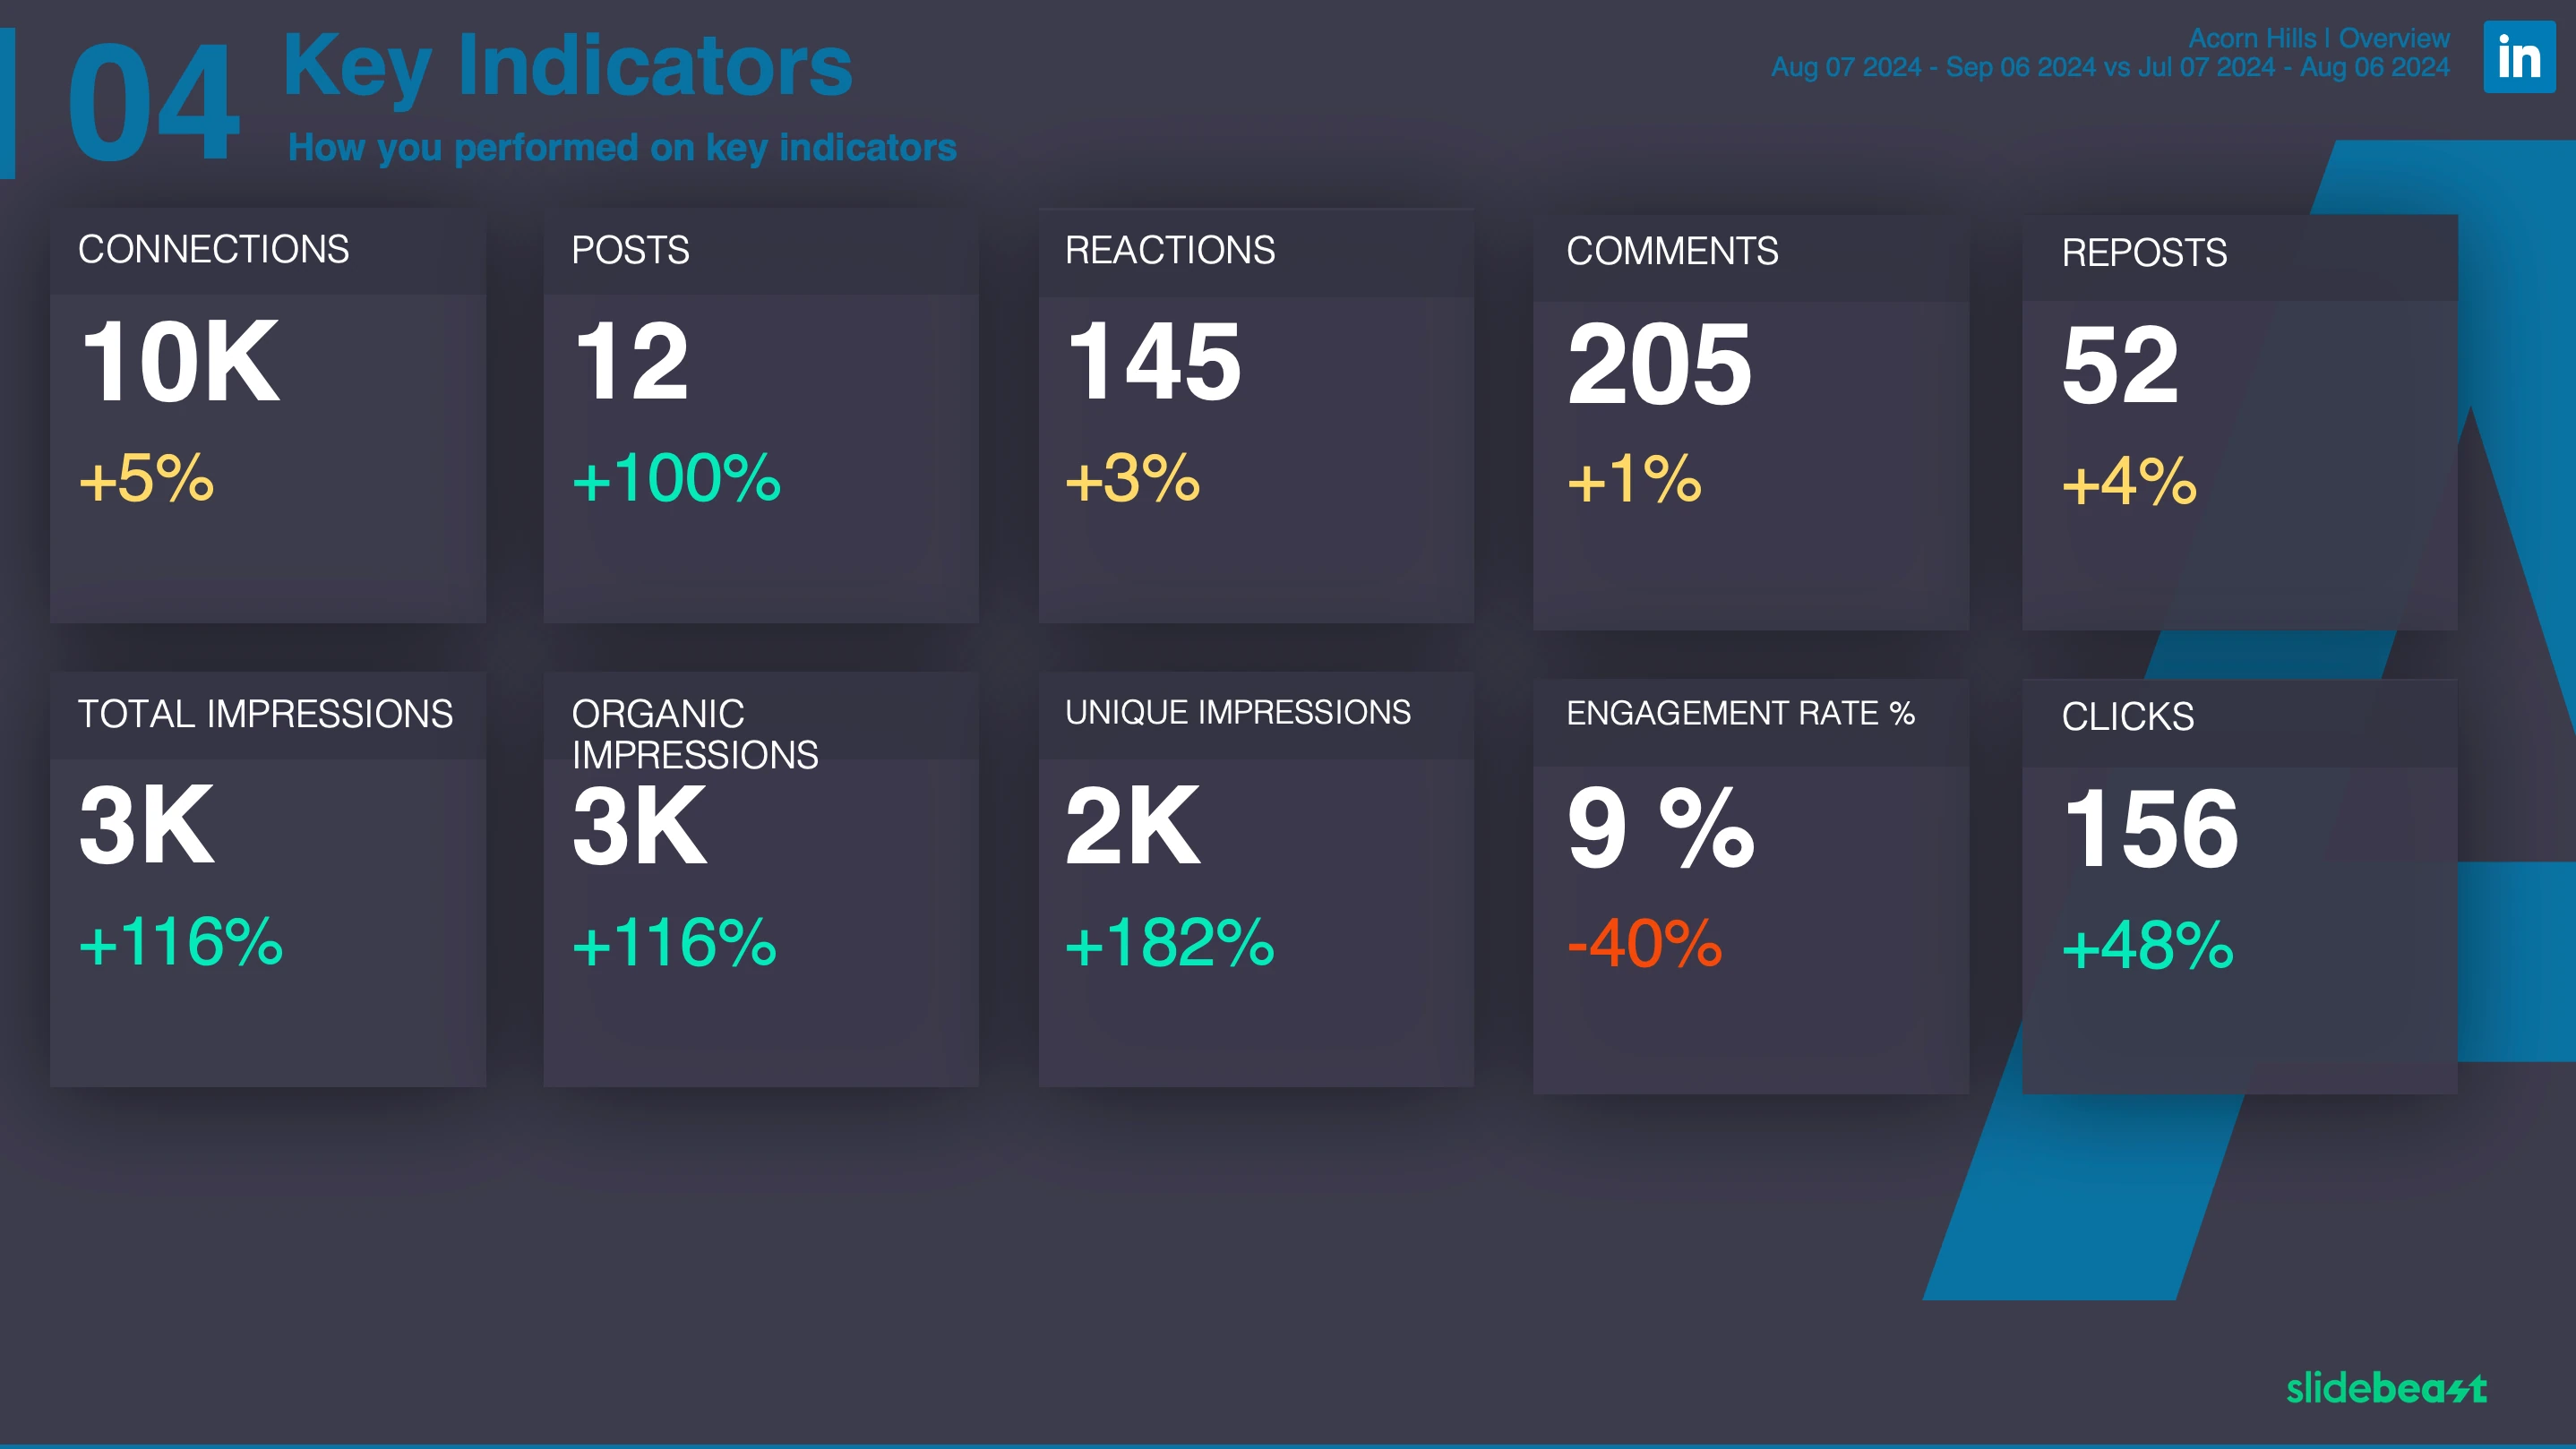
The first section of the LinkedIn report consists the main slide, Key Indicators. As the name suggests, it provides an overview of your LinkedIn activity, including key metrics such as total connections, impressions, posts and engagement trends over time.

Engagement
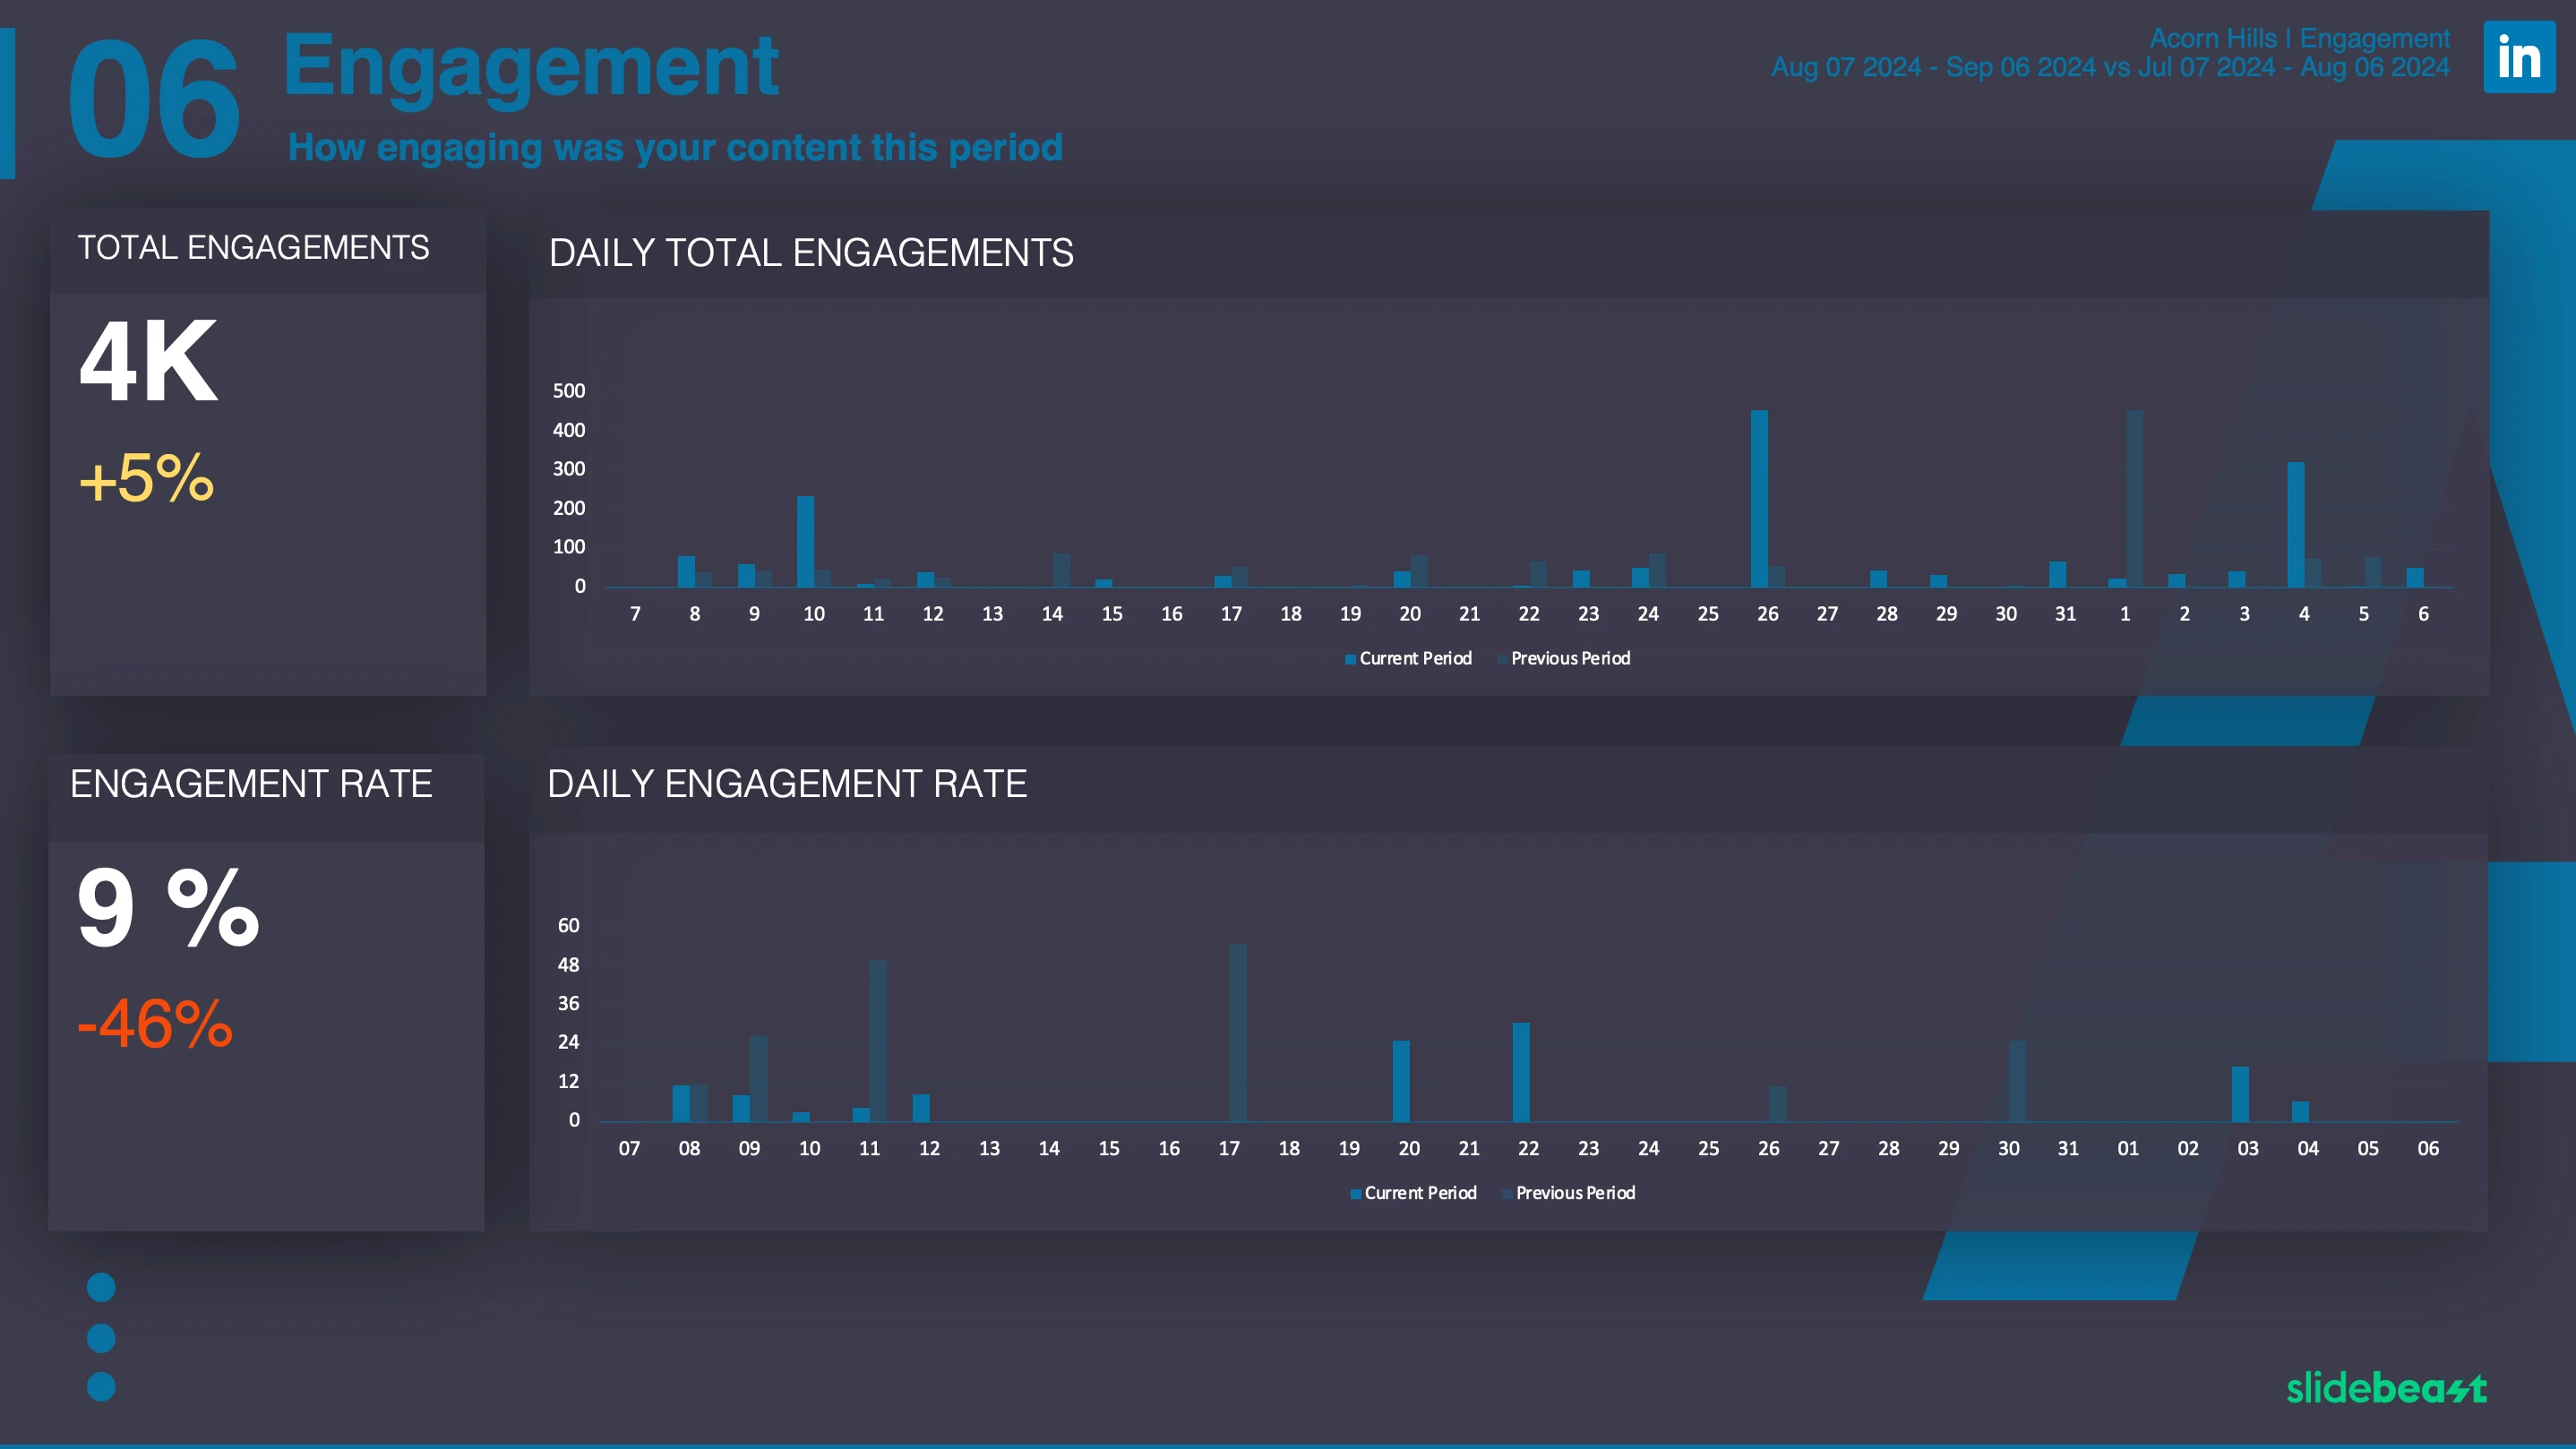
This section focuses on how users interacted with your posts. Across the slides, it covers key metrics such as likes, reposts, comments, reactions, allowing you to gauge the overall impact and resonance of your content.

Impressions
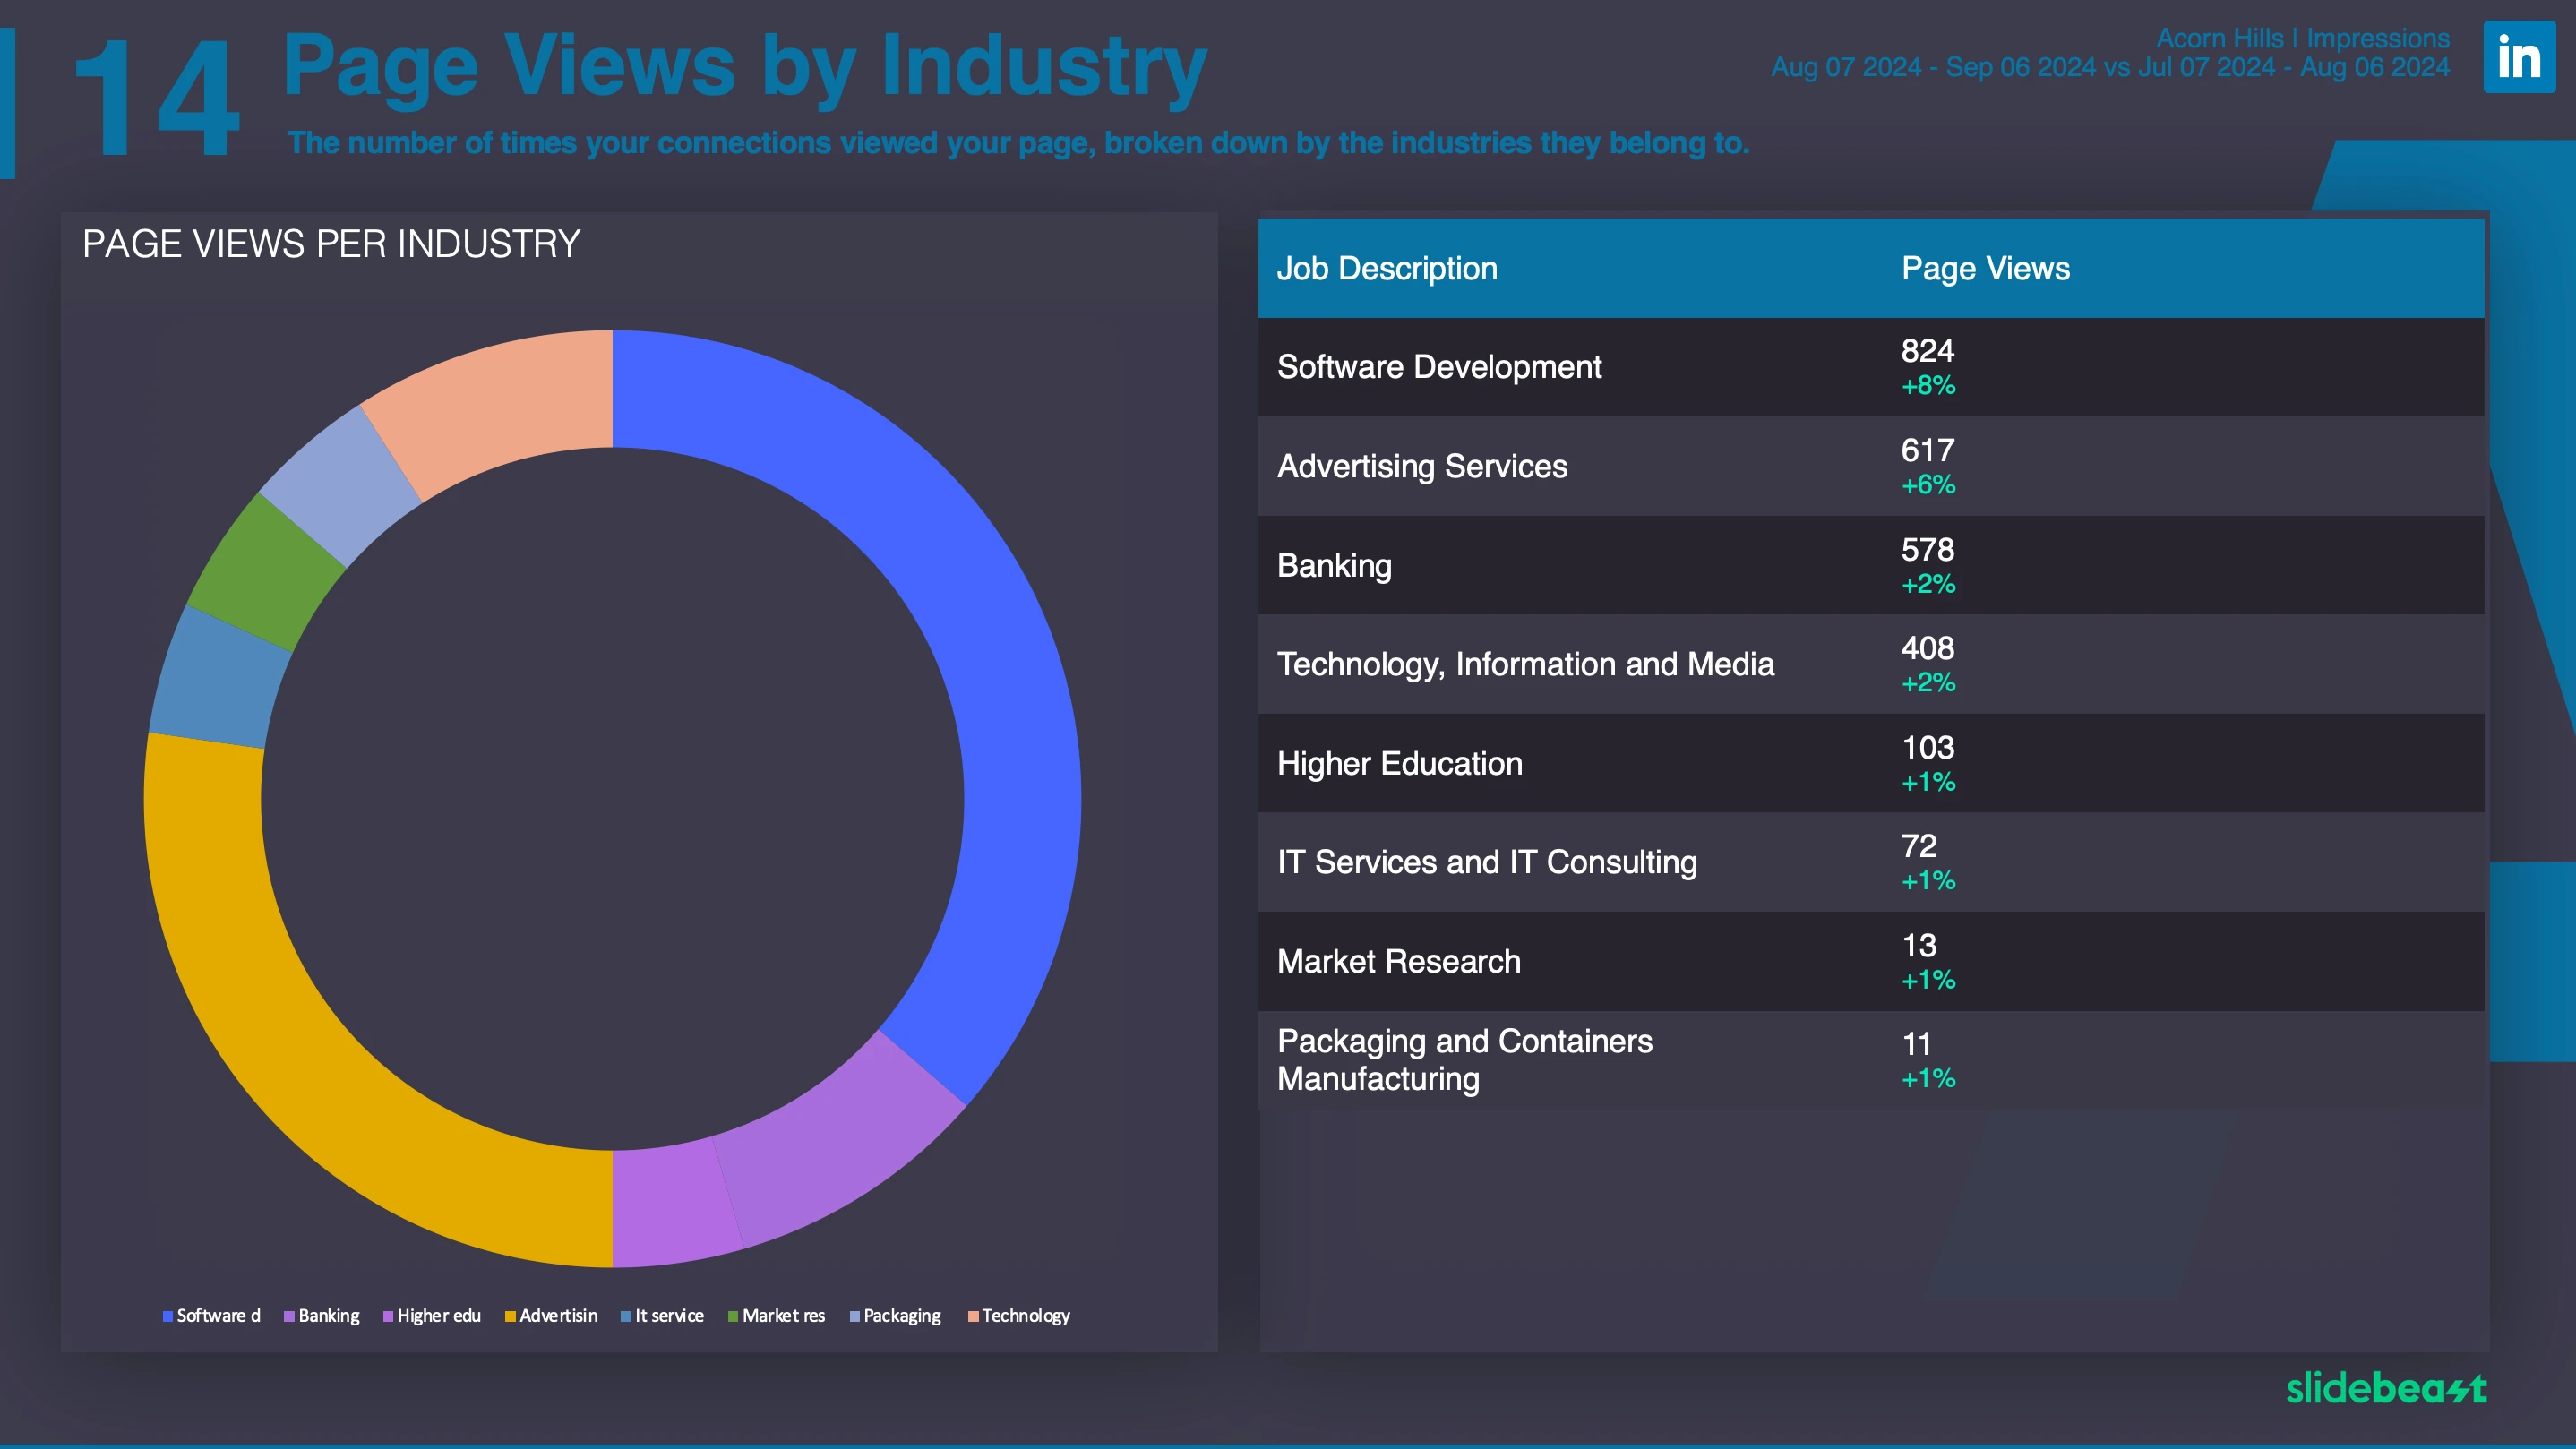
This section covers Impressions and Page Views across 7 slides, breaking down data by Page Tabs, Device, Country, Industry, Seniority, and Staff Count, providing a detailed view of how your content is seen.

Glossary
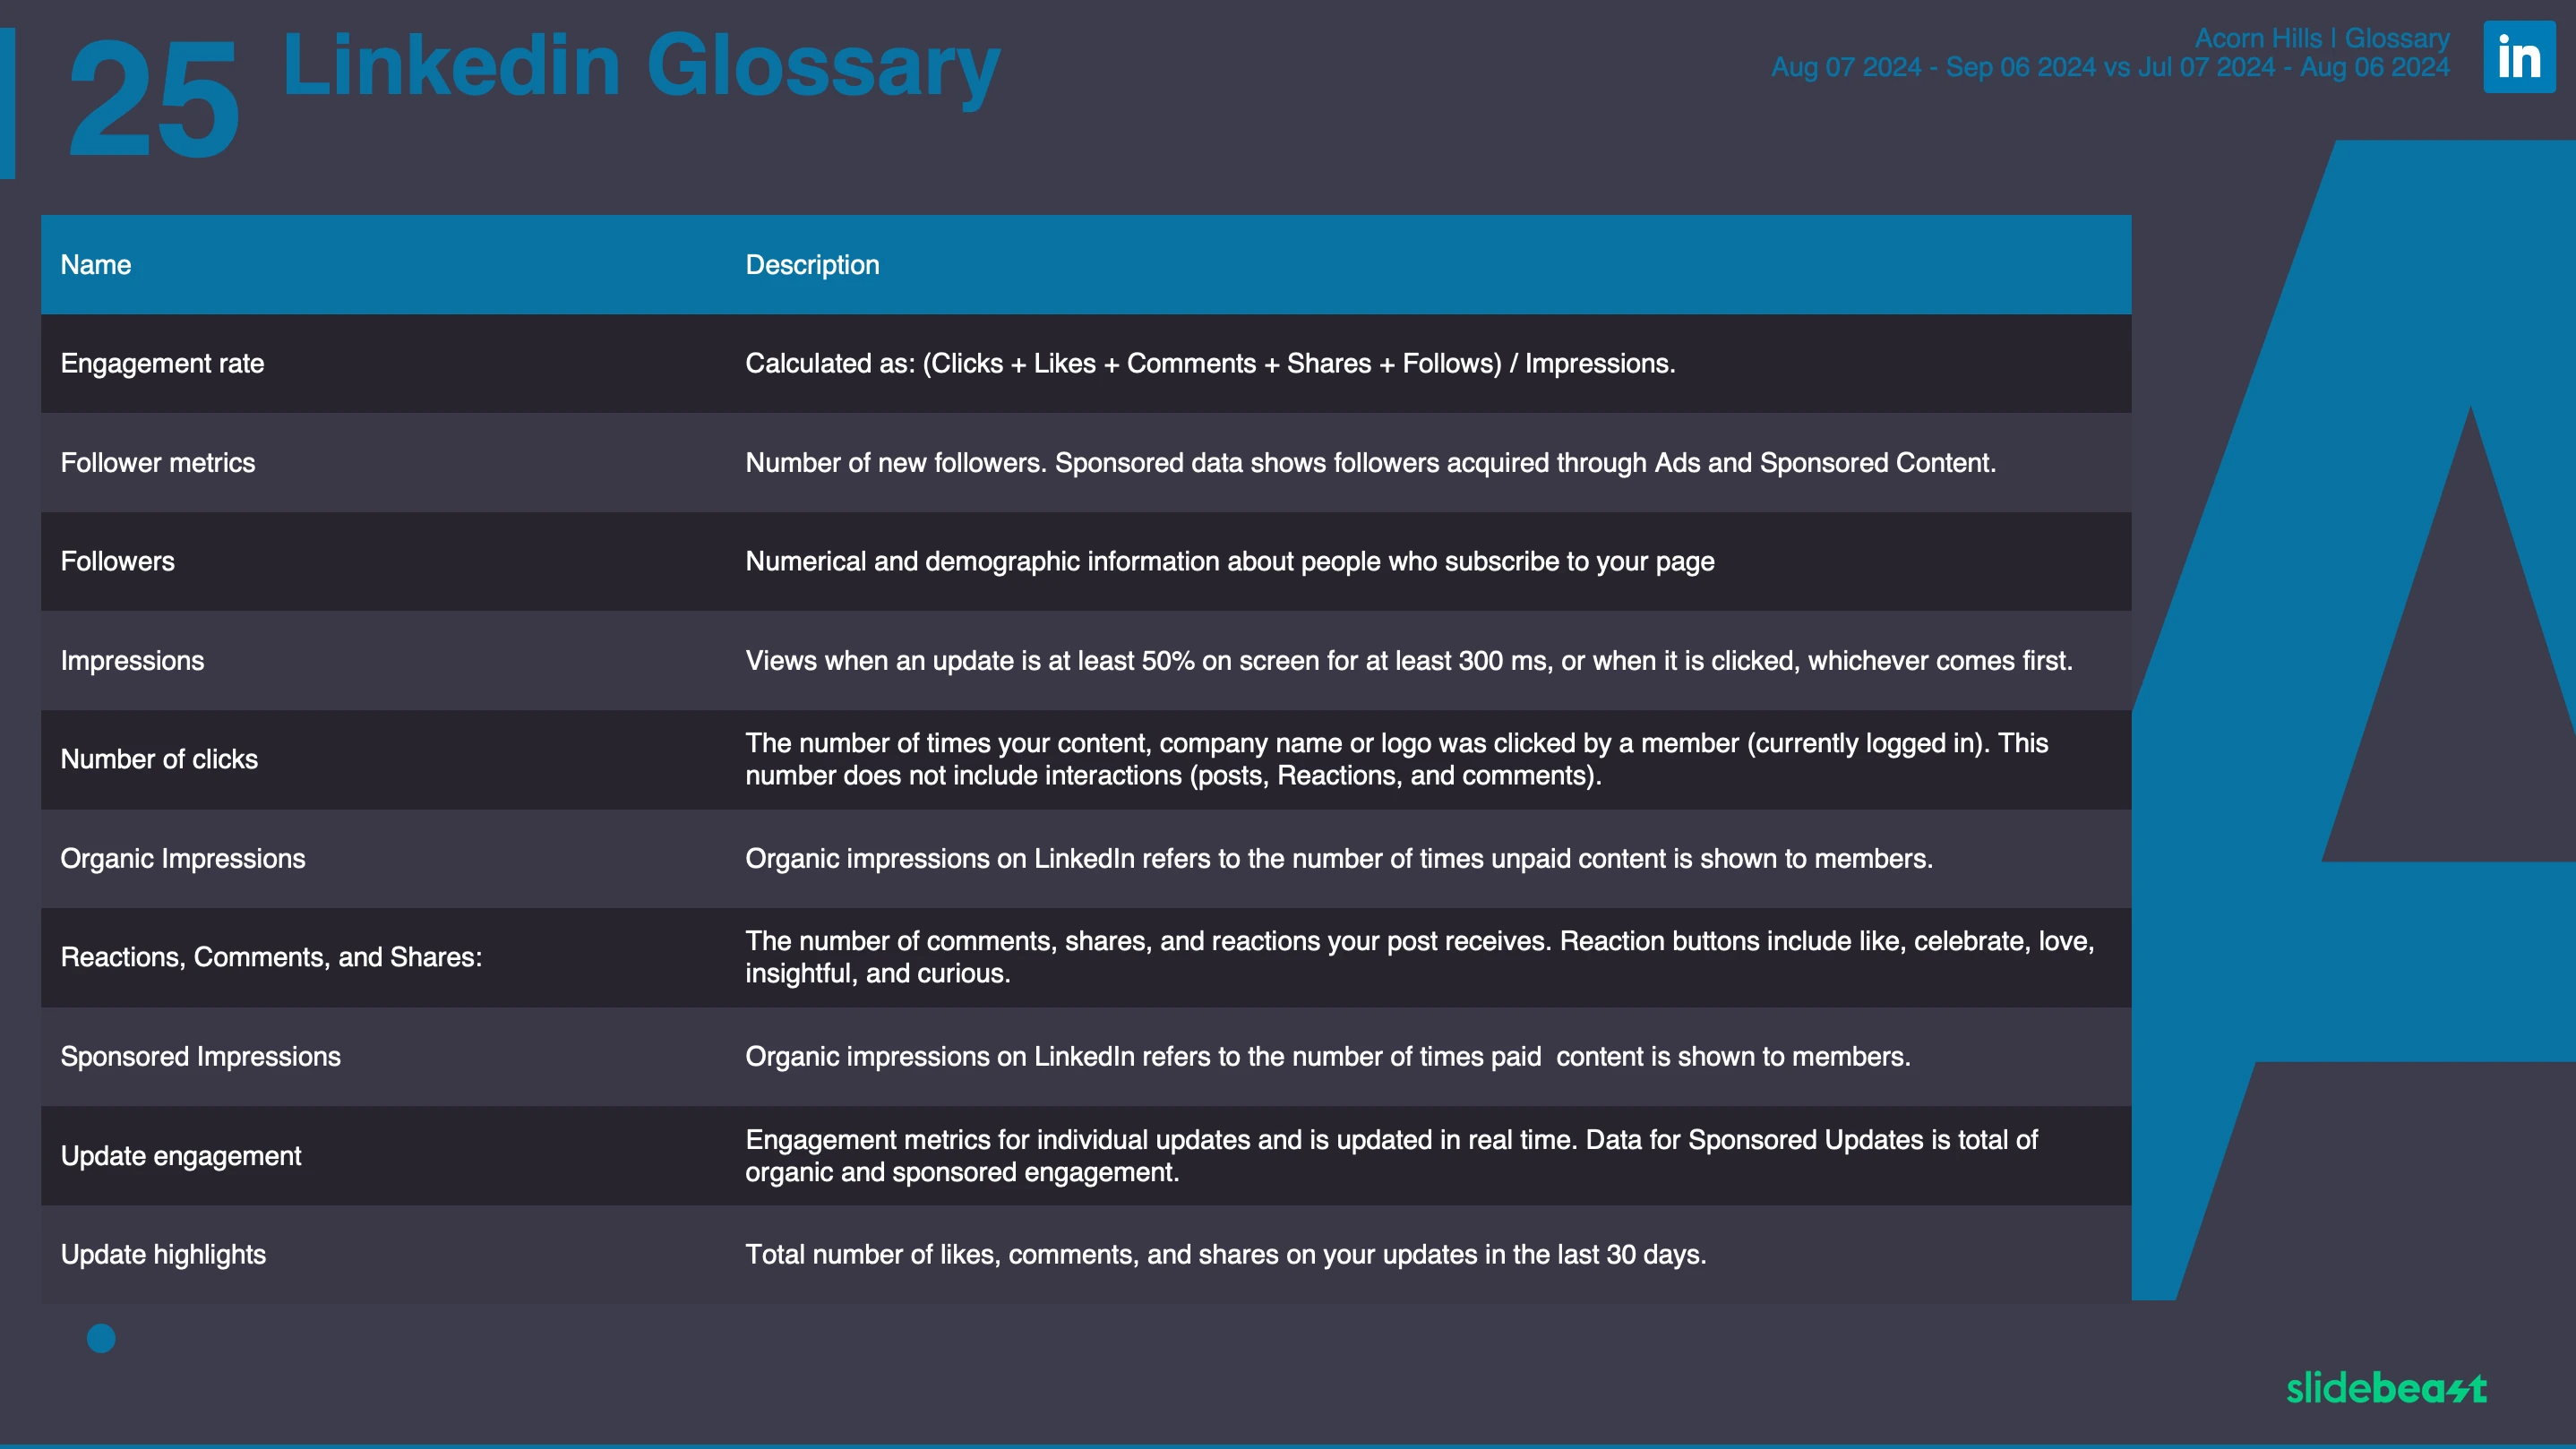
A comprehensive section defining key LinkedIn metrics and terms. This helps you better understand the report and ensures you have full clarity on what each metric represents.

Visitor Metrics
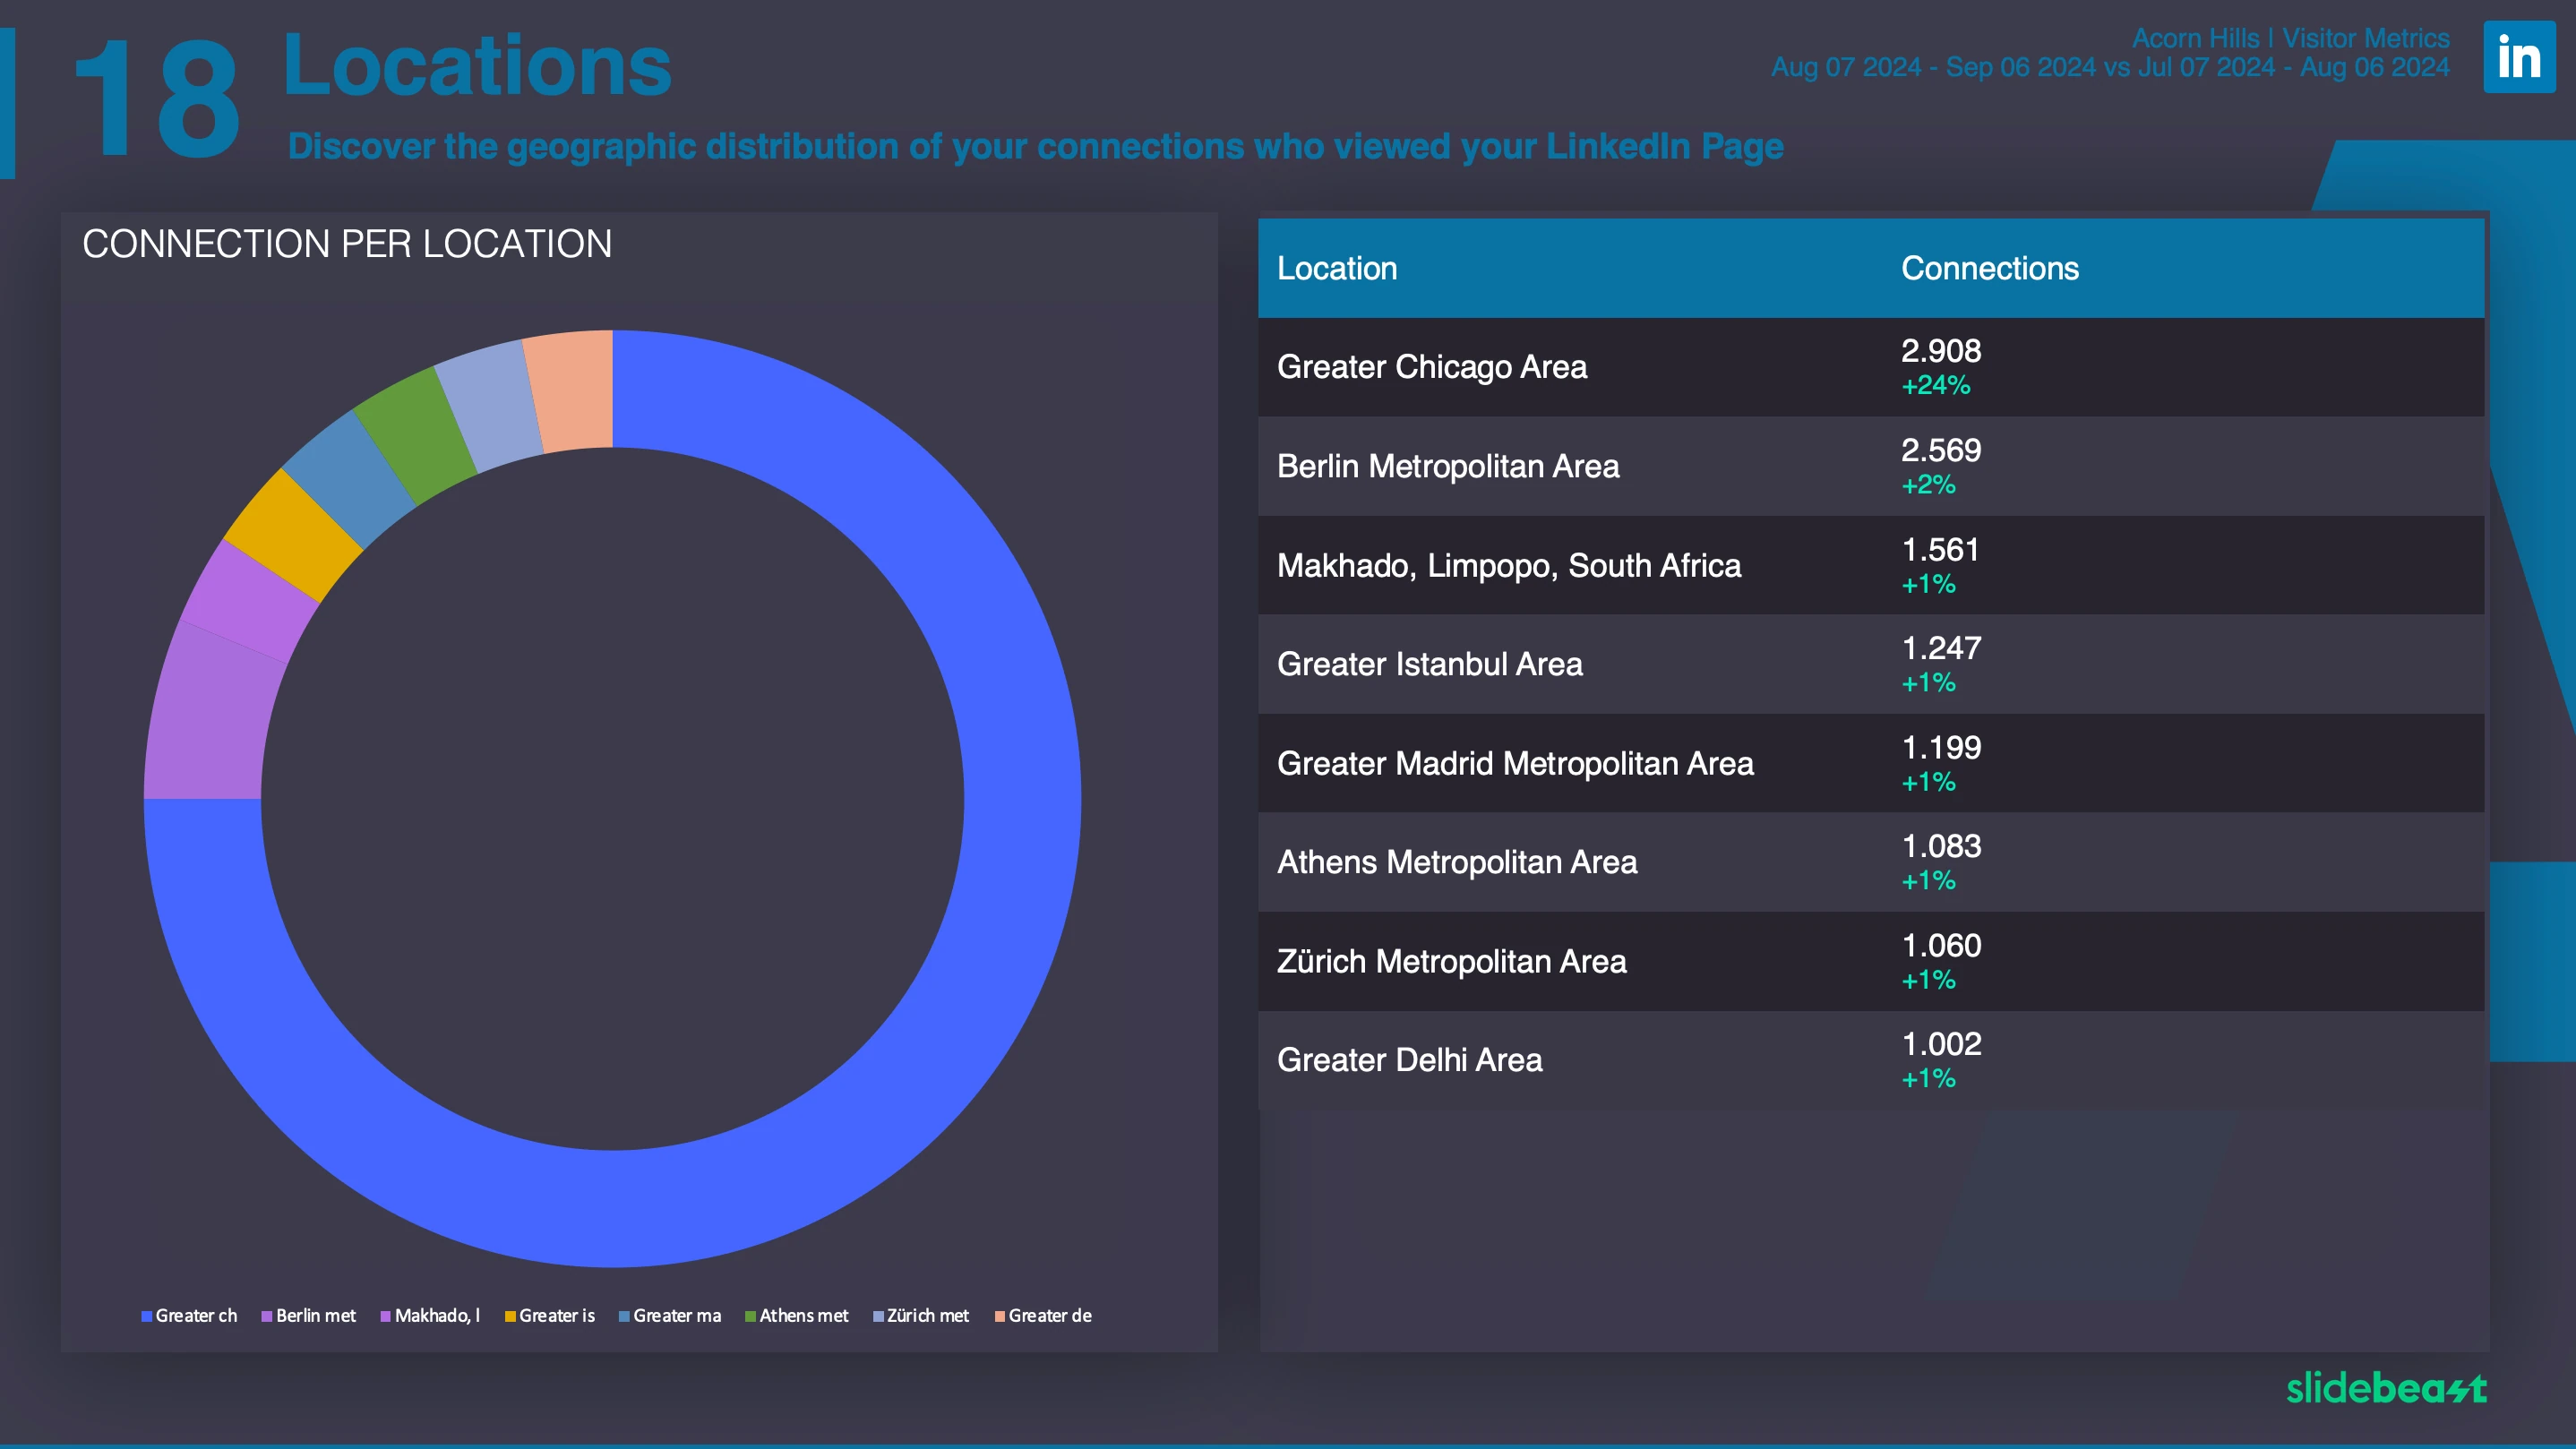
In this section, spread over 5 slides, you’ll find detailed data on the people who visited your LinkedIn profile or company page. It breaks down the metrics by demographics such as industry, job titles, and company size, giving you deeper insights into your audience.

Insights
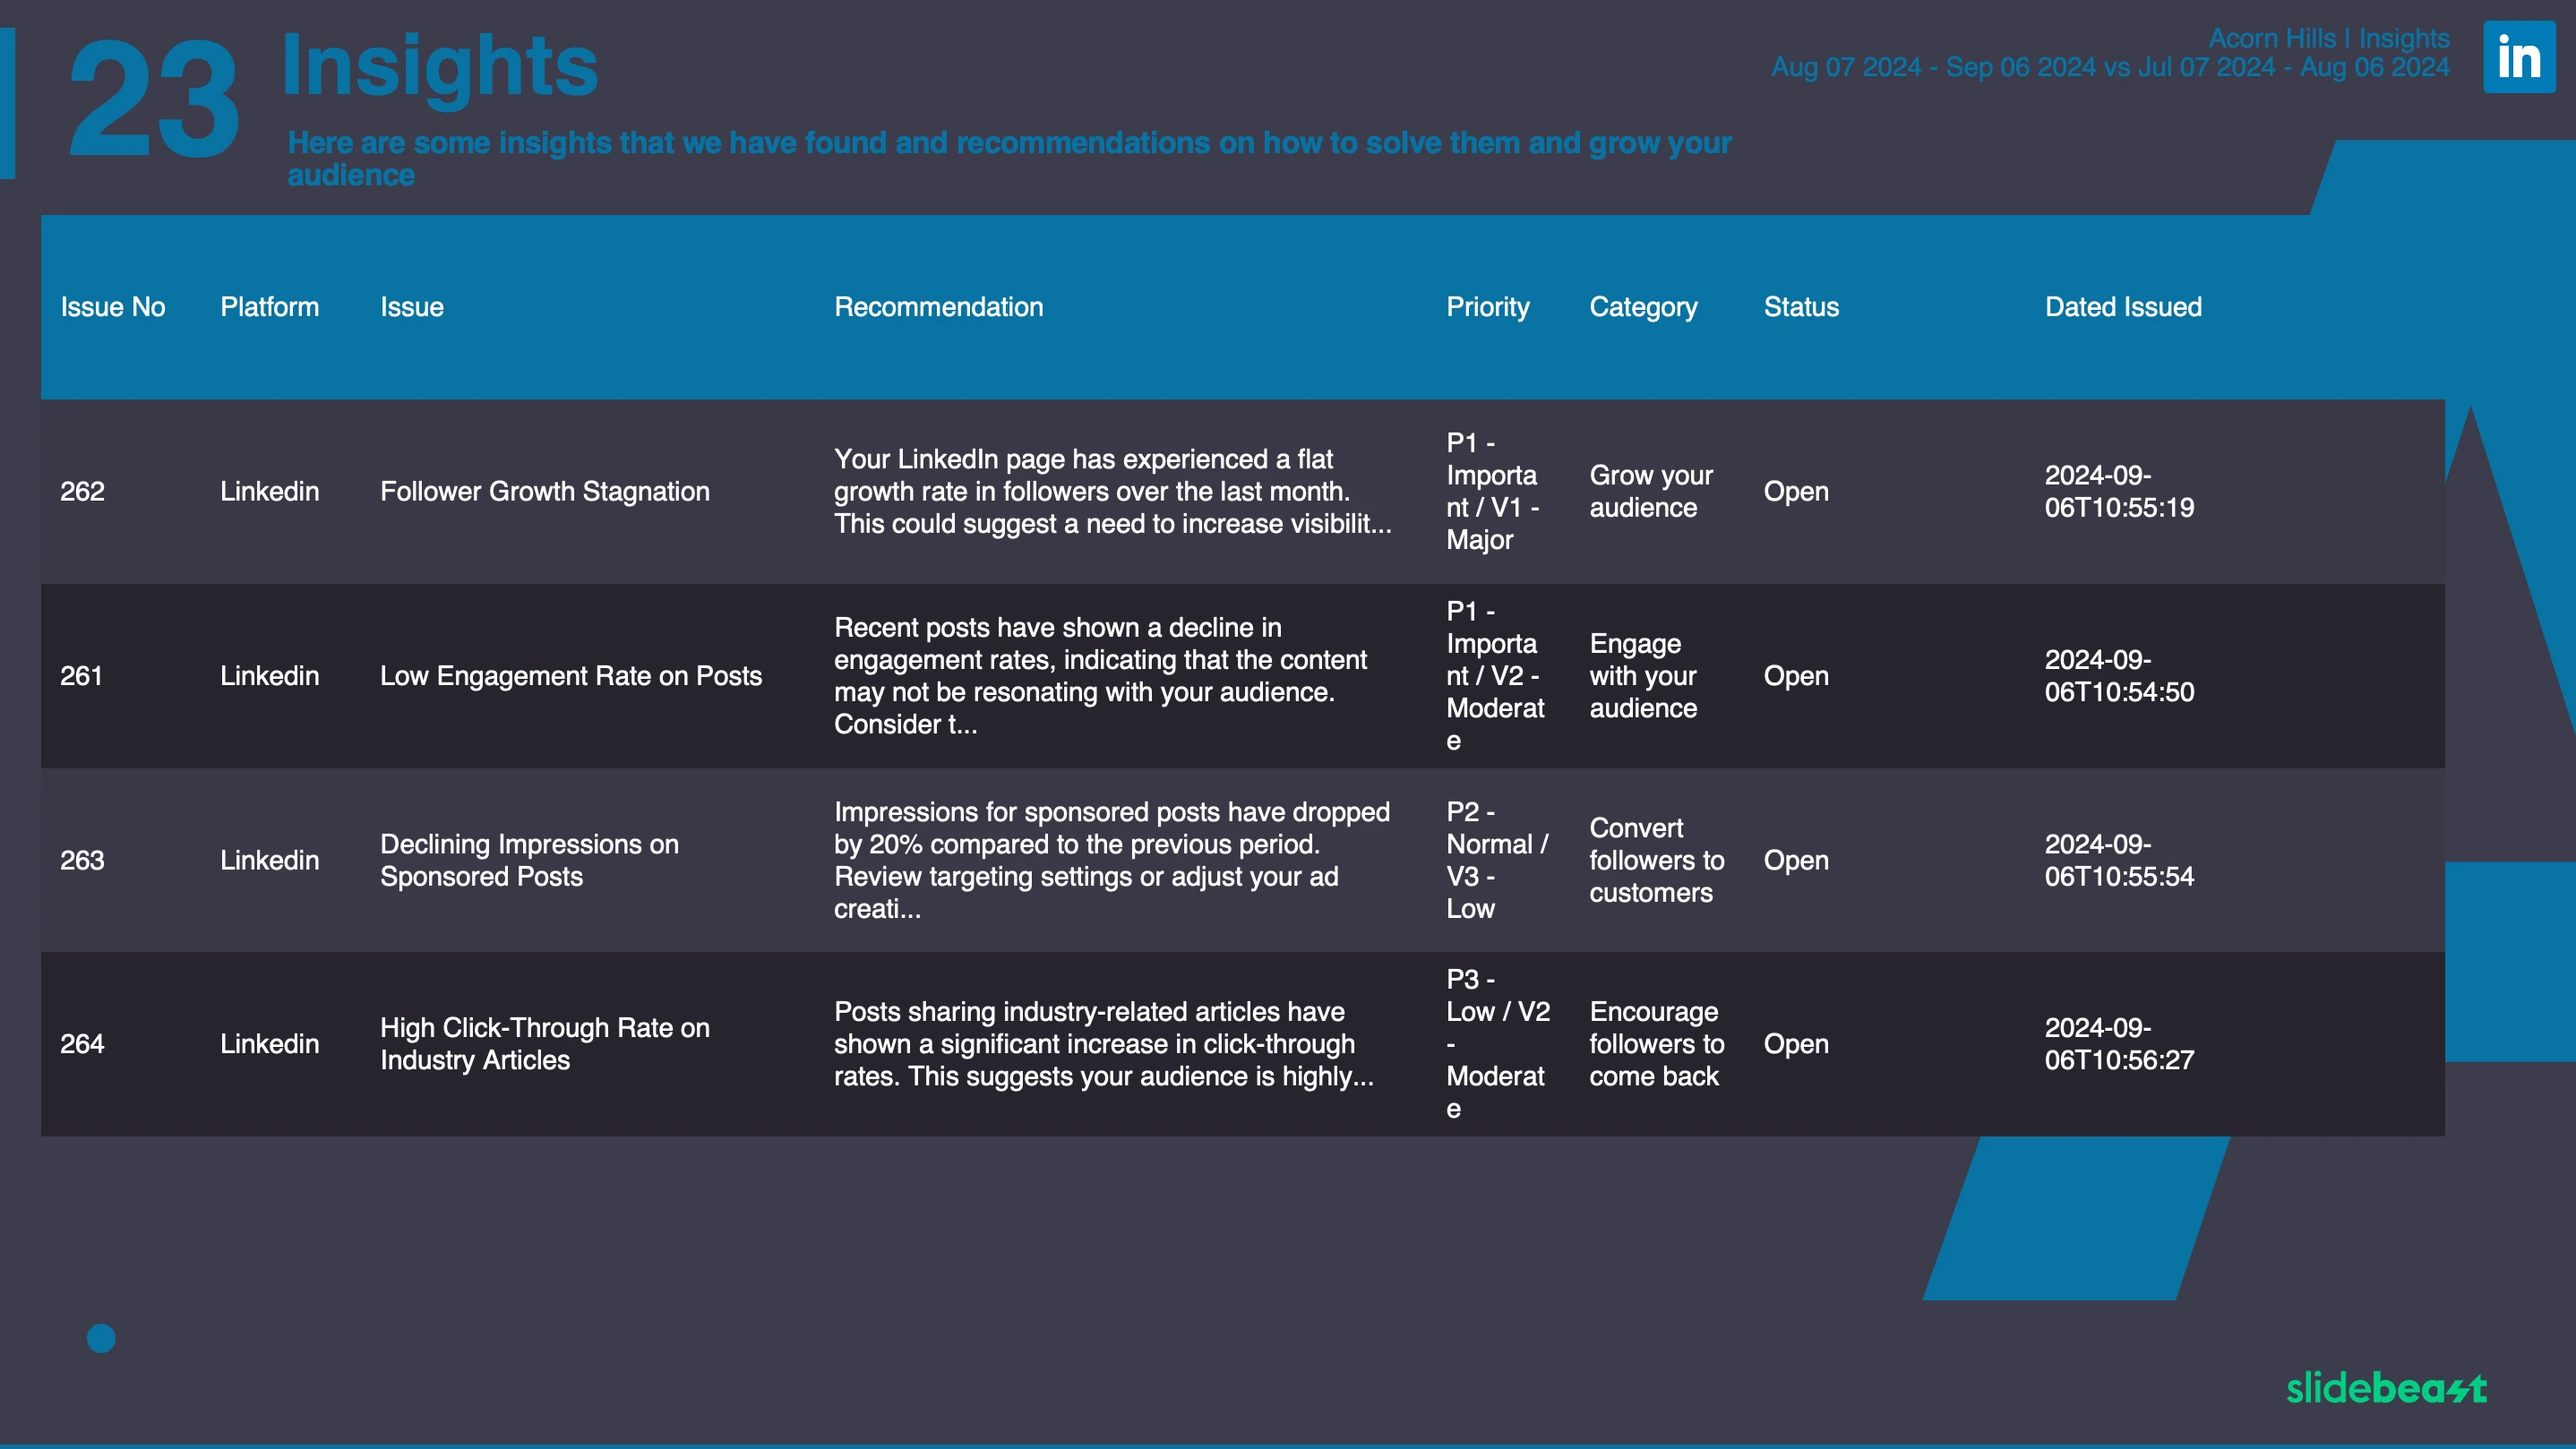
Insights about the particular LinkedIn account can be found in these slides. Only available on Enterprise package.

The Dashboard template offers a comprehensive overview of your LinkedIn metrics, making it a valuable tool for strategic insights and performance tracking:
Who should use this template?
- Marketing Directors and CMOs: Get a high-level view of overall LinkedIn performance and strategy effectiveness.
- Advertising Managers and Directors: Track key metrics to evaluate the success of LinkedIn advertising efforts.
- Product Managers: Monitor metrics related to product posts to assess impact and performance.
- Digital Analysts and Data Scientists: Aggregate data for a holistic view of LinkedIn metrics and trends.
- Creative Designers: Review overall performance to optimize creative strategies.
- SEO Specialists: Analyze how SEO efforts are reflected in overall LinkedIn performance metrics.
- Business Owners and Entrepreneurs: Gain a comprehensive overview to inform strategic decisions.
- Marketing Teams: Collaborate on performance insights to enhance LinkedIn strategies.
When you should use this template?
- Performance Monitoring: Regularly review key metrics to track overall LinkedIn performance.
- Strategic Planning: Use insights to guide strategic adjustments and resource allocation.
- Campaign Analysis: Evaluate the success of LinkedIn campaigns and make data-driven decisions.
- Trend Identification: Identify trends and patterns to inform future strategies.
- Reporting: Share a comprehensive overview of LinkedIn performance with stakeholders.
Customize Features Your Way
White Label your LinkedIn Dashboard Report Template
Customize slide backgrounds, chart colors, and chart types. Add your customer's logo and corporate branding. Short on time? Simply choose a color theme.
White Label your LinkedIn Dashboard Report Template
Schedule your LinkedIn Dashboard Report Template
Schedule your LinkedIn Dashboard Report Template
Schedule your reports to be delivered directly to your or your customer's inbox. Once you've created your report, just set the frequency, time, and recipient list. Again, time saved!

Lightening Fast Reporting Waiting For you
Company or agency try Slidebeast's 14 days free trial including all templates in Powerpoint format, white labeling and report scheduling along with a ton of other features that will save you tremendous amount of time. Connect your account now!
No credit card needed.Getting Started with Slidebeast LinkedIn Analytics Report Template Reporting
Slidebeast does not use blank canvases or dashboards, every report page is pre-structured with LinkedIn Analytics Report Template data and ready to be downloaded & analyzed.
See how below
Connect your LinkedIn Analytics Report Template Account
Pick a pre-made reporting template or start from scratch
Create Report Wizard will make it easy for ya
Download & Schedule your report
F.A.Q.
What is Slidebeast?
Slidebeast is a marketing report automation platform with an emphasis on editable Powerpoint output. Contrary to most report automation platforms, Slidebeast does not use dashboards for live view but focuses on downloadable reports & ease of use platform simplicity so getting a report only takes a few minutes.
What is Marketing Report Automation?
Marketing Report Automation streamlines the report preparation process by pulling your updated data from marketing platforms such as Google Analytics, Facebook, Instagram and laying it on a white canvas, a pdf, a live dashboard or a presentation.
How does your 14 day free trial work?
Your 14-day free trial reflects the features of the Enterprise package where all features are available. No credit card needed. At the end of your trial period, you will be asked to choose a plan or go free forever. Keep in mind that if you decide to go on the free plan, you will lose all the features and data you have been using up to that point.
Can I cancel my account at any time?
Yes, if you ever decide that Slidebeast isn’t for you, you can switch to free forever and keep your data or you can delete your account along with your data.
Is Slidebeast expensive?
Slidebeast is the cheapest software available as far as report automation is concerned. The idea is to make Slidebeast available to everyone who wants to cut down on report preparation time.
Do you provide live dashboards?
No, we solely focus on reports as a shareable & downloadable presentations.
