Creating a funnel in Google Analytics 4 (GA4) is a powerful way to track user behavior and understand their purchase journey. Here's a detailed, step-by-step guide to setting up and customizing funnels in GA4, packed with tips and tricks to help you master user purchase journey reporting.
What to Expect from a Funnel in GA4
A funnel in GA4 provides a clear overview of user behavior through different stages of their journey on your website. By implementing funnel steps, you can visualize how users progress from one action to the next. This is especially useful for e-commerce sites to analyze abandonments and the ratios between adding to cart and completing a purchase. To achieve this, you might need to set up specific events, such as page views or button clicks.
Setting Up Funnel Using Blank Exploration in GA4
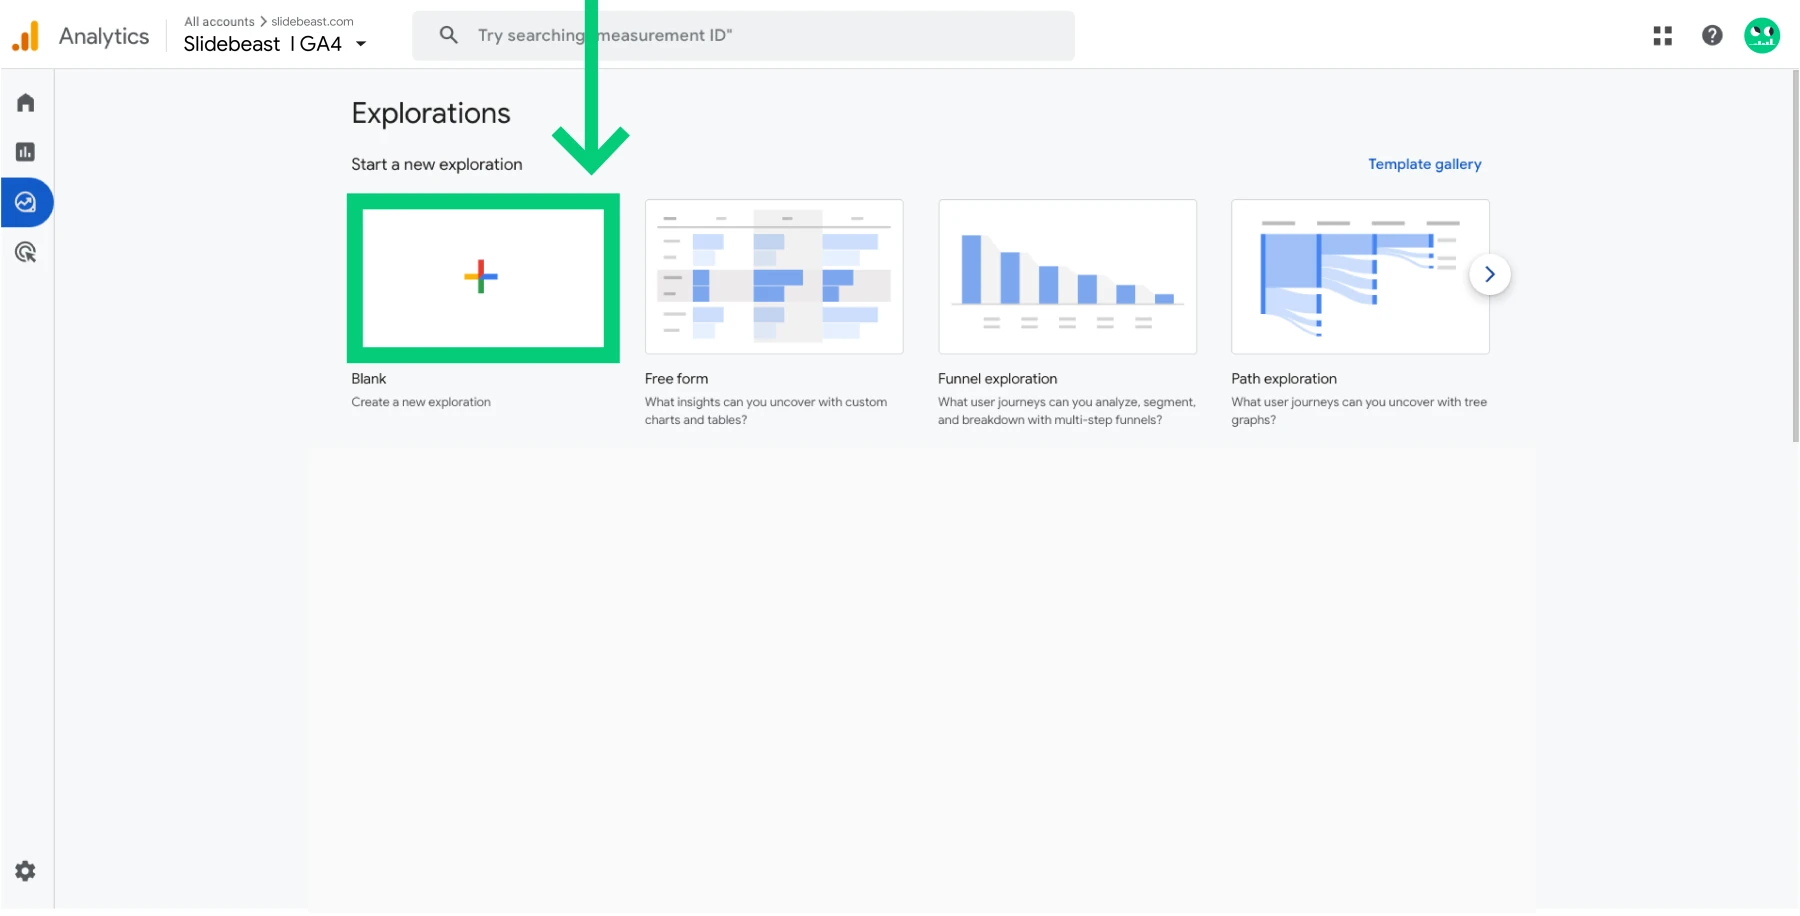
Create a New Exploration:
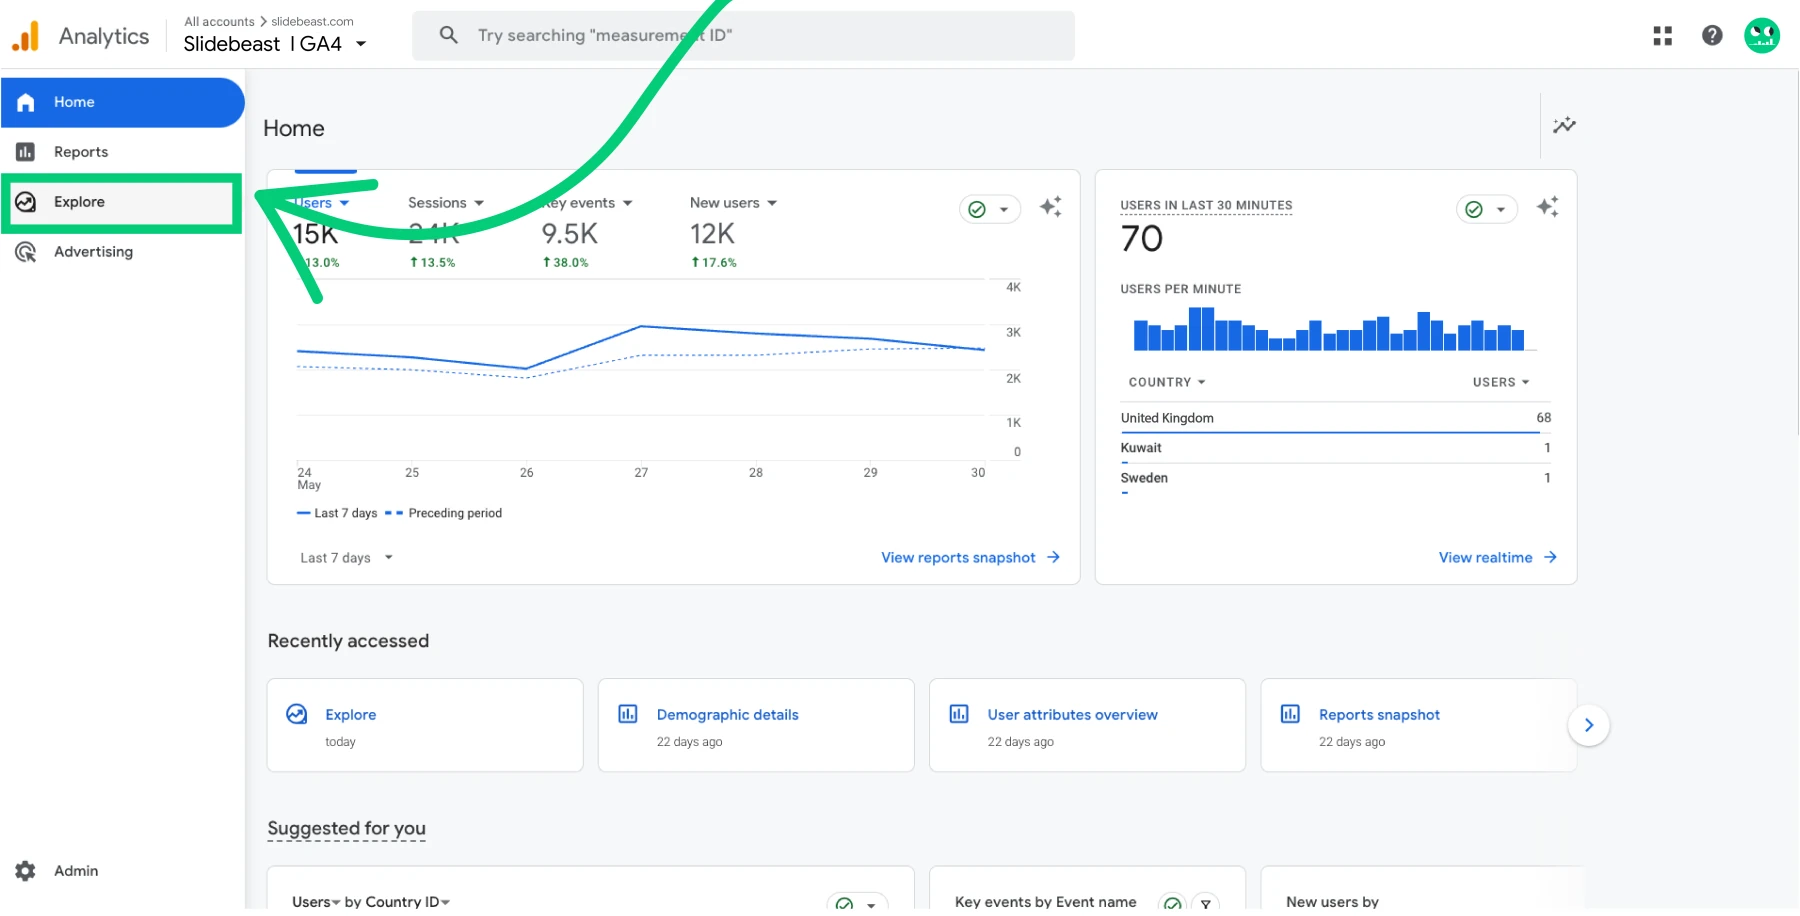
Log into your GA4 account and navigate to the "Explore" tab in the left-hand menu. Click on the "+" button to create a new, blank exploration.
 Feeling to urge to go for the premade Funnel Exploration here?
When setting up a new funnel exploration in GA4, you might feel inclined to click directly on "Funnel Exploration" instead of "Blank."
While the pre-made funnel exploration option offers more advanced settings and customization, it requires more time and effort to set up correctly. For a quicker, simpler setup, choose the "Blank" exploration option without hesitation. This will allow you to create a basic yet effective funnel, with the flexibility to add more advanced configurations later if needed.
Customizing the Funnel steps in GA4
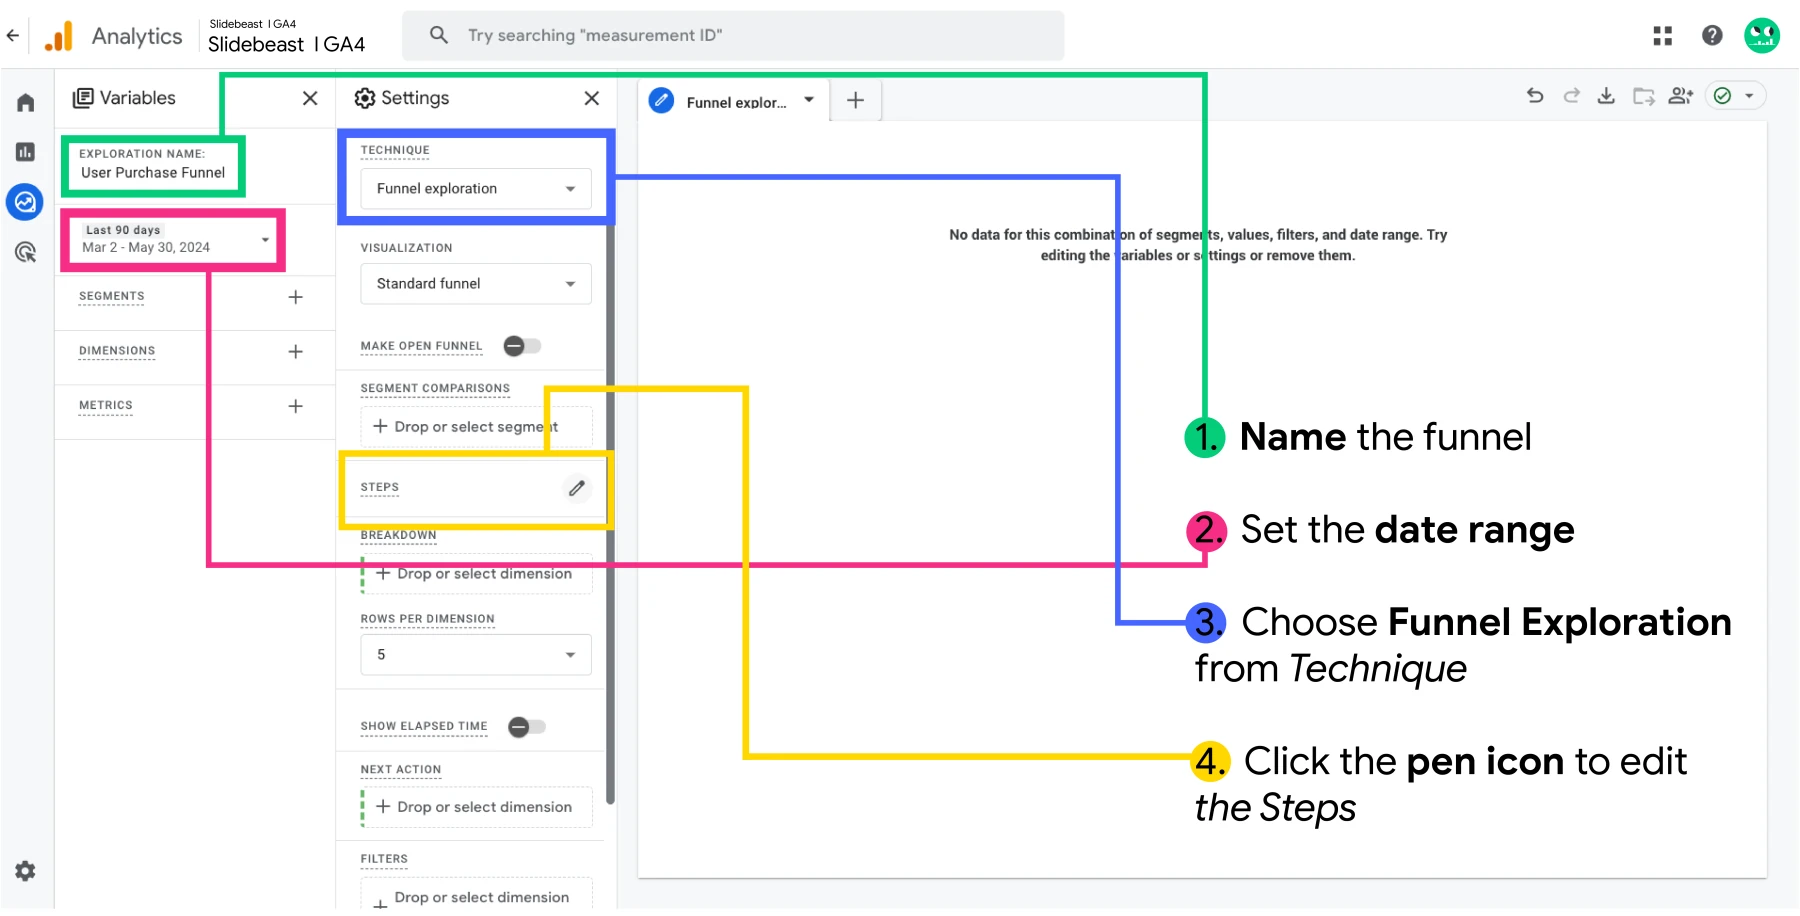
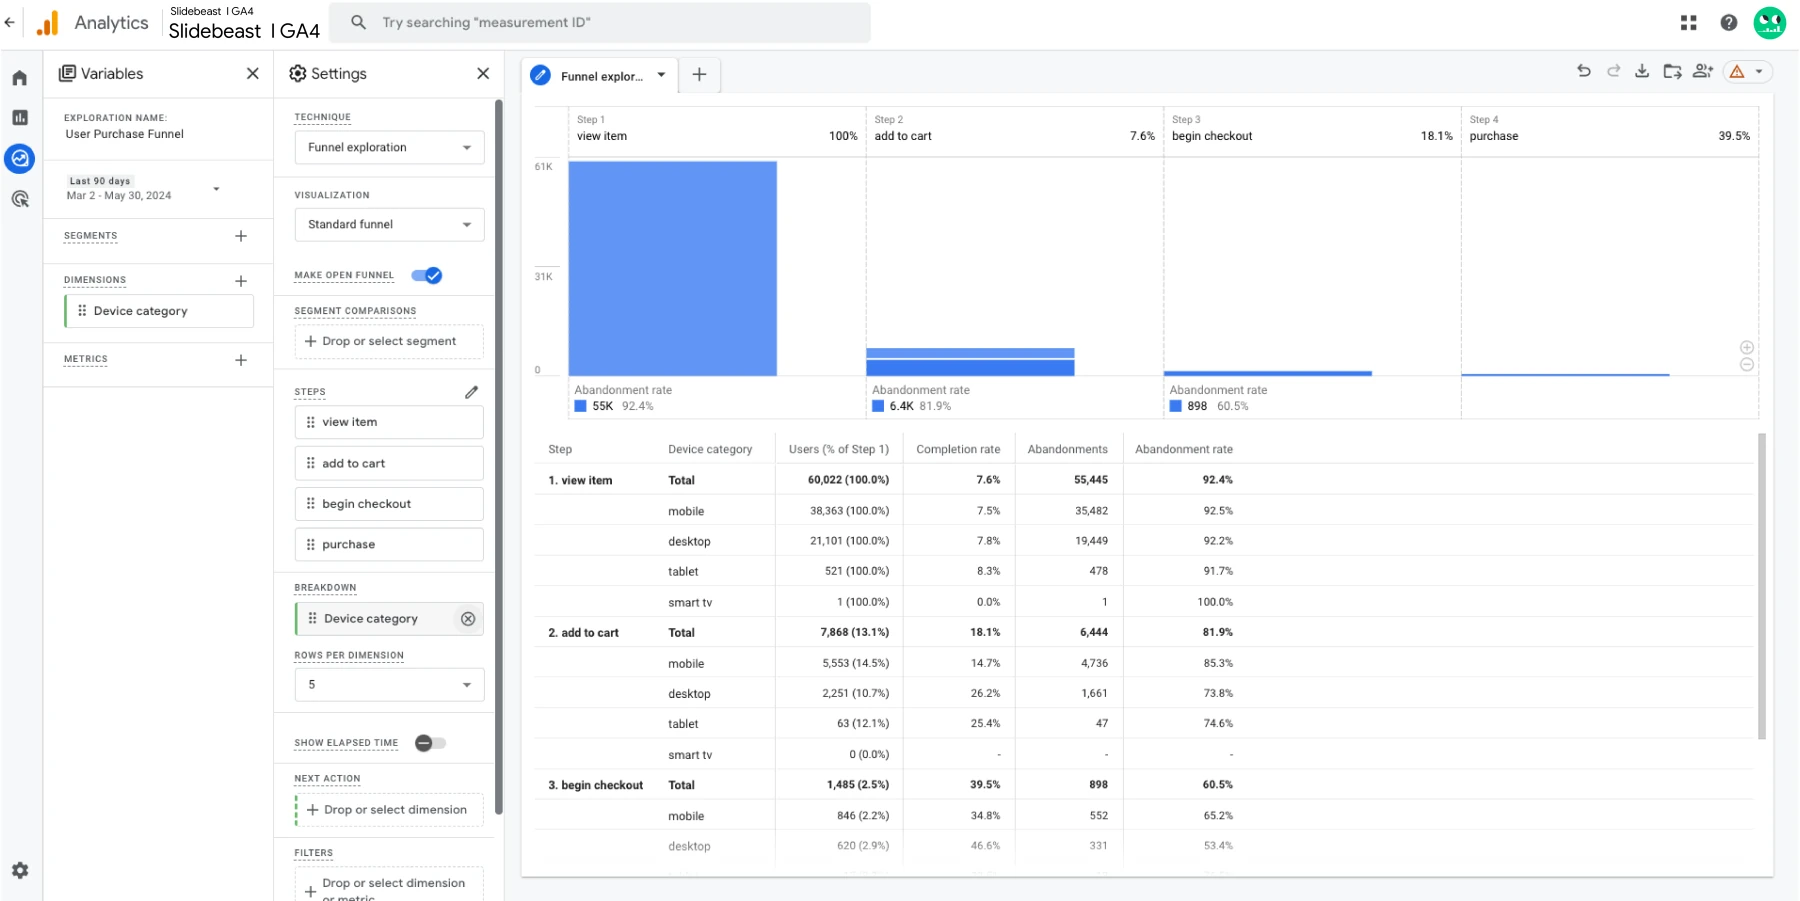
Once you name your exploration and set the desired date range, select "Funnel Exploration" from the technique section to get into the Funnel view. You will have no data before you set the actual funnel steps.
Next, click on the pencil icon next to "Steps" to add your funnel steps. Define each step based on events like "product_view," "add_to_cart," "purchase," or other events you've set up. Make sure to name the steps clearly to make them understandable for everyone. Use the AND/OR logic correctly when setting up the steps.
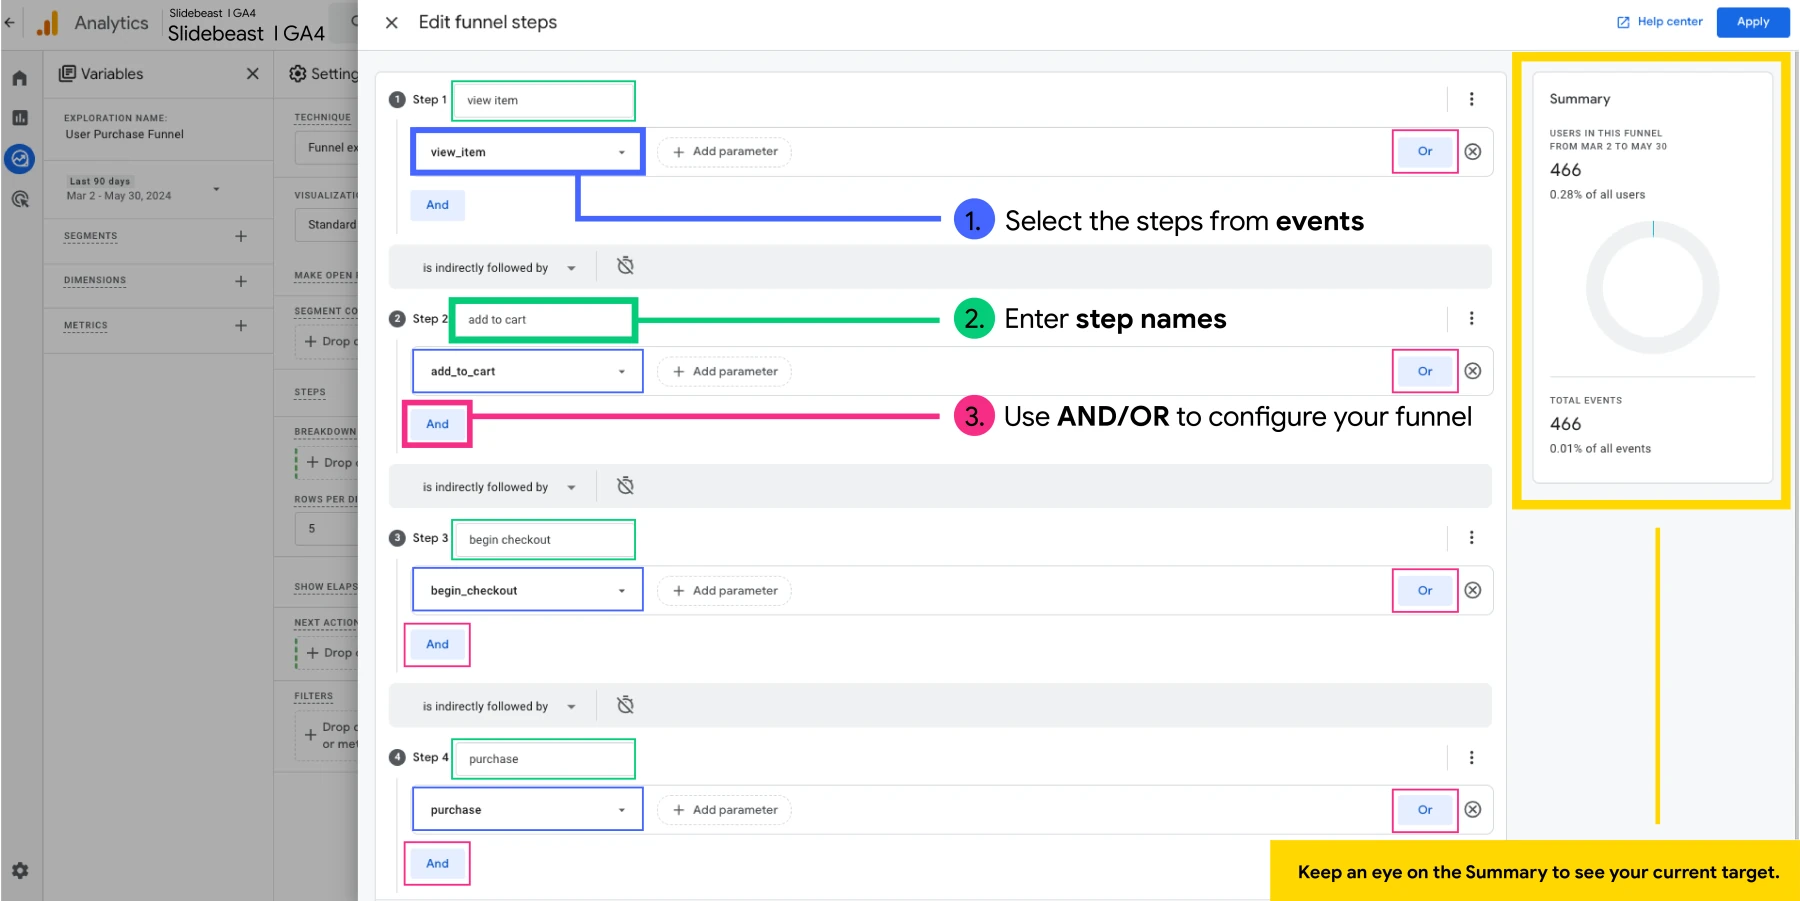
Keep an eye on the summary pie chart on the right to see the percentage of users captured by your current funnel steps. Once you’ve added all the steps, click "Apply" to see the first overview of your funnel.
Understanding Open and Closed Funnels
An important concept in GA4 funnels is the distinction between open and closed funnels.
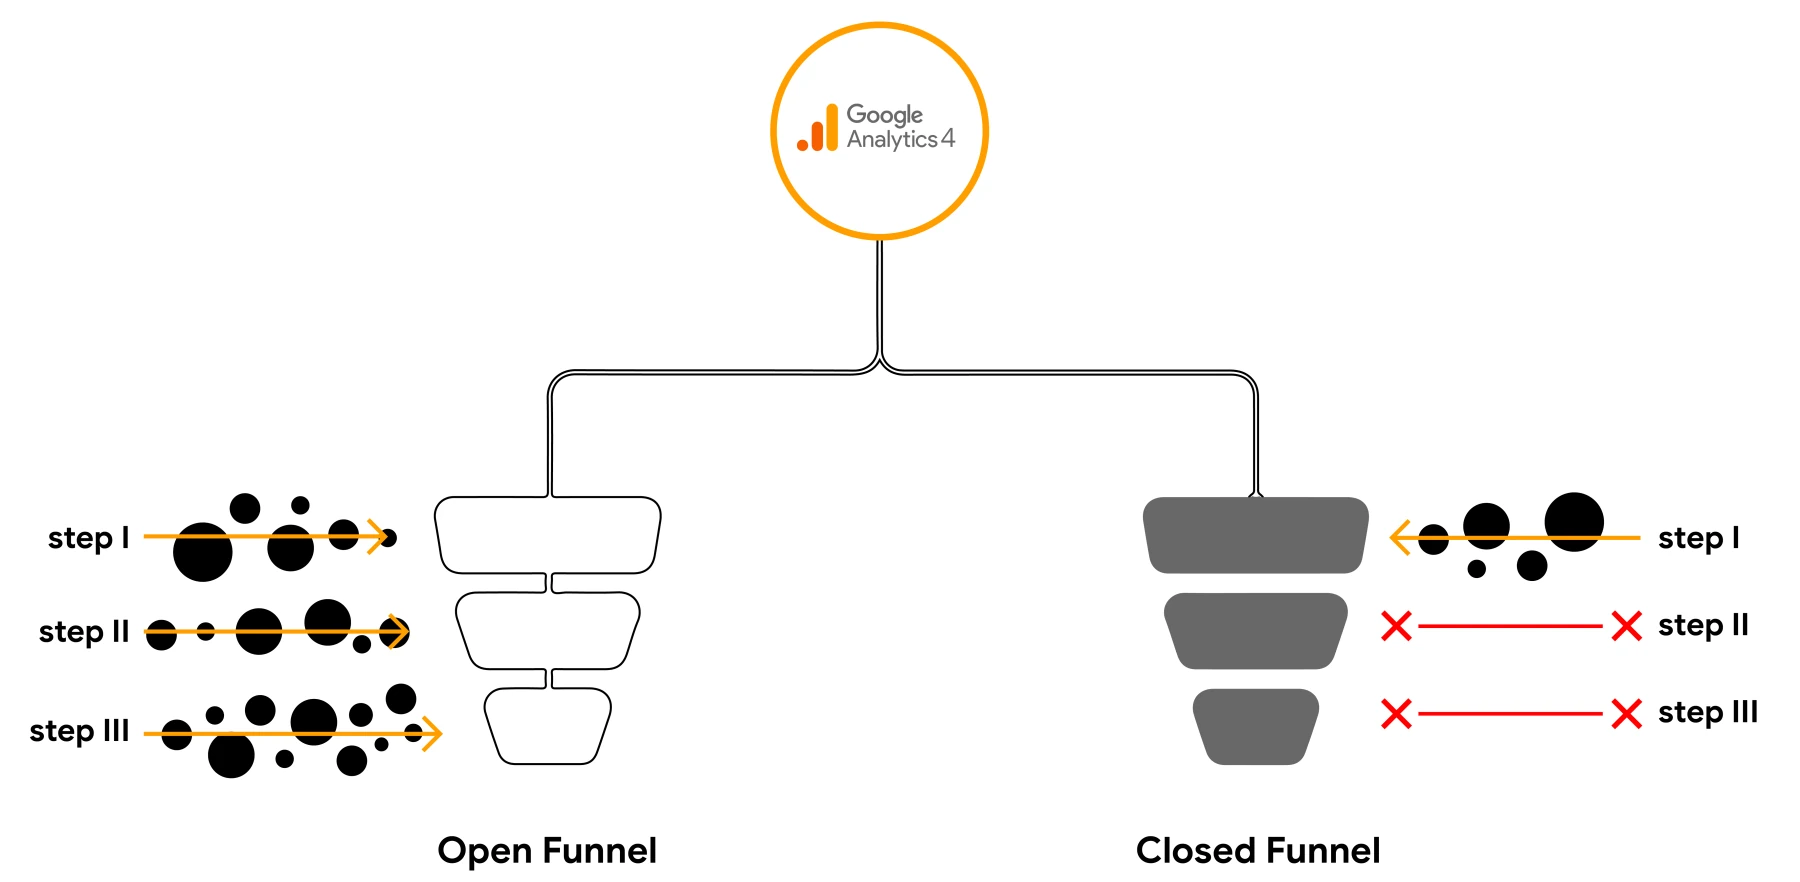
Closed Funnel: This tracks users who enter the funnel at the first step and proceed sequentially through each subsequent step. It's like a queue where everyone must start at the beginning. Best suited for tracking users who follow a specific, linear conversion path (e.g., subscribing to a newsletter after reading certain blog posts).
Open Funnel: This allows users to enter at any step and still be counted. It’s like letting people cut in line; they don’t have to start at the beginning to be included in the funnel analysis. (e.g., monitoring how many users visit product pages directly without prior browsing).
The choice between open and closed funnels depends on your analysis needs. In a nutshell, use closed funnels to track strict sequences and open funnels for broader engagement analysis.
Analyzing User Purchase Journeys with GA4
Once your funnel is set up, review the data to see how users move through each stage. Look for significant drop-off points to identify potential issues in the user journey. For example, if many users drop off at the checkout stage, investigate and optimize the checkout process.
For a more detailed and effective funnel analysis, consider the following adjustments:
Metrics & Dimensions and Segments:
Customize your funnel with additional metrics and dimensions to get deeper insights. Examples include device category, geographic location, or user segments.
Segments helps you to compare different user groups within your funnel. This supports identifying behavioral differences among various demographics or traffic sources.
Breakdown Dimensions:
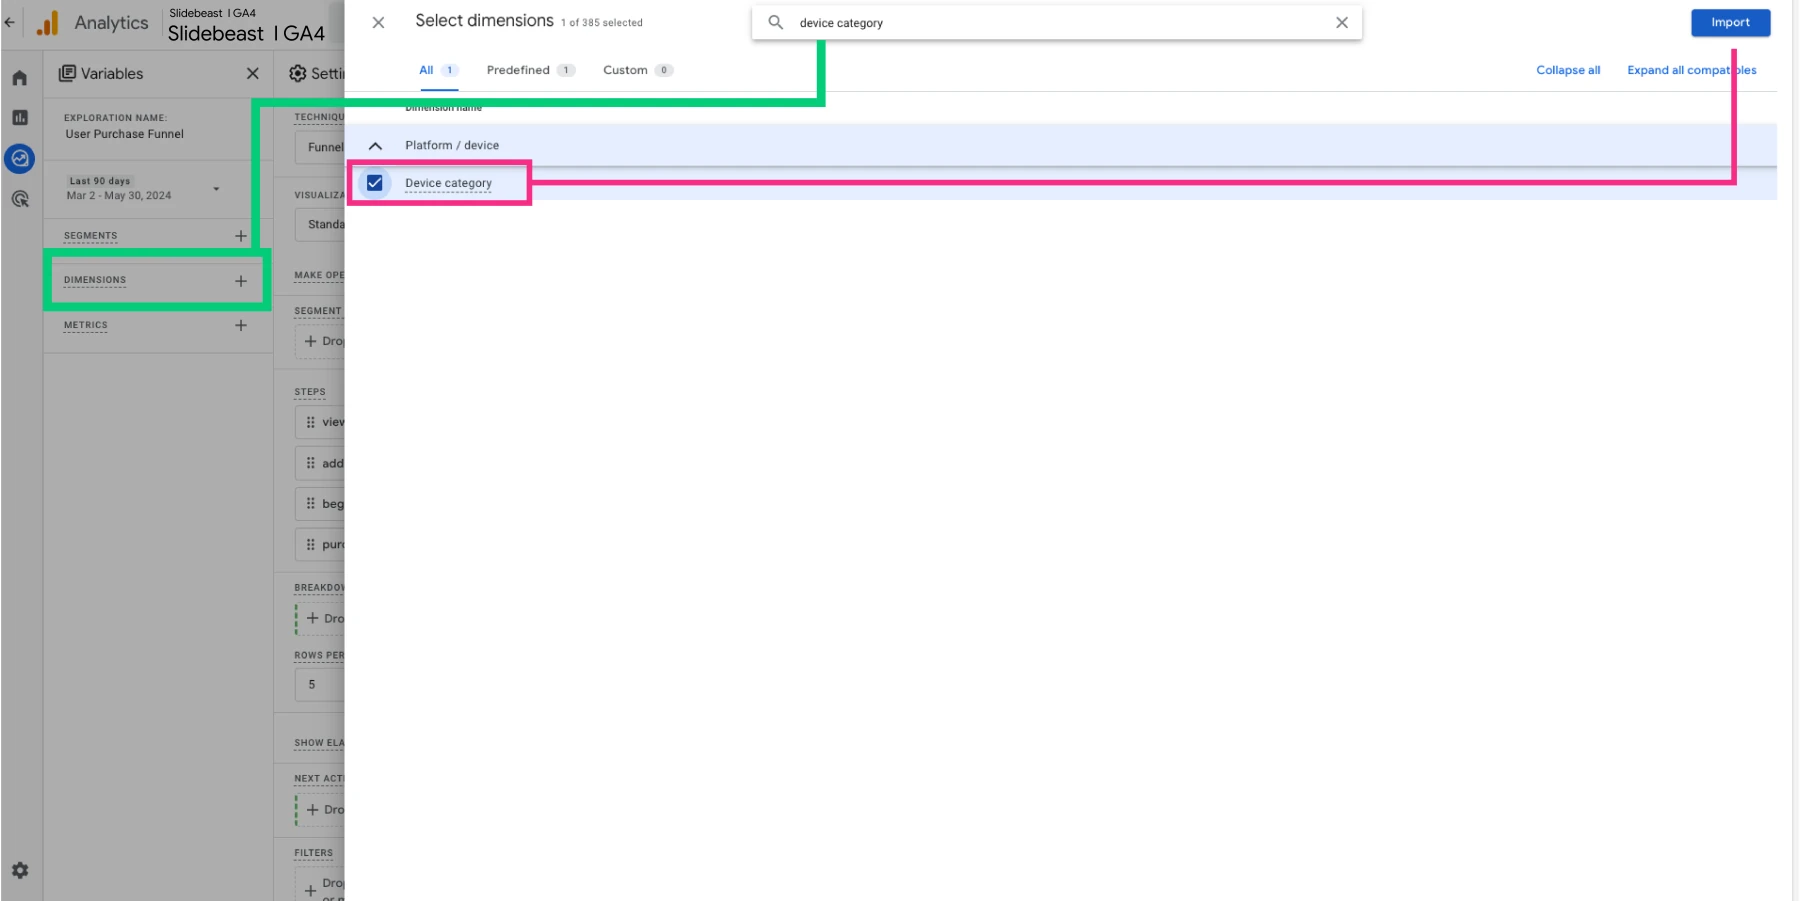
Add breakdown dimensions to analyze data in more detail. For example, see how the funnel performs across different devices by adding "Device category" as a breakdown dimension.
Lastly, you can use the trended visualization to view how user behavior changes over time for each step in your funnel. This can help identify patterns and trends in user interactions.
Visualizing Funnel Data in GA4 with Slidebeast
Using Slidebeast to visualize funnel data from GA4 is straightforward and powerful, especially with our pre-made E-commerce Report Template. This template is designed to transform raw data into insightful visual reports without all these detailed efforts needed.
Once you Start Your Free Trial -no credit card needed- or Login to begin, click Create New Report from the right corner and choose Google Analytics 4 E-Commerce template.
Customize the template to fit your business needs by adjusting brand colors, adding your logos, including/excluding specific events, selecting chart types, and more.
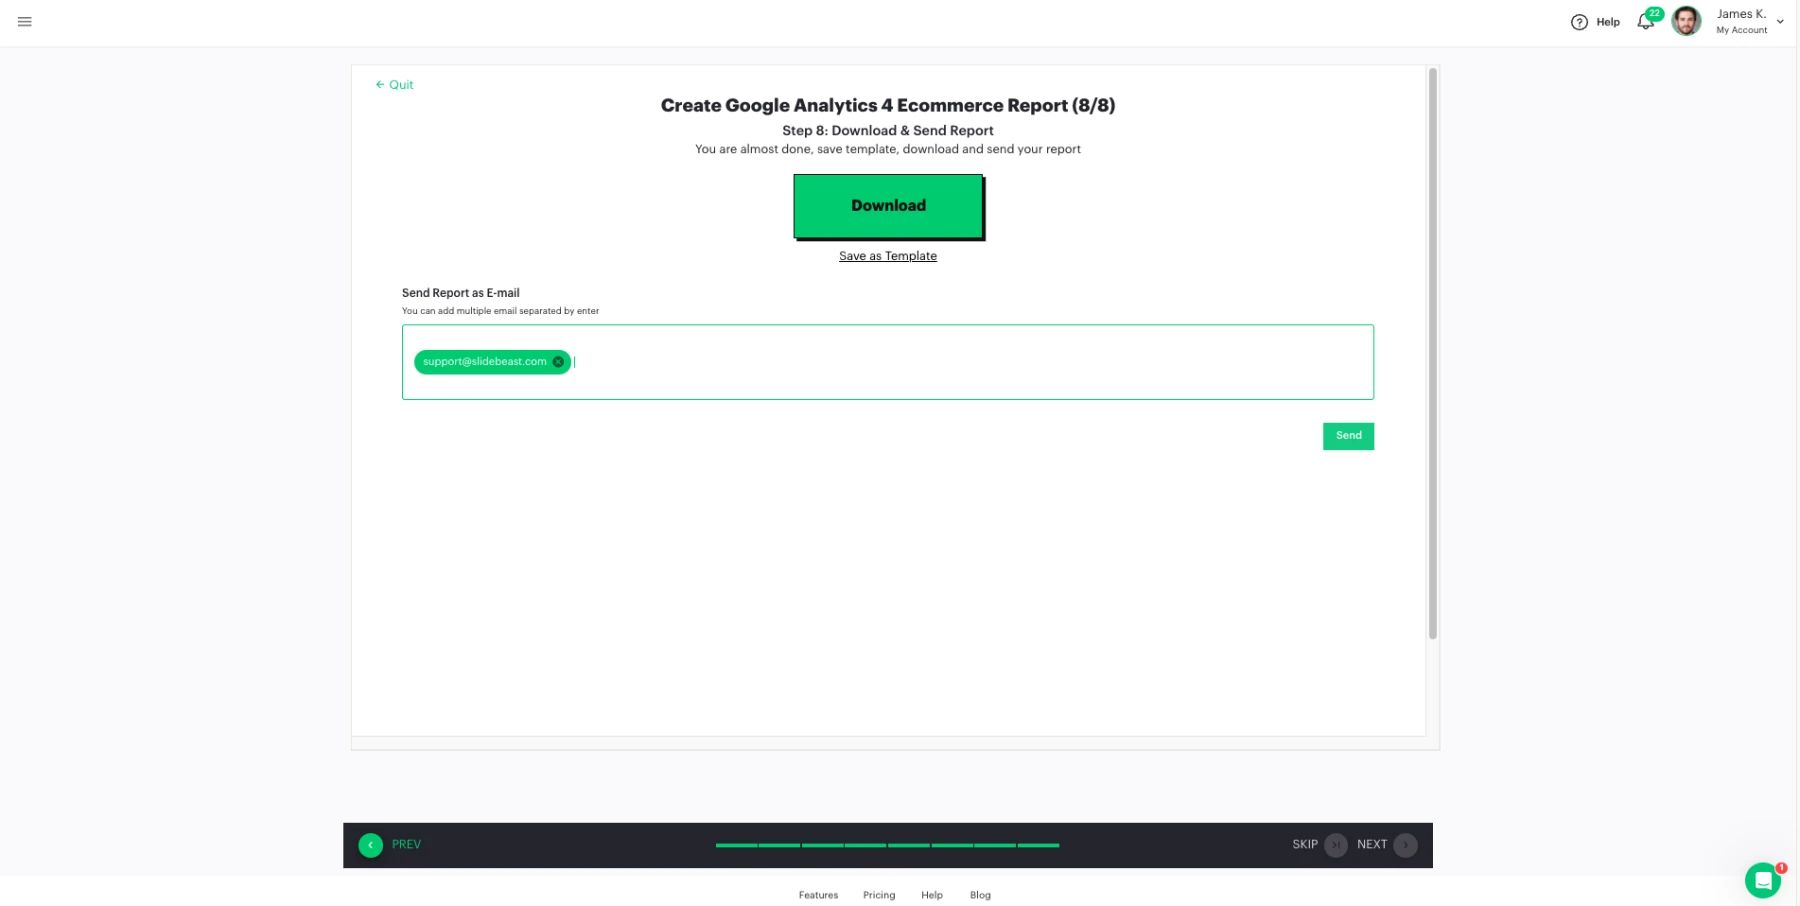
With everything set, click the “Create Report” button. Slidebeast will generate your report in the background and once the report is done, the “Creating Report” button will turn into a “Download” button. If you prefer to leave, you can also safely exit this section and download the report later from the “Reports” tab.
Detailed Visualizations:
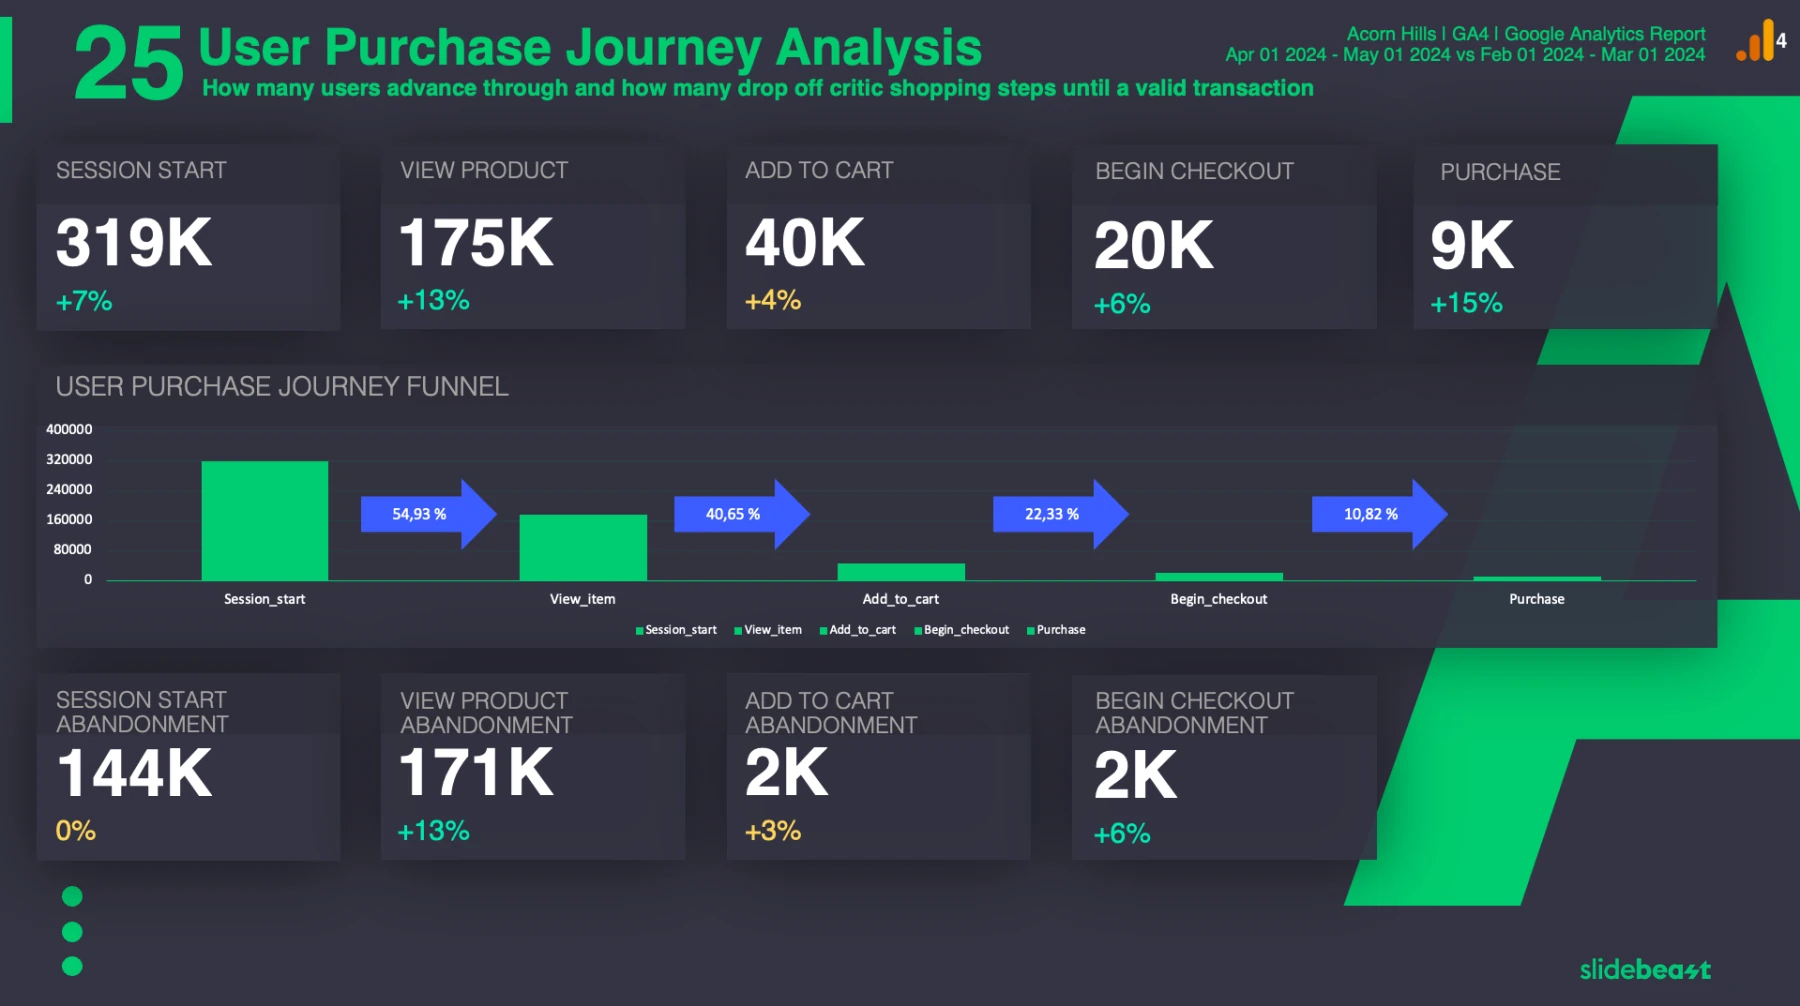
The Google Analytics 4 E-Commerce template includes a comprehensive user purchase journey analysis page. This page highlights key stages of the purchase funnel, such as session starts, product views, add-to-cart actions, checkouts, and purchases.
Visual elements, such as funnel charts and abandonment rates, help you quickly identify trends and areas for improvement, leading to faster decision-making.
Automating Purchase Journey Reports Using Slidebeast
Slidebeast not only helps visualize data but also automates your reporting process, saving you time and effort:
Set Up Scheduled Reports:
Use the pre-made GA4 e-commerce report template create your report and easily schedule it to be generated and sent at regular intervals, ensuring you always have up-to-date data.
Track Purchase Journeys:
Focus on user purchase journeys with metrics like add-to-cart rates and purchase conversions. Our e-commerce template provides detailed insights with features such as item performance lists, e-commerce overviews, user purchase journey funnels, transactions & revenue, sales performance, and purchaser data.
Efficiency and Accuracy:
Automated reporting ensures that your data is always current, accurate, and ready for analysis. This allows you to make informed decisions promptly, optimizing your e-commerce strategy continuously.
No more manual reporting and spending unnecessary time to find your own data!
Start your free trial today and experience the benefits of Slidebeast firsthand.