Google Analytics 4 (GA4) has become a go-to for tracking all the ins and outs of your website’s performance. One of the best things it offers is the ability to dive into user behavior. But let’s be real: navigating GA4 can sometimes feel like you’re solving a puzzle without a picture on the box. But don’t worry! We’re about to crack that code together.
In this guide, we’ll walk through what user behavior is, how to find the reports, which metrics to focus on, and how to create your own custom reports for those “aha!” moments.
What Is User Behavior in GA4?
User behavior is like people-watching but for your website. It’s understanding what your users are doing when they land on your page: Are they browsing around? Clicking everything in sight? Or do they just vanish as soon as they arrive?
In GA4, user behavior helps you answer questions like:
- How are users interacting with your site?
- Where do they drop off?
- Which pages hold their attention the longest?
This is crucial for improving your website’s UX (user experience), identifying potential bottlenecks, and ultimately optimizing your funnel.
Step-by-Step Guide to Accessing User Behavior Reports
Alright, let’s get into the good stuff. Here’s how you can find those precious user behavior reports in GA4.
Log in to your GA4 account
(Bonus points if you remember your password on the first try. If not, we’ve all been there.)
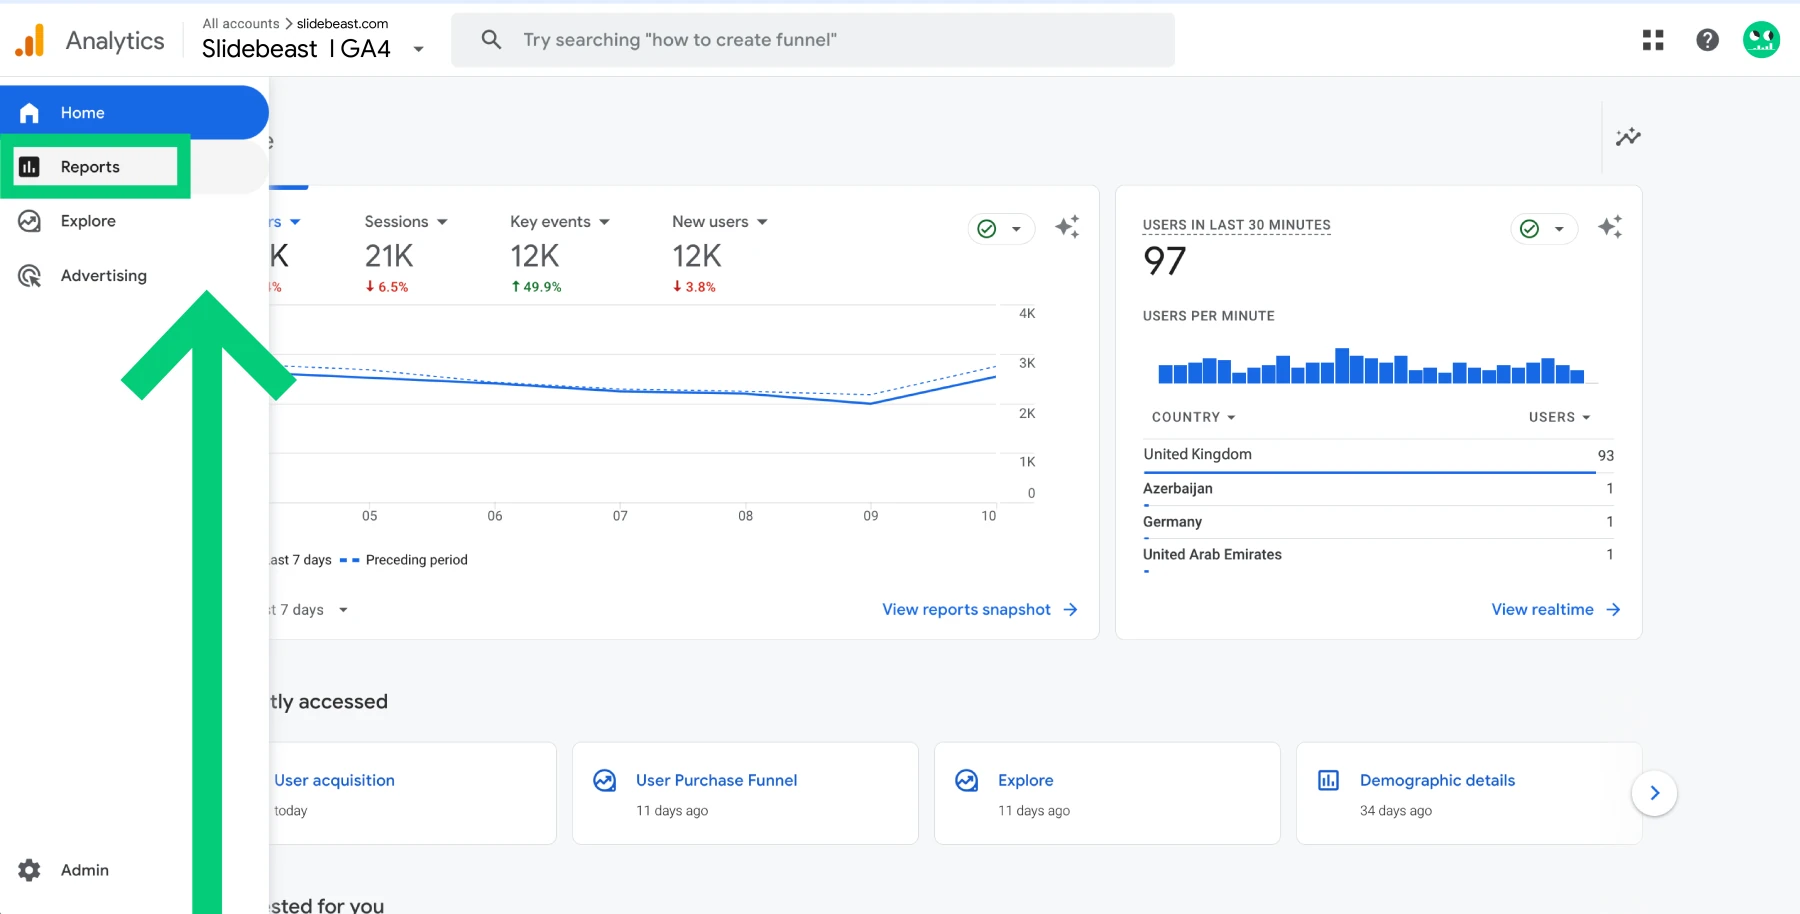
Go to the “Reports” tab on the left-hand side.
You’ll see this under the Insights section. This is your command center for understanding user activity.
Click on “Life cycle,” then select “Engagement.”
This is where GA4 hides all the juicy details about user interactions. Under “Engagement,” you’ll find a range of data like engaged sessions, events, and pages viewed. It’s basically your hub for seeing how users are interacting with your content.
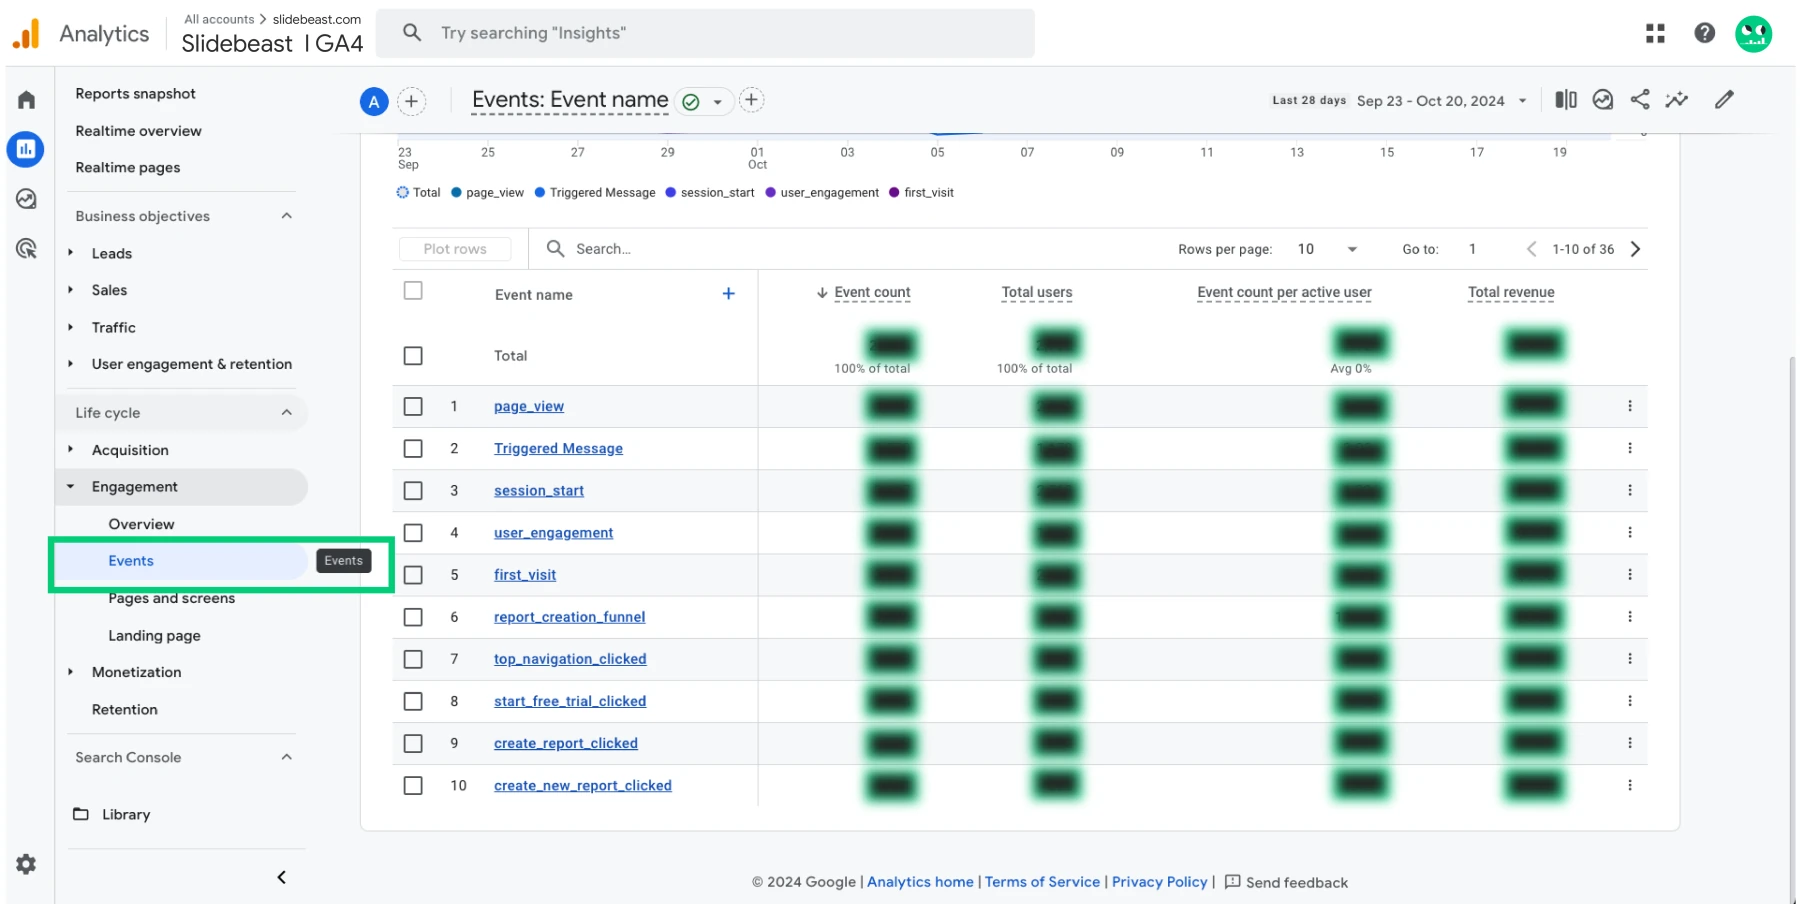
Navigate to the “Events” and “Pages and screens” reports.
Here, you’ll be able to see what actions users are taking and which pages they’re spending their time on. These following two reports are essential for understanding what users are doing and where they’re doing it:
- Events Report: Shows interactions like clicks, video plays, downloads, etc. GA4 tracks these automatically or you can configure custom events.
- Pages and Screens Report: This gives you a list of the pages (or app screens) users visited. You’ll see metrics like views, engagement time, and bounce rate for each page.
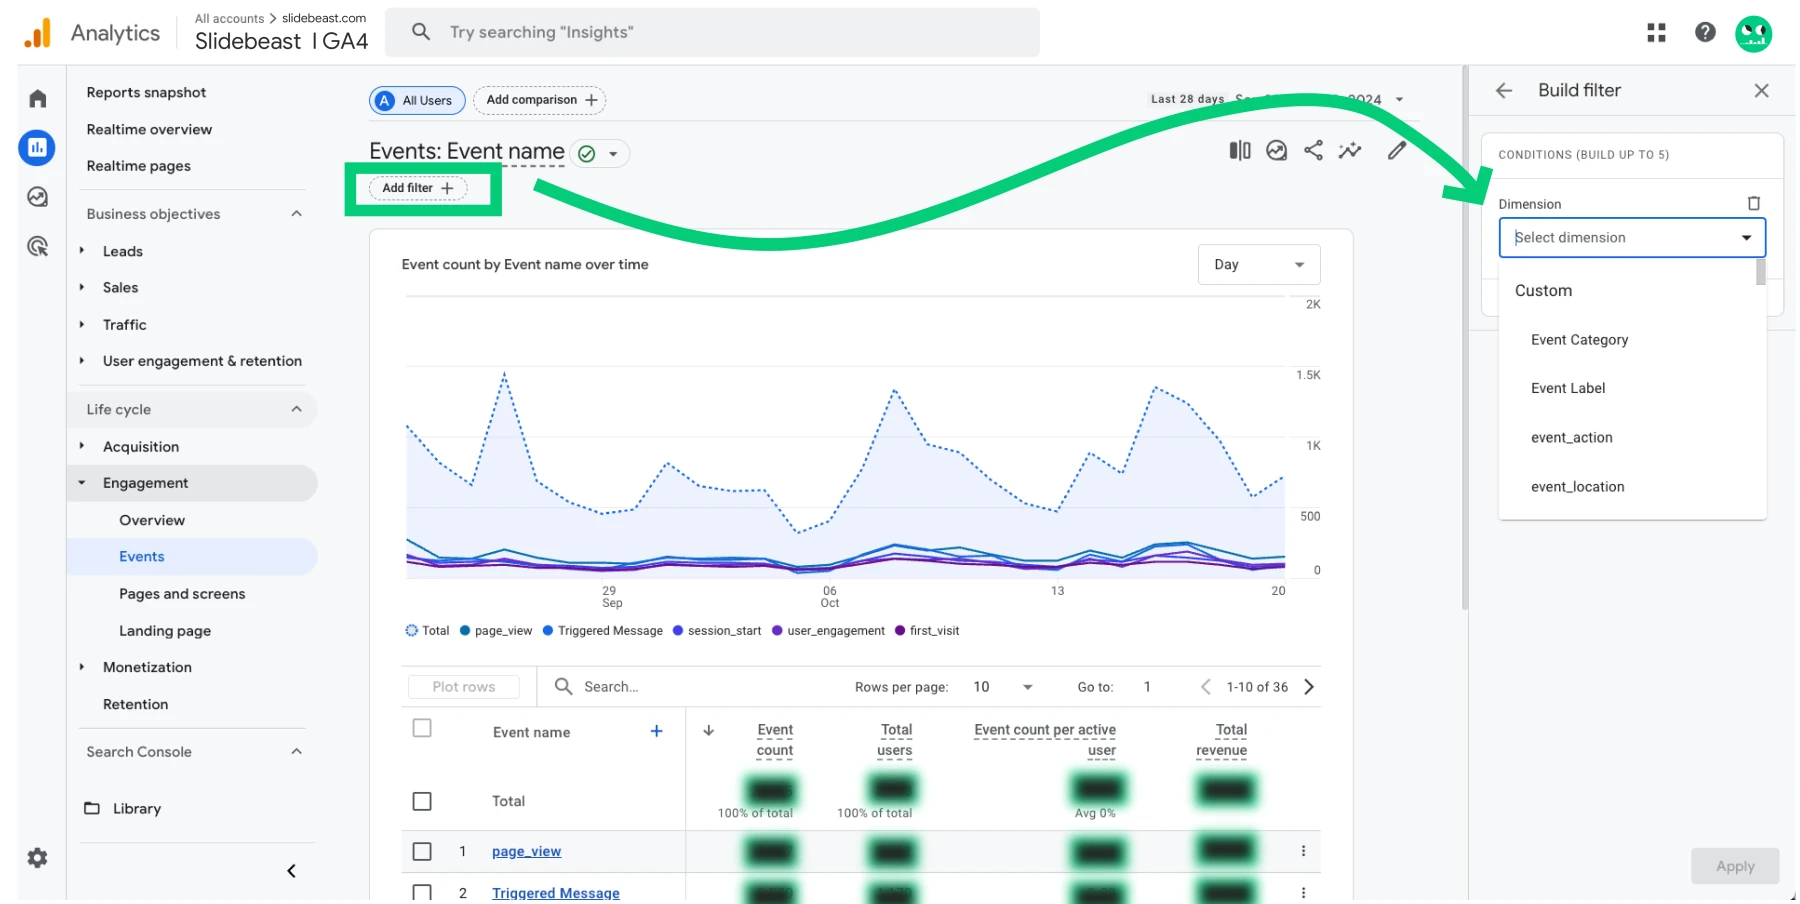
Filter by date, user segments, or specific pages to get deeper insights.
Filters are what make GA4 so powerful. They let you narrow down the data to find exactly what you’re looking for. Here are the main types of filters you should use:
- Date Range Filters: Use this to compare user behavior over specific time periods. For example, you can filter to see behavior this week vs. last week or compare month-over-month.
- User Segments: This allows you to segment your audience by specific behaviors or attributes. You could filter for new vs. returning users, traffic source (organic, paid, direct), or even device type (mobile, desktop). This is super useful for isolating behaviors and identifying trends in different audience groups.
- Page Filters: If you want to see how users interact with a specific landing page or a set of pages (e.g., product pages, blog sections), apply filters for those URLs. This is great for zooming in on specific areas of your site to analyze deeper behavior like conversion actions or engagement patterns.
- Event Filters: Want to track the performance of specific events? Use filters for custom or automatic events, such as "video play" or "button click" events, to see how users are interacting with particular features on your site.
- Demographic Filters: You can filter by user demographics like country, age, or gender. This helps identify whether certain audiences are engaging more than others or if there are regions that might need more attention.
And voilà! You’re now looking at your users’ digital footprints.
Key Metrics to Track for User Behavior Analysis

Not all metrics are created equal. Some tell you if users are happily browsing, while others scream, “Fix me now!”
Here are the key metrics to focus on for user behavior:
-
Engaged Sessions: This tells you how many users are actively interacting with your site. GA4 defines “engaged” as a session lasting 10 seconds or more, with multiple page views or conversion events.
-
Engagement Rate: It’s like a popularity score—how much of your traffic is actually engaged? A high engagement rate means users are sticking around, which is a good thing.
-
Scroll Depth: This shows how far down users scroll on a page. If your super-important CTA is at the bottom and no one’s seeing it, you’ll know why.
-
Top Events: GA4’s “Events” show user interactions, like clicks, video plays, form submissions, etc. These events give a clear idea of which actions are most common on your site.
-
Page Views and Screen Views: This helps you see which pages (or screens, if you're tracking mobile apps) are getting the most love.
Where is the Behavior Tab in Google Analytics 4?
Spoiler alert: It doesn’t exist—at least not in the same way it did in Universal Analytics (RIP). If you’re coming from the old version of GA, this might take a bit of getting used to.
In GA4, user behavior data is now part of the “Engagement” section we talked about earlier. So if you’re looking for behavior flow, you’ll need to use the Path Exploration report under the Explore tab. This lets you see how users navigate your site, which pages they go to next, and where they exit.
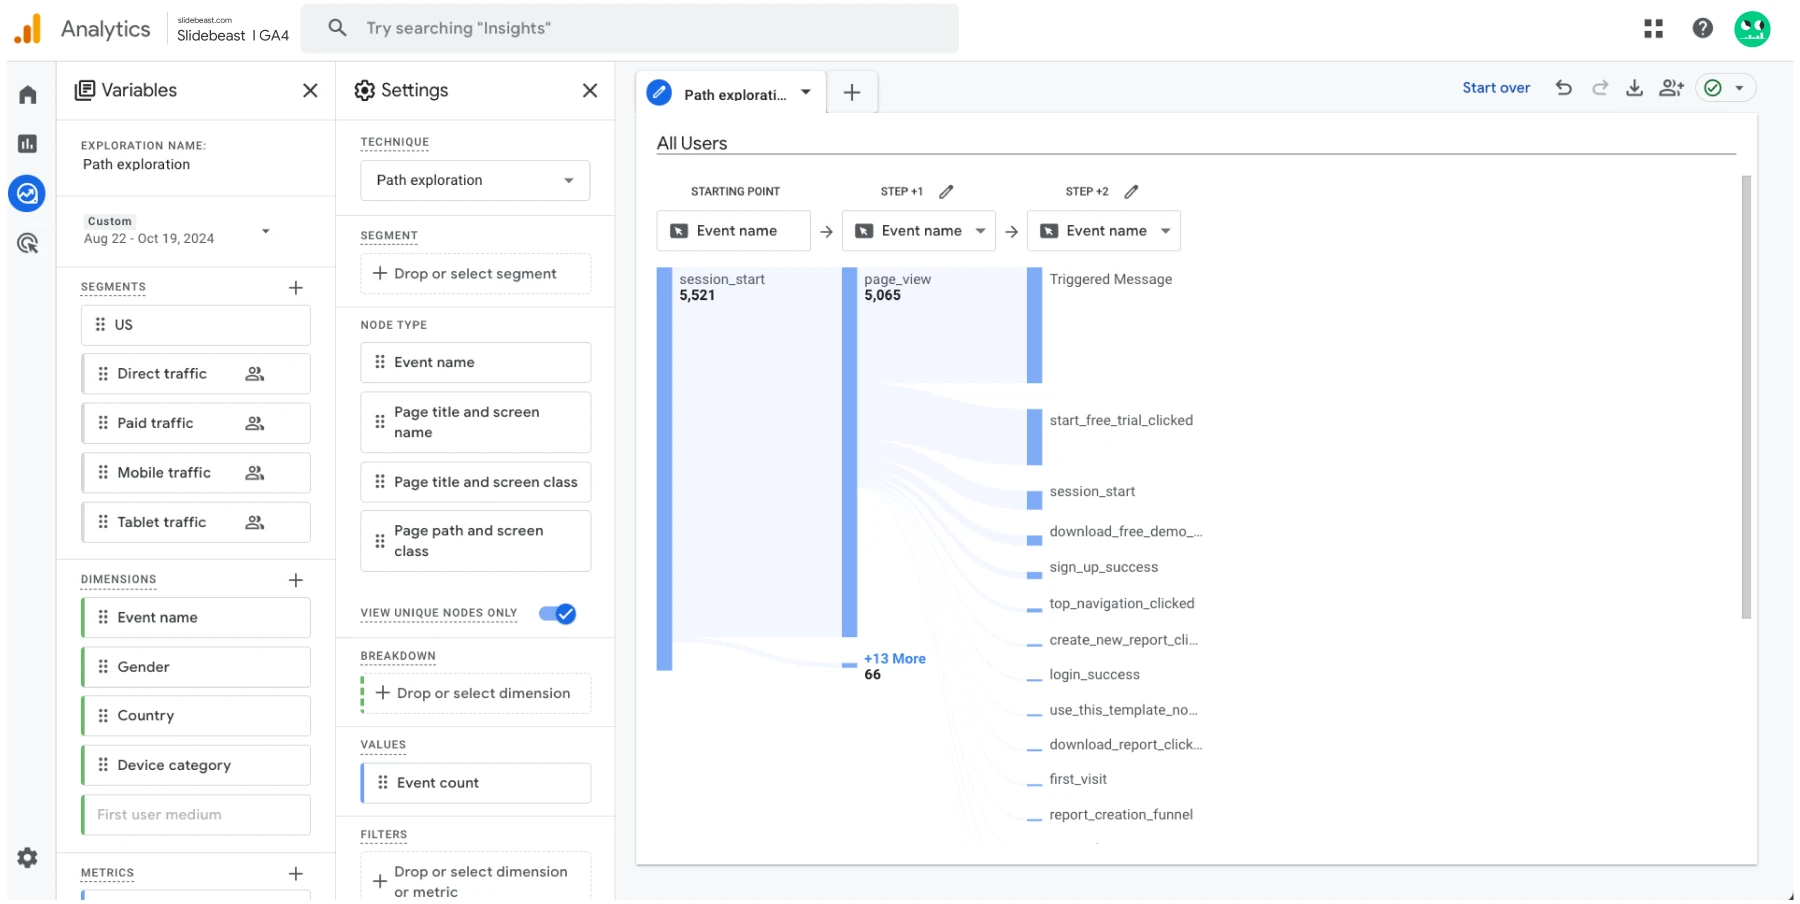
It might seem like a lot of digging, but once you find the right data, it’ll make analyzing user behavior a whole lot easier.
How to Create Custom Reports for Better Insights
GA4’s default reports are solid, but let’s be honest—they don’t always give you everything you need. Creating custom reports will help you zoom in on specific behaviors relevant to your business.
Here’s how to do it:

Go to the “Explore” tab (also on the left-hand menu). This is where all the magic happens. It’s like a blank canvas, waiting for you to create your masterpiece.
Choose a template or start from scratch: GA4 gives you options like “Free Form,” “Funnel Analysis,” and “Path Exploration.” Each one is useful for different types of behavior analysis, so pick what suits your goals.

Drag and drop your dimensions and metrics: This part feels like playing with Legos. You can mix and match data points to create reports that answer specific questions about user behavior.
Save your exploration: You don’t want to build these reports every time you log in. Once you’ve got your custom view, save it for easy access later.
Creating these custom reports helps, but let’s be honest: GA4 isn’t the most intuitive platform. It’s easy to get lost in a sea of menus, filters, and dimensions. Plus, setting up just the right report can take time and a bit of trial and error.
Enter Slidebeast: Your Shortcut to GA4 Reports
If all that GA4 setup sounds a little too involved—or maybe you're looking for a faster, easier way to get the right data—Slidebeast has got your back. With our Google Analytics 4 Audience Report Template, you can bypass the hassle of building reports from scratch.
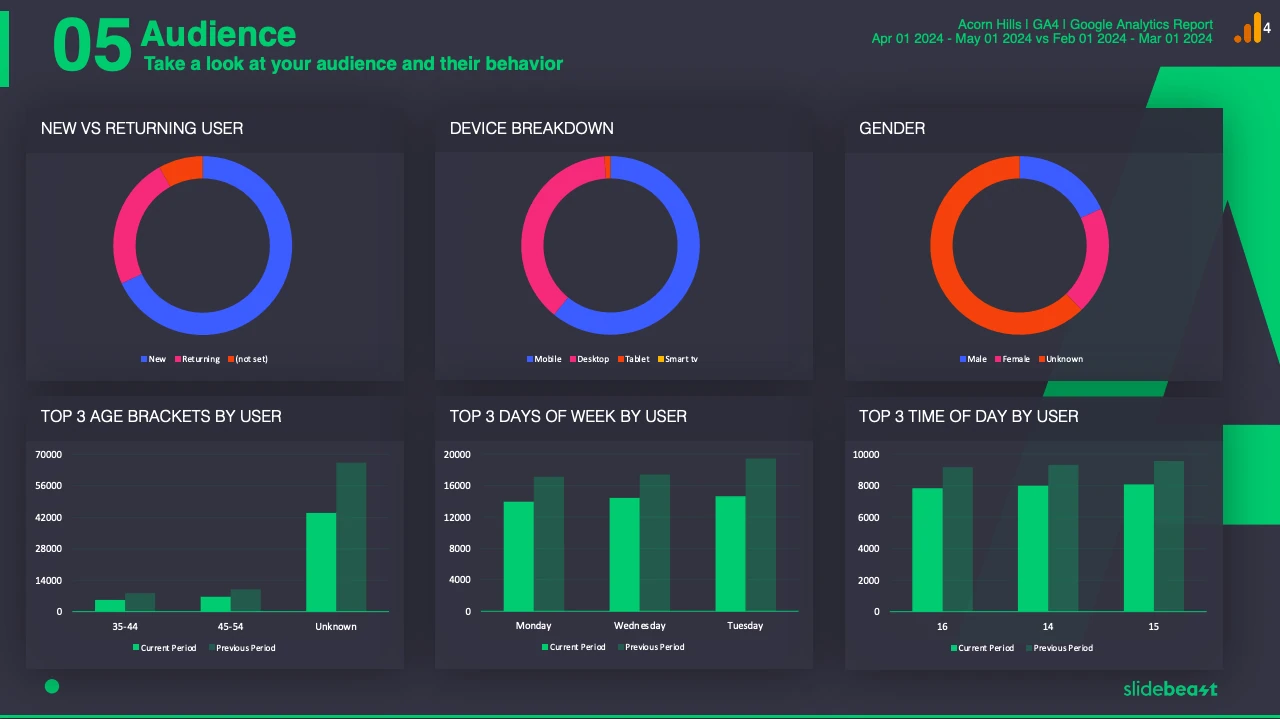
This template does all the heavy lifting for you. It’s designed to deliver key insights on your audience at a glance, so you can quickly understand who’s visiting your site and how they’re engaging with your content.
Here’s what the Audience Report Template offers:
- Key Indicators: Get a quick overview of the most critical metrics, like sessions, users, bounce rate and engagement rates.
- Audience Overview: Understand your user demographics at a glance—age, gender, device and interests.
- Users and Demographics Overview: Dive into who your audience is, broken down by relevant categories like location and devices.
- Audience Performance: See how different user groups are performing and interacting with your content.
- Day and Time Performance: Discover when your audience is most active and adjust your strategies accordingly.
- Geo: Top Countries & Cities: Identify where your traffic is coming from, helping you focus your efforts geographically.
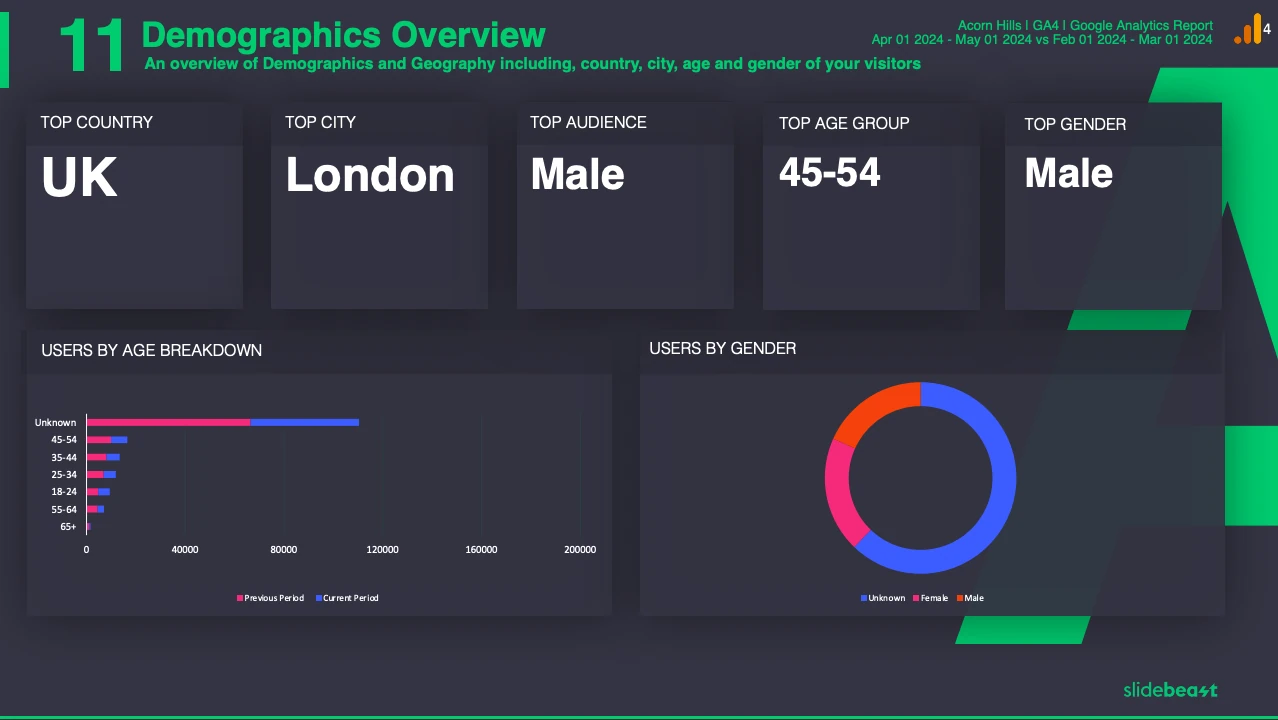
Setting this up manually in GA4 would take a lot of clicks (and a lot of patience). But with Slidebeast, you can generate these reports automatically, complete with customizable PowerPoint templates that are presentation-ready. You get to focus on insights—not data wrangling.
Why waste time building reports from scratch when Slidebeast can do it for you?
Start turning data into actionable insights with just a few clicks. With ready-made, customizable GA4 templates, you can focus on growing your business, not navigating the labyrinth of GA4.
Interested? Start your free trial of Slidebeast today and see how easy it is to generate the reports you need.
And hey, if you’re feeling adventurous, you can always create custom reports within GA4 itself—just don’t be surprised if Slidebeast saves you from a few headaches down the line!


