When it comes to understanding how your LinkedIn posts are performing, metrics like impressions are the starting point. But what exactly are LinkedIn impressions, and how can you leverage this data to make informed decisions? In this post, we’ll break down the key LinkedIn metrics you need to know, and how to analyze them effectively.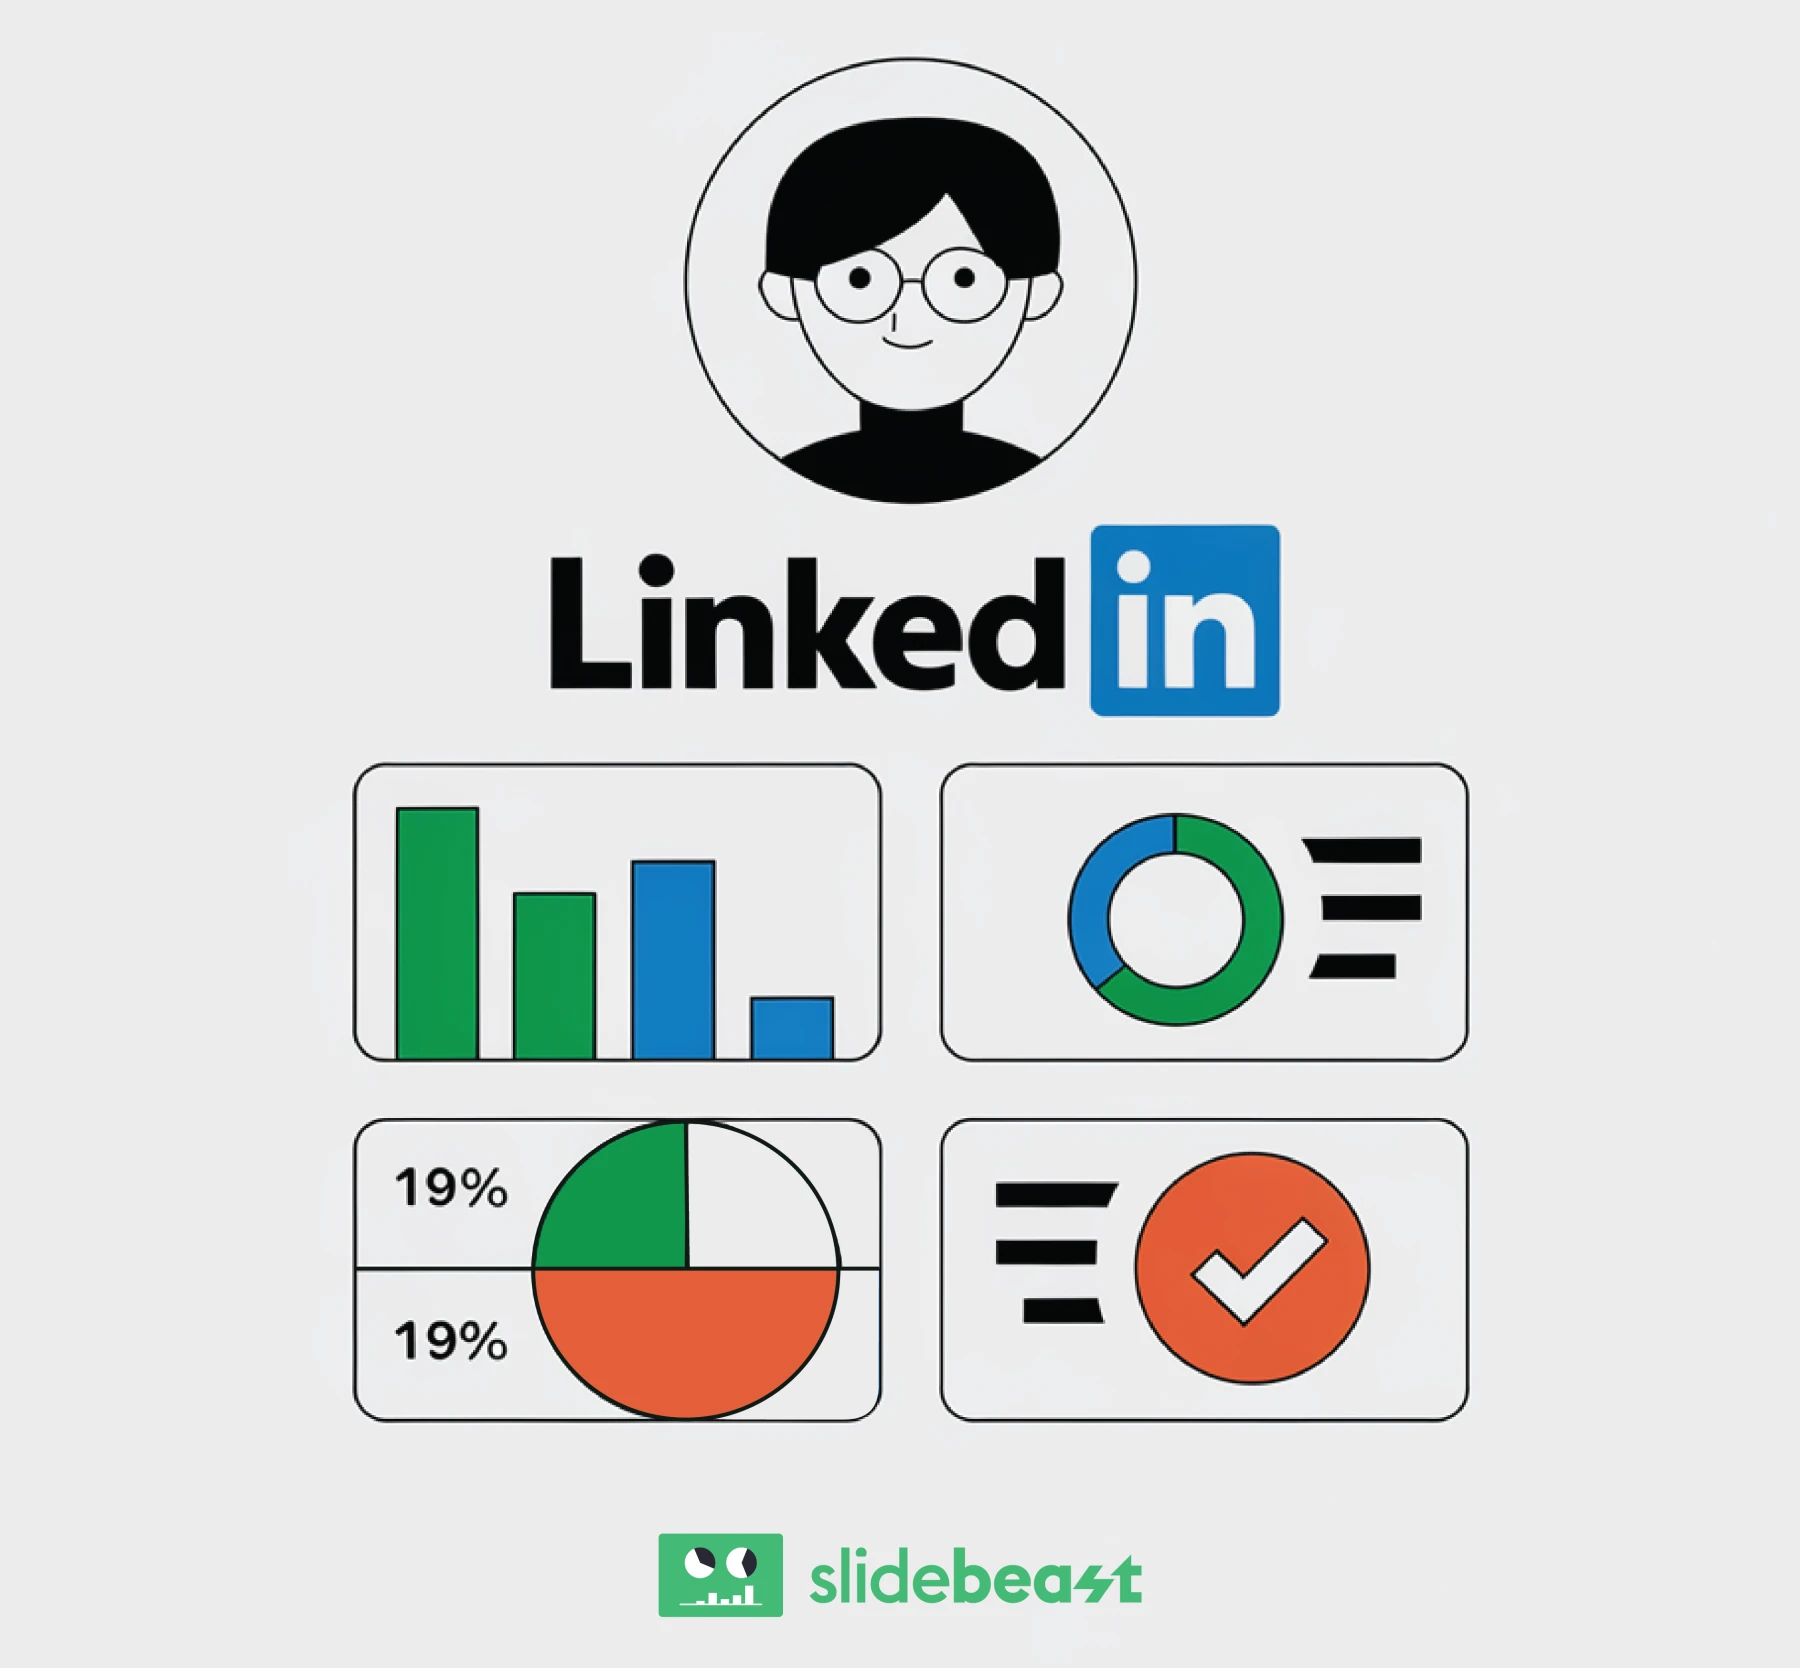
Impressions
Impressions refer to how many times your content is displayed on users' screens. Each time your post appears in someone's feed, it counts as an impression, whether or not they engage with it. This number gives you a sense of your content's reach, but it's just the beginning.
Unique Impressions
Unique impressions track the number of distinct users who have seen your post. Unlike impressions, this metric filters out multiple views from the same person, offering a clearer picture of how many people are actually seeing your content.
Engagement Rate
Engagement rate is one of the most telling metrics. It’s the ratio of interactions—likes, comments, shares—to the number of impressions. High engagement means your content resonates with your audience, while low engagement might signal the need to rethink your approach.
Clicks
This measures how many times someone clicked on your content, be it a link, image, or video. Clicks indicate interest and serve as a precursor to deeper engagement, such as visiting your website or learning more about your business.
Demographics
Understanding who is seeing your content is crucial. LinkedIn's demographic data provides insights into your audience’s location, job title, seniority, industry, and more. This data helps tailor future content to match the interests of your most engaged audience segments.
Followers Growth
Tracking your follower growth over time lets you see the long-term impact of your LinkedIn presence. Consistent growth is a good sign that your content strategy is on the right track and attracting the right kind of attention.
FAQs For LinkedIn Metrics:

-
What are post impressions on LinkedIn?
Post impressions refer to the number of times your post was visible on a user’s feed. This helps gauge how often your content is being shown. -
What are organic impressions on LinkedIn?
Organic impressions are the views your content receives without paid promotion. It reflects the natural reach of your posts. -
Is 1000 impressions on LinkedIn good?
It depends on your audience size and industry. For smaller networks, 1000 impressions can indicate solid engagement, but larger companies might aim higher. -
Why can't I see my analytics on LinkedIn?
You may not have admin access to the company page or post. LinkedIn analytics are only available to page admins and content creators. -
Does LinkedIn have an analytics dashboard?
Yes, LinkedIn provides an analytics dashboard for company pages, offering insights into post performance, engagement, and audience demographics.
How Do I See My LinkedIn Metrics?
2.webp)
You can access your LinkedIn metrics directly from your company page’s admin tools. LinkedIn provides analytics for posts, pages, and your overall company performance. From your dashboard, you can see detailed information on impressions, engagement, demographics, and more. However, manually tracking and analyzing this data can be time-consuming and limited in scope.
Best Reporting Tool for LinkedIn Metrics
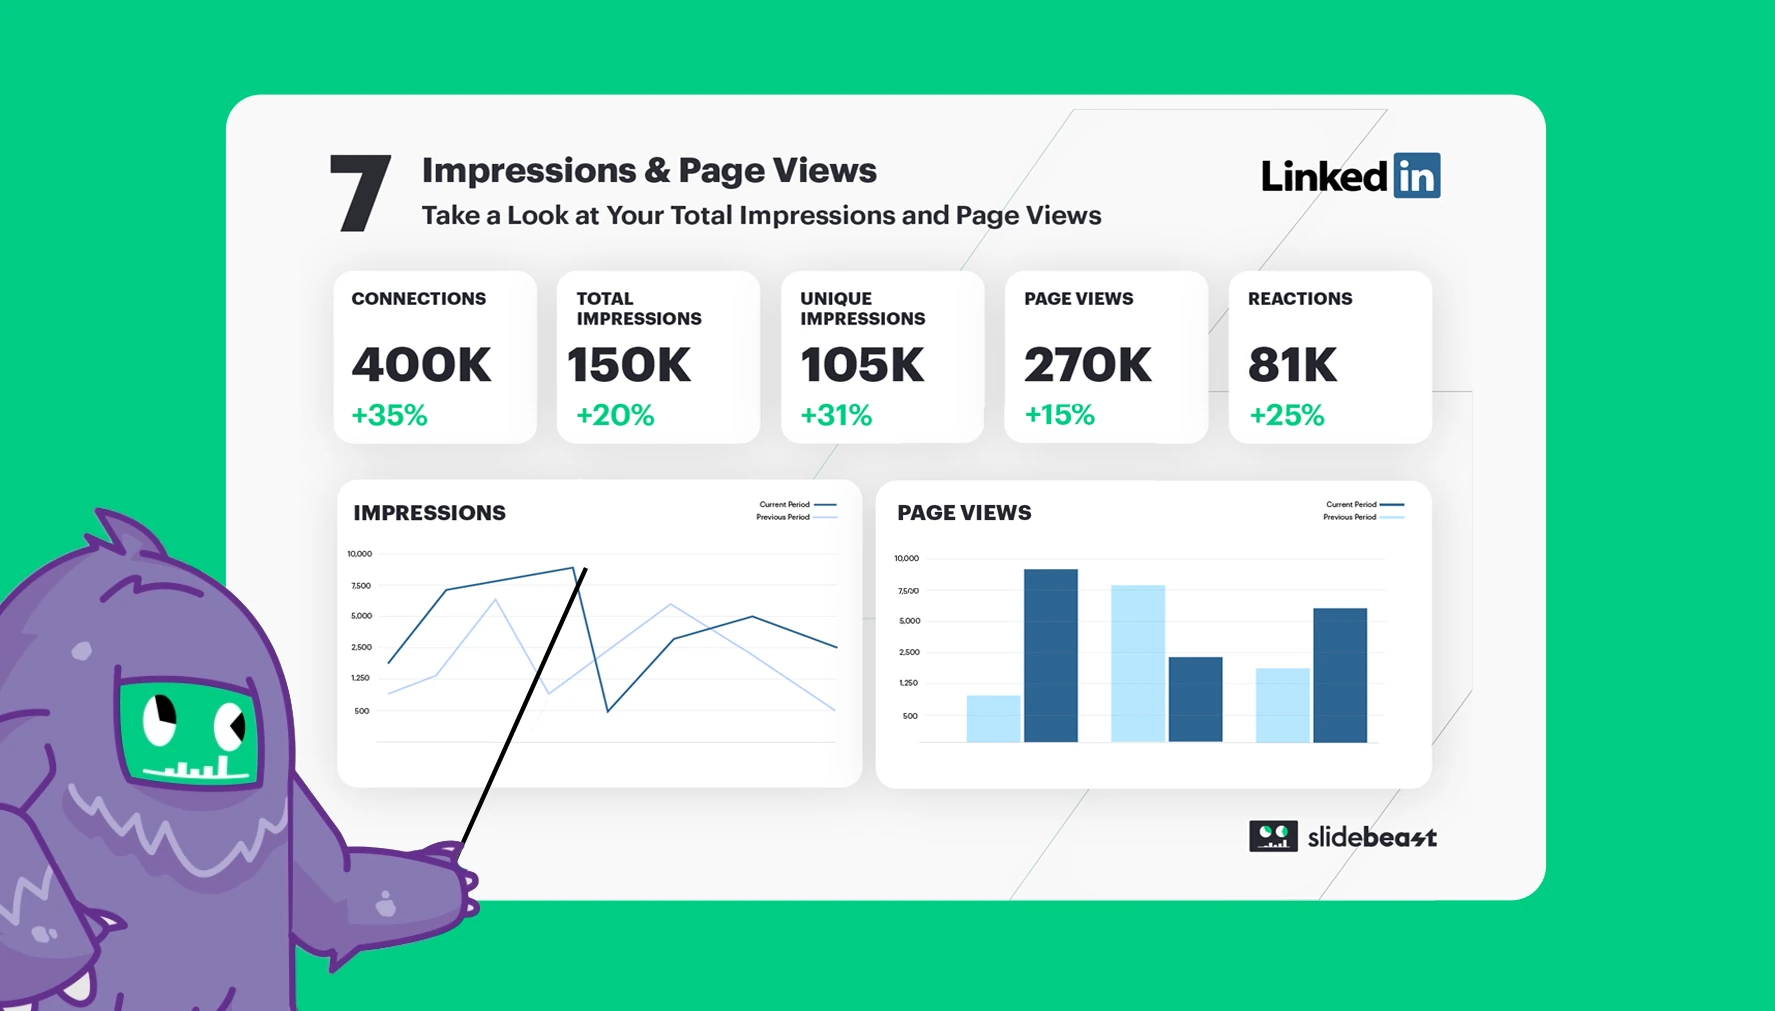
If you're looking for a way to streamline your LinkedIn performance analysis, Slidebeast is the tool you need.
With Slidebeast’s new LinkedIn integration, you can easily generate professional, in-depth reports on all the key metrics we discussed—impressions, engagement, demographics, and follower growth. Slidebeast automatically pulls data from LinkedIn, organizing it into custom slides and exporting it into PPTX formats, giving you a complete, polished report at your fingertips.
Here’s what Slidebeast’s LinkedIn reports include: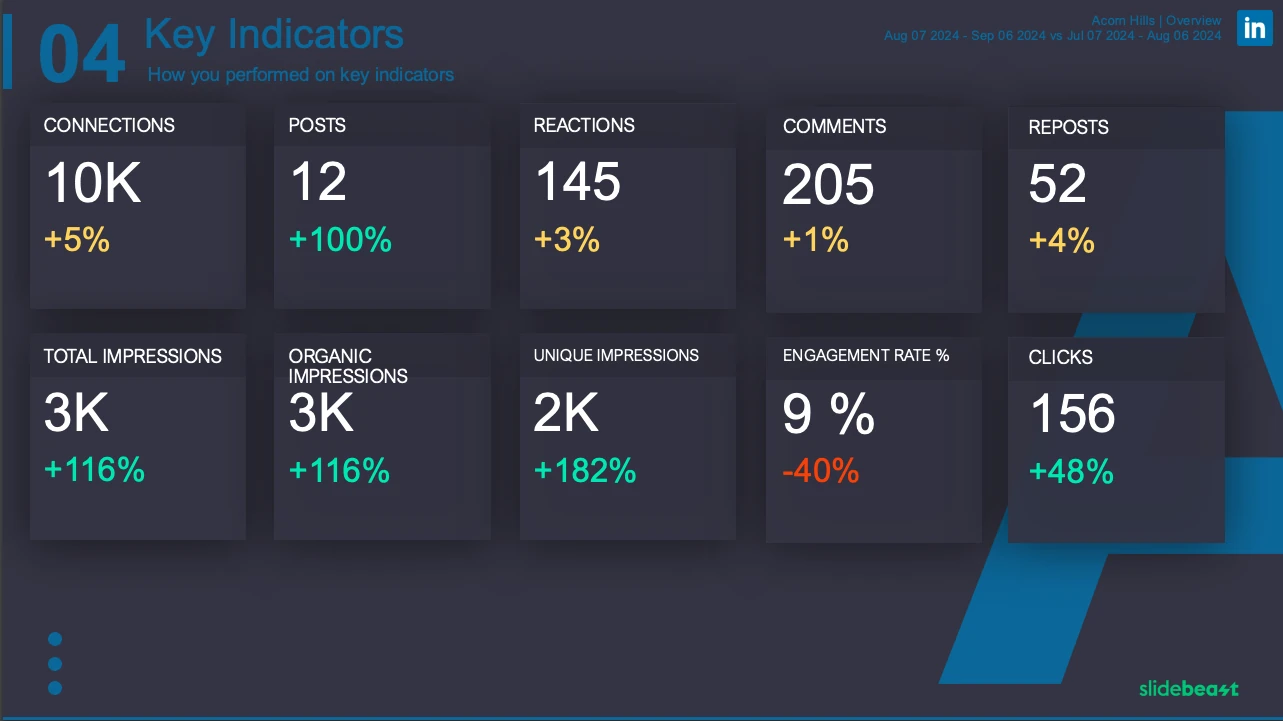
Overview: A top-level summary of your LinkedIn performance.
Engagement: Tracking metrics like engagement rate, reactions, comments, reposts, total clicks and more.
Impressions: Daily page views, daily impressions, and page tab impressions and more.
Visitor Metrics: Data on who is viewing your page, broken down by sectors, industries, seniority, and locations and more.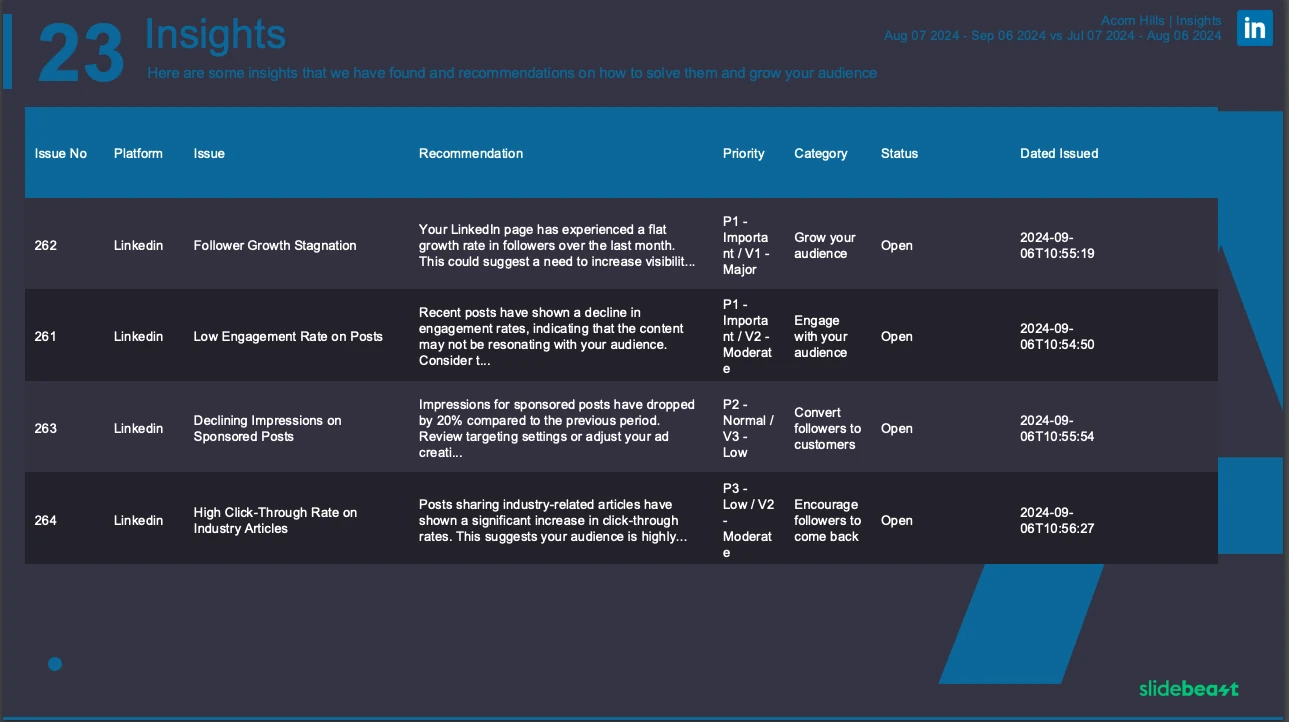
Insights: An additional section where you can input client-specific issues and recommendations, which are printed as the final pages in the report.
With Slidebeast, you'll not only save time but also gain deeper insights into your content performance, helping you refine your LinkedIn strategy and grow your audience more effectively. Ready to take your LinkedIn reporting to the next level? Start your free trial today!


