1. The Power of 24-Hour Stories: More Than Just Temporary
At first glance, Instagram and Facebook Stories may seem like simple, short-lived pieces of content. But behind their 24-hour lifespan lies a wealth of data and strategic opportunity. Stories allow brands to connect with their audiences in real-time, offering an authentic touchpoint while also serving as a powerful analytical tool. By interpreting story metrics accurately, you can craft not just attention-grabbing content, but content that drives meaningful engagement and results.

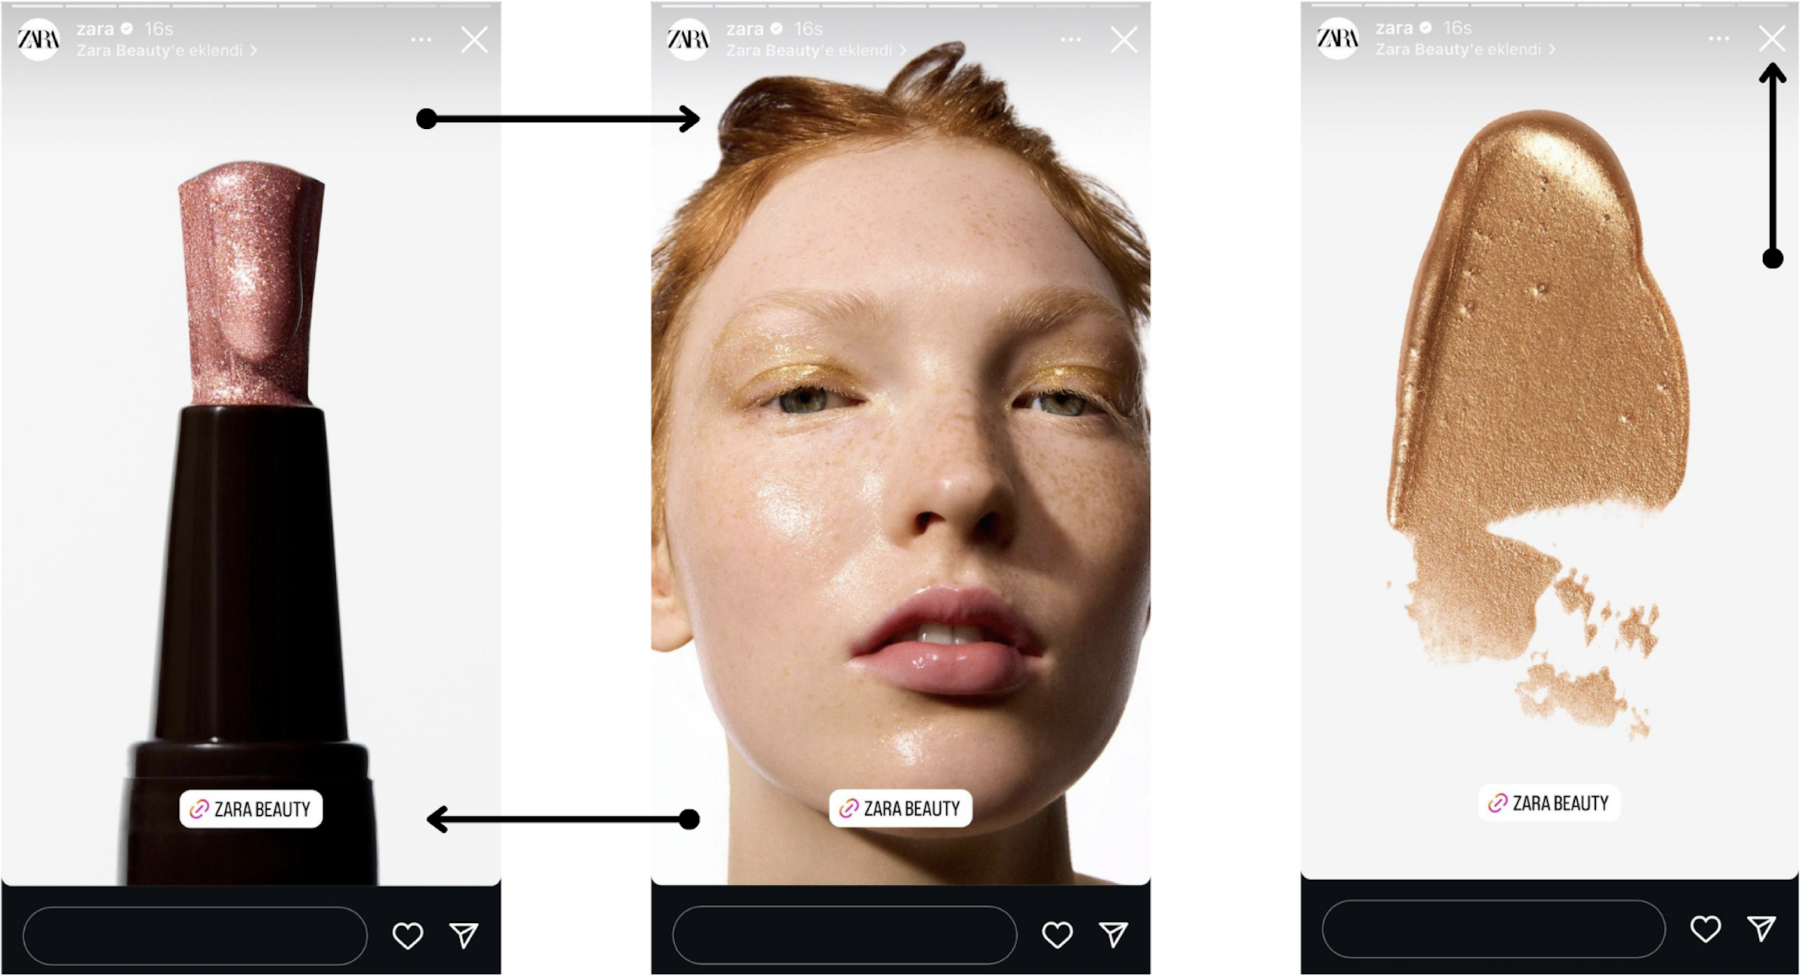
2. Decoding the Taps: Forward, Backward, and Exits
Story taps are one of the most telling metrics when it comes to user behavior:
• Forward Taps: If users are quickly skipping to the next story, it may indicate that the current one isn’t engaging enough.
• Backward Taps: A tap to return to the previous story often means the viewer found something worth revisiting — a great sign of engagement.
• Exits: If someone leaves your story altogether, it could suggest confusion, disinterest, or poor sequencing. Time to rethink that content flow.
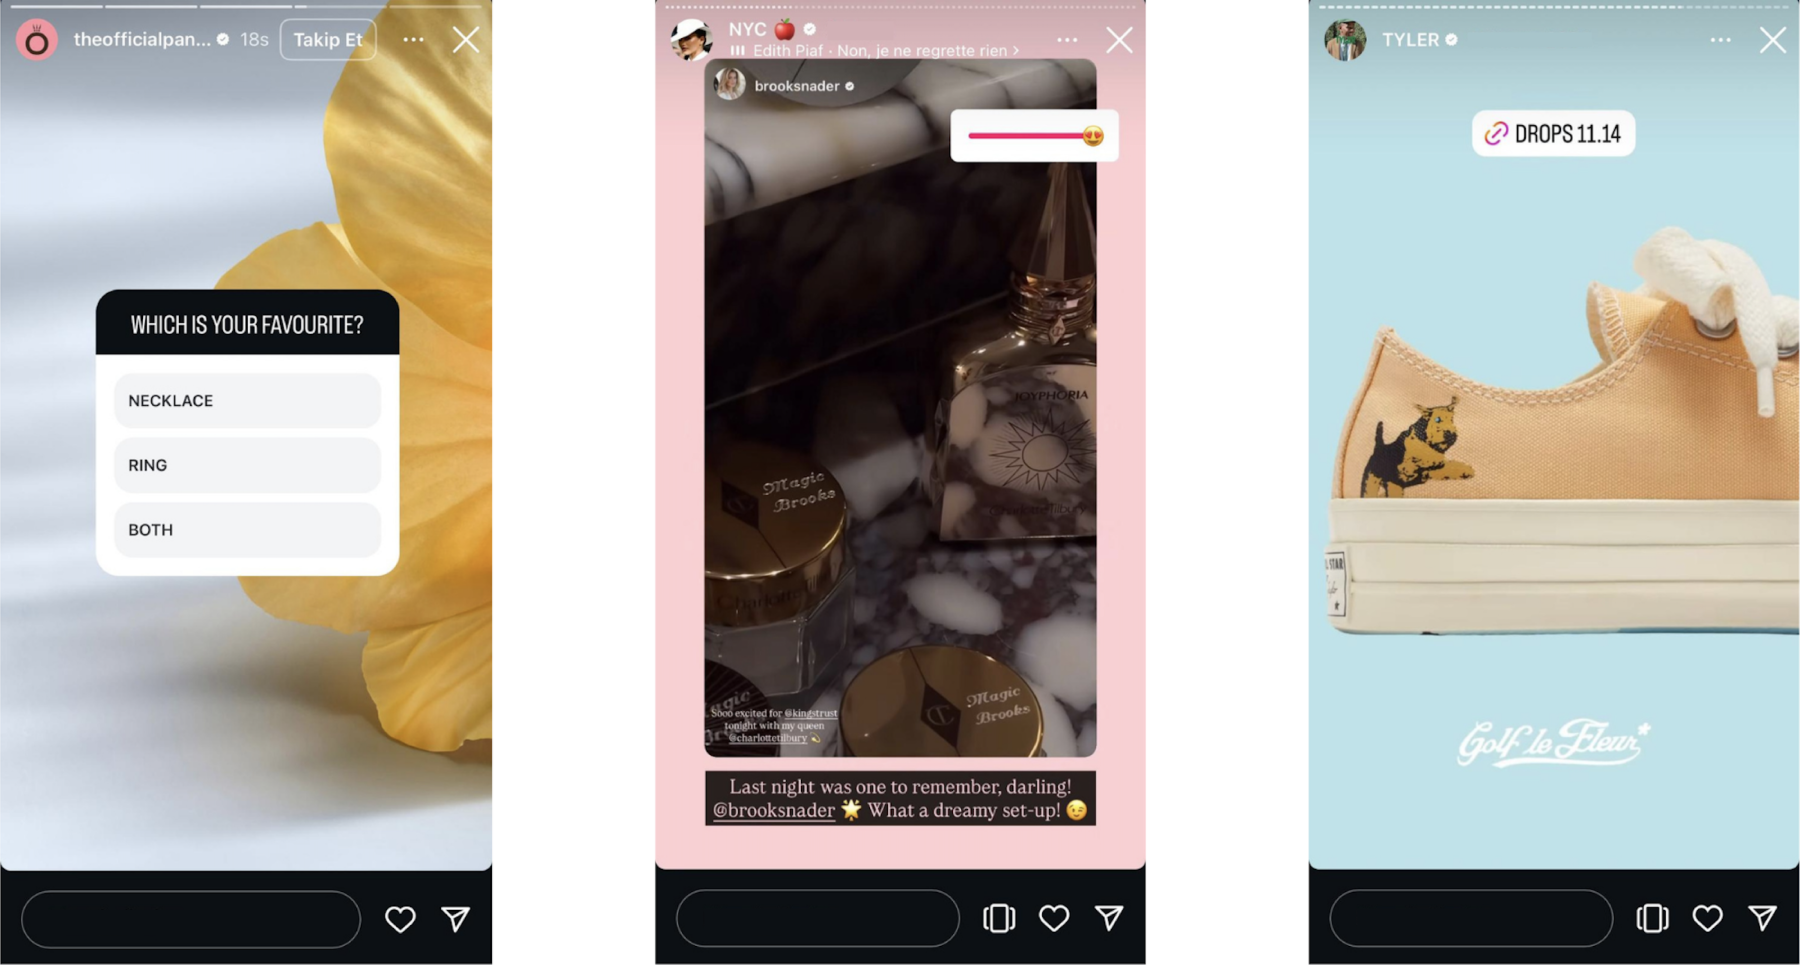
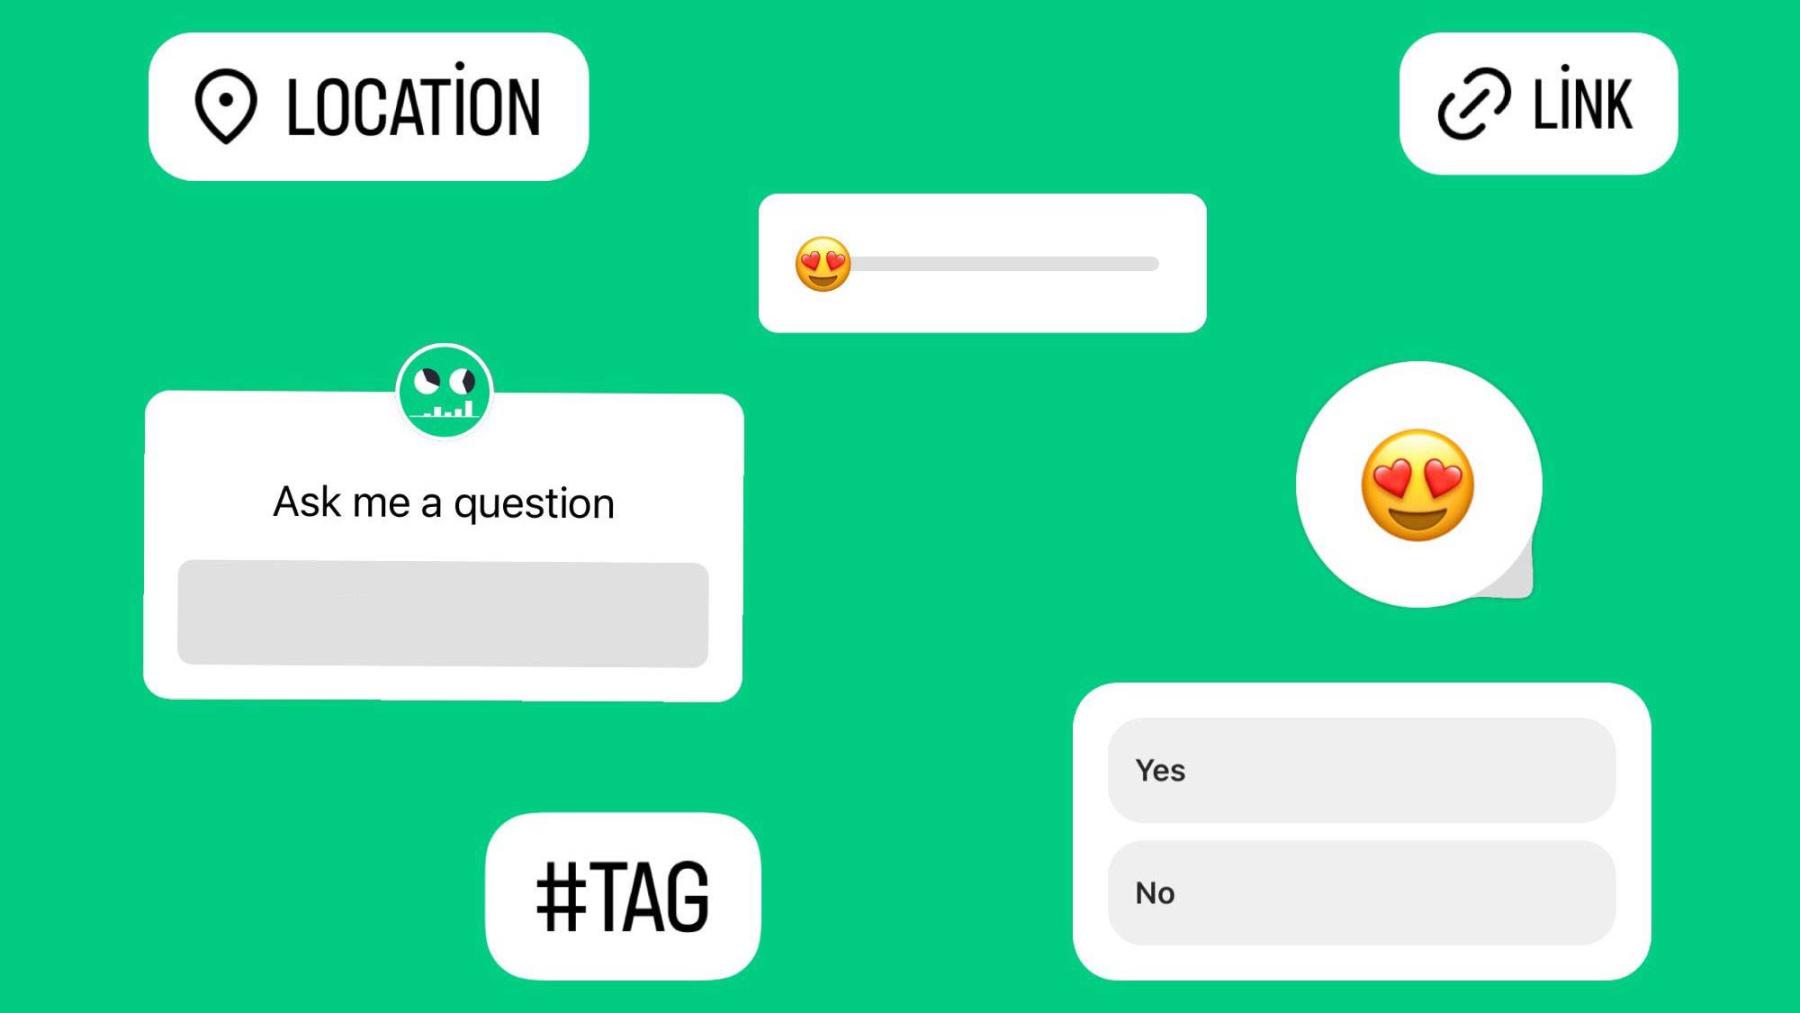
3. Sticker Engagement: Turning Passive Viewers Into Active Participants
Stickers aren’t just fun — they’re powerful engagement tools. Here are some top performers:
• Polls & Quizzes: Quick, interactive formats that encourage participation.
• Emoji Sliders: Great for gauging sentiment in a light, visual way.
• Link Stickers: Perfect for directing traffic to your website, shop, or blog.
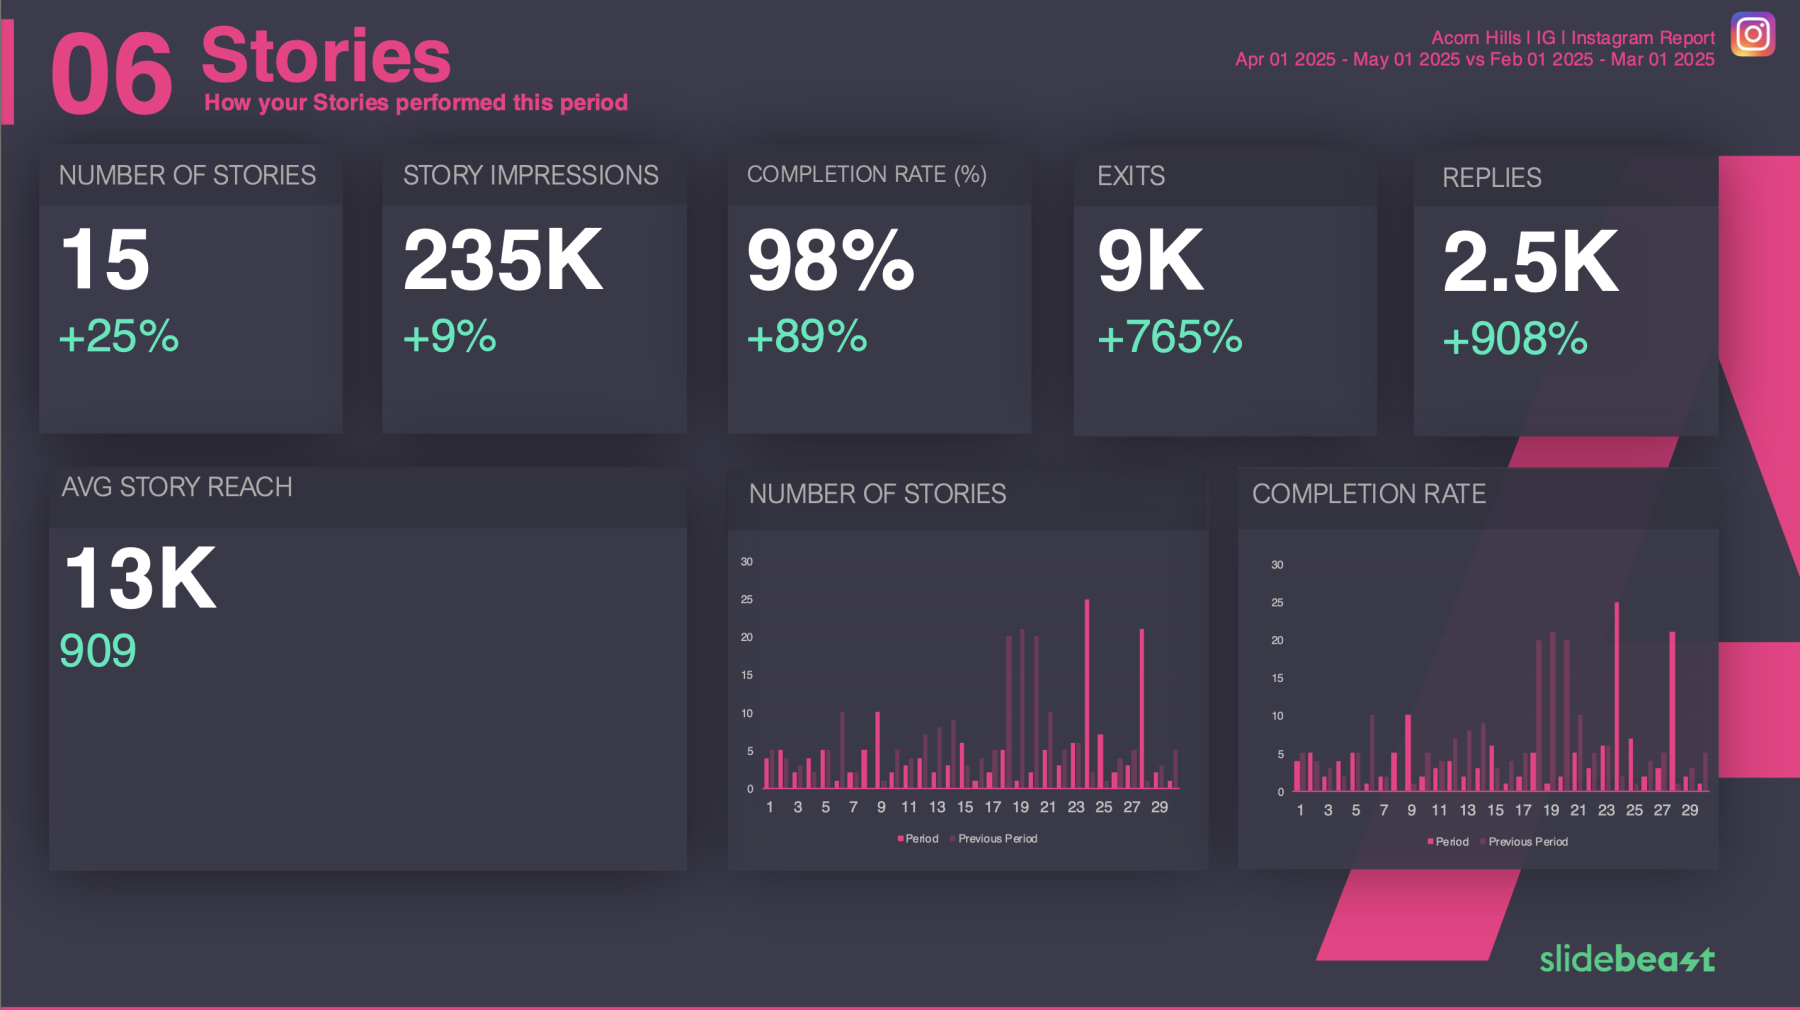
4. Additional Story Metrics to Keep an Eye On
• Reach & Impressions: Who’s seeing your content, and how often?
• Completion Rate: Are users watching your stories all the way through?
• Replies: Direct responses indicate interest and loyalty.
• Shares: A shareable story is one that resonates — pay attention to what’s getting reposted.
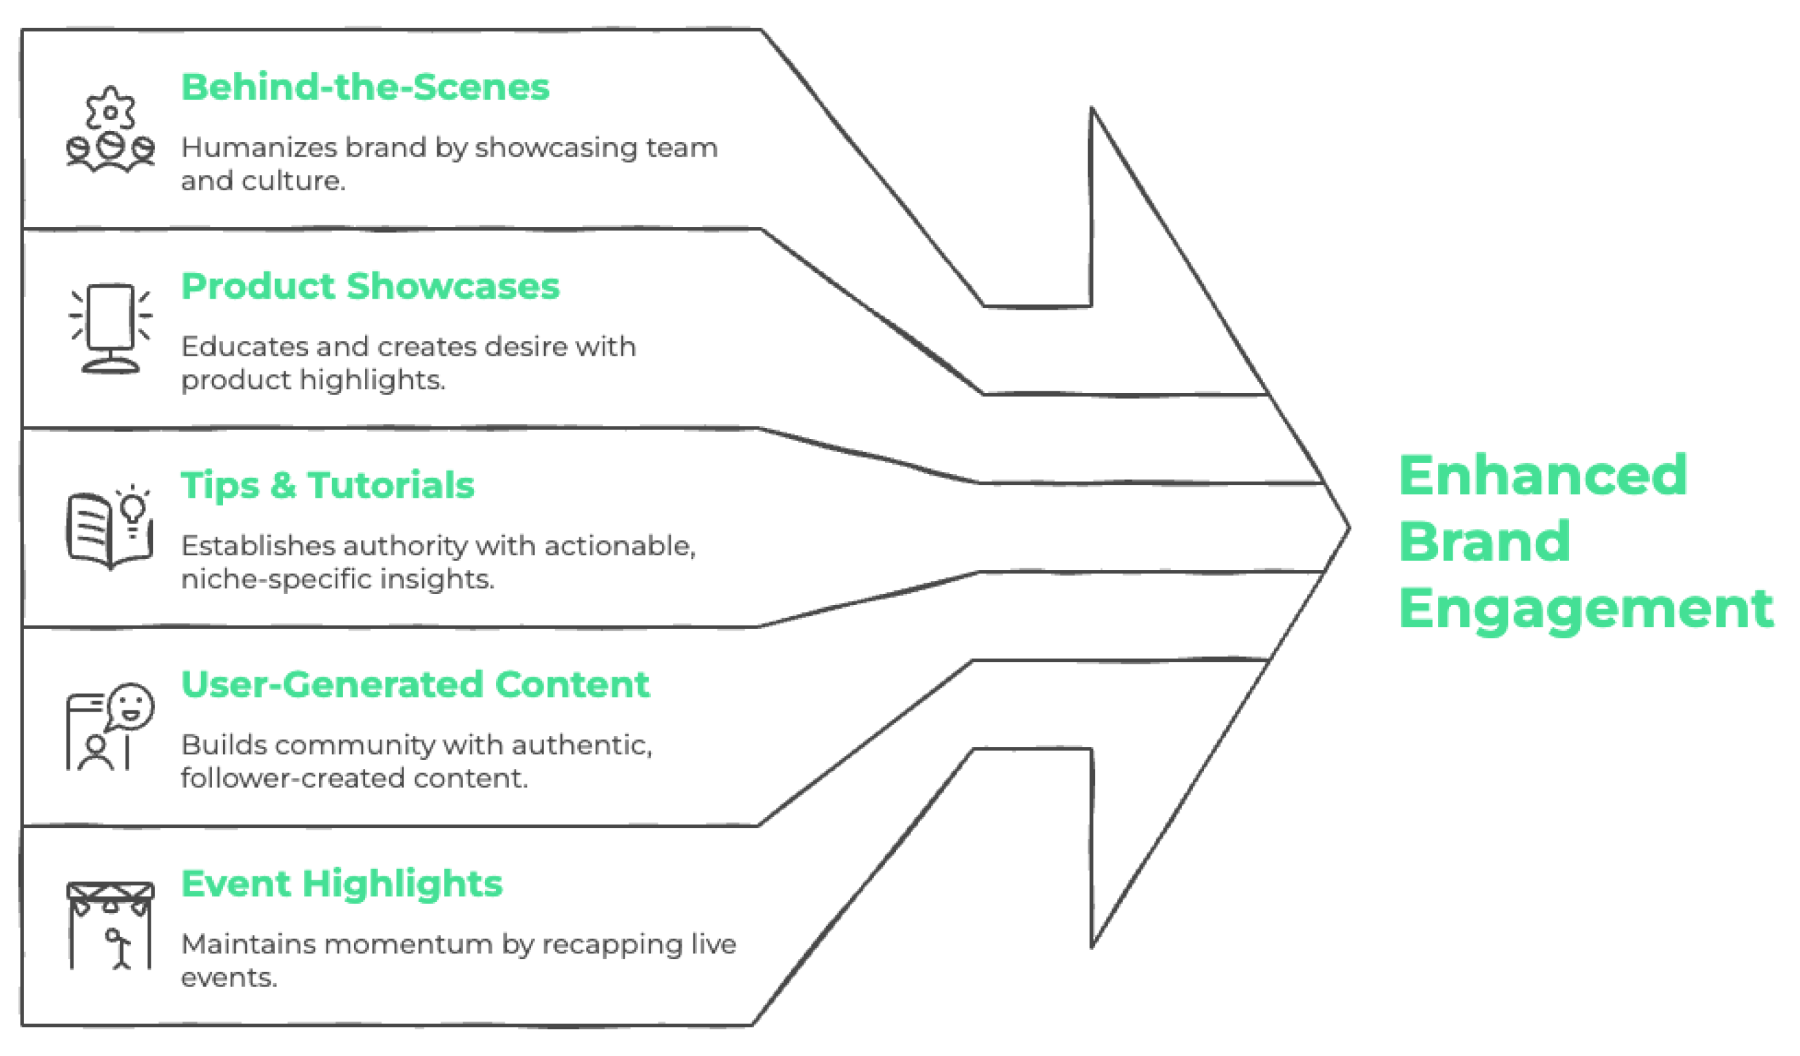
5. Different Types of Stories & How to Use Them Strategically
Mixing up your story formats can help you maintain interest and build a well-rounded strategy.
6. Timing Is Everything: Best Times to Post Stories
Timing has a direct effect on performance. Using Instagram Insights, you can discover when your followers are most active and schedule stories to maximize visibility and engagement. Posting when your audience is online ensures better reach and higher chances of interaction. Experiment with time slots and keep track of performance to find your brand’s sweet spot.

7. Story Highlights: Make Your Stories Last
Although stories vanish after 24 hours, Highlights let you pin key content to your profile permanently. This helps reinforce brand storytelling and ensures your best work stays visible. Organizing your Highlights by theme — like “Tips,” “New Arrivals,” or “Events” — makes it easier for new visitors to find relevant content quickly.
8. CTA Analysis: Drive Action Through Stories
“Tap the link,” “DM us,” “Vote now” — these calls to action matter. Analyzing which CTAs perform best helps you optimize future content for conversions. Don’t be afraid to test different phrasing, placement, or even sticker styles to see what prompts the most engagement.
9. A/B Testing with Stories: What Works Best?
Try presenting the same message in different styles — vary your imagery, copy, or sticker use — and compare the results. You’ll quickly learn what resonates most with your audience. Over time, this practice can help you refine your visual tone, pacing, and story structure to match your brand’s voice and your audience’s preferences.
10. Industry Benchmarks: Know Where You Stand
Comparing your performance against industry standards gives you context for your results and highlights areas for growth. It’s a smart way to measure progress over time. Keep an eye out for average completion rates or tap-back metrics in your industry to determine if your strategy is on track or needs a refresh.
Make It Actionable with the Instagram Stories Performance Report Template
Understanding your Stories metrics is powerful — but turning them into a clear, shareable report? That’s where the magic happens.
Our Instagram Stories Performance Report Template Template is designed to help marketers like you track key metrics such as forward/backward taps, exits, and sticker interactions — all in one visual, ready-to-present format. Whether you’re optimizing daily content or reporting to stakeholders, this template makes your Story data easy to read, understand, and act on.
Pair it with the insights from this guide, and you’re not just watching your Stories — you’re learning from them.
Understanding your Stories metrics is a smart first step toward creating more meaningful content — and Slidebeast is here to help you make sense of it all. With ready-to-use templates, automated insights, and powerful visuals, reporting becomes less of a chore and more of a creative advantage. Try turning your Story data into action today with Slidebeast. 🚀
We hope this article gave you a fresh perspective on how to read and respond to your Instagram and Facebook Story performance. Have questions or need help? Drop us a line at support@slidebeast.com — we’re always happy to assist.
Happy Storytelling! 📱✨