What is an interaction?
An interaction is any touchpoint with an element on a website. These are defined by Analysts or Google Analytics Users and can be clicks, hovers, scrolls, etc.
Interaction rate is the percentage of people that interact (click, hover, tap) with an element.
Interaction rate is a very useful measure in the Product Analytics world and helps analysts find areas on websites or apps where the customer may be having trouble.
Let’s say that a Software Engineer notifies us that some of the Add to Cart buttons on the website stopped working and we need to know what percentage of sessions usually use this element so that the development team can understand how urgent getting this button fixed is.
This metric can also be used to offer insight on why a user may or may not convert and can be used as a key performance indicator for goals and objectives.
Need to know information
There are 3 main metrics captured in Google Analytics (Universal): total events, unique events, and a trickier metric to get your head around, unique dimension combinations.
These metrics are commonly analyzed using 3 dimensions: Event Category, Event Action, and Event Label.
What’s the difference between the event metrics?
To understand what users are doing on websites and apps we can look to the three event metrics: total events, unique events, and unique dimension combinations, but what’s the difference?
Let’s take a look at an example with data from a sock website. We’ll be looking at interactions with a product component.
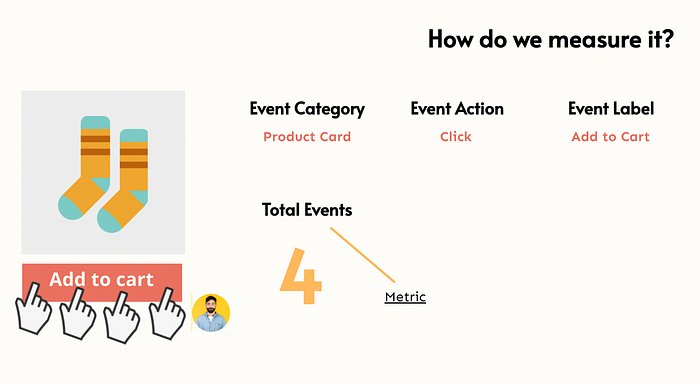
If a user clicks on the Add to cart button 4 times, the event will be sent or ‘Fired’ 4 times to Google Analytics and the Total Events metric will be 4.
If another user also clicked on the Add to cart button 4 times, the Total events for this button would be 8. Google Analytics increments the Total Events metric by the number of times the tracking combination has fired.
Tracking combination:
Event Category: Product Card
Event Action: Click
Event Label: Add to cart
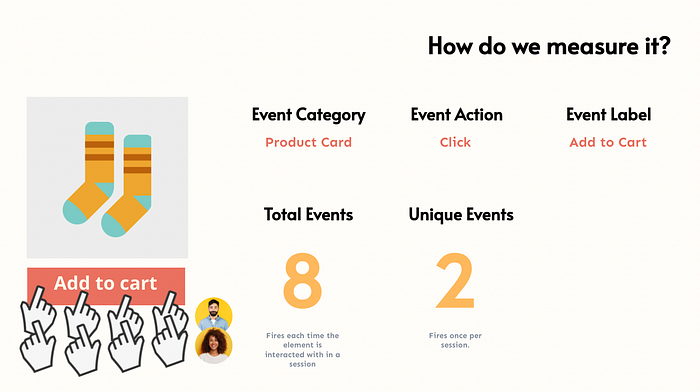
For unique interactions, Google Analytics counts 1 for the first time the event is fired in the session with these dimension values and ignores any additional events with the same values.
So in the case of our Add to Cart button, Unique Events would be 2, one for each customer that clicked within a session. The Total Events metric counts each time the value is sent.
Next, we have Unique Dimension Combinations. This metric counts the number of unique dimension-value combinations for each dimension in a report. This metric will often be close to the value of Unique Events in most cases but can differ depending on the dimensions you use.
Unique Dimension Combinations allow you to combine or group dimensions without needing to update or add additional tracking.
When should you use Unique Dimension Combinations?
Understanding how events fire on your website will help you with figuring out which metric to use.
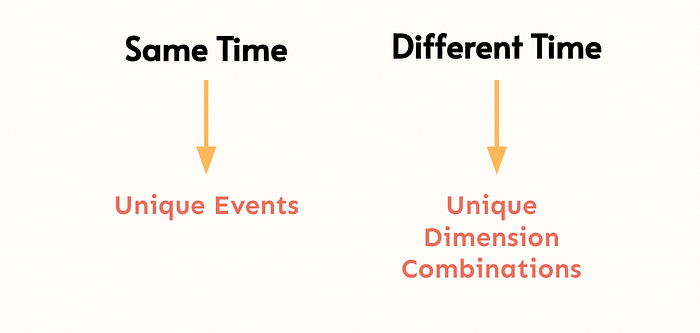
- If the events are sent to Google Analytics at the same time, Unique Events will match with the Unique Dimension Combinations metric.
- If the events are sent to Google analytics at different times within the session, these metrics will not match and Unique Events will be inflated.
- If in doubt, always use Unique Dimension Combinations, as this should be correct in both circumstances.
Calculating Interaction Rate
If we wanted to understand how many people interact with the Add to Cart button we would first take a look at all of the sessions who have seen the page where the element lives. In Google Analytics you can create a segment for the page where the interaction takes place to find the number of sessions.
Next, we will find out how many Unique Dimension Combinations there are for the event category, action, and label for the event that fires for Add to Cart on the Sock product page.
Create a custom report with Page, Event Category, Event Action, Event Label by Unique Dimension Combinations to find this number.
In this example, 100 sessions saw the Sock product page and 80 Unique Dimension Combinations were sent to GA for the interaction of Click Add to Cart.
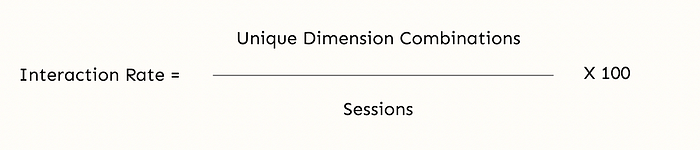
Now we can divide unique dimension combinations by Sessions * 100 to calculate the interaction rate. The answer for our example would be 80%.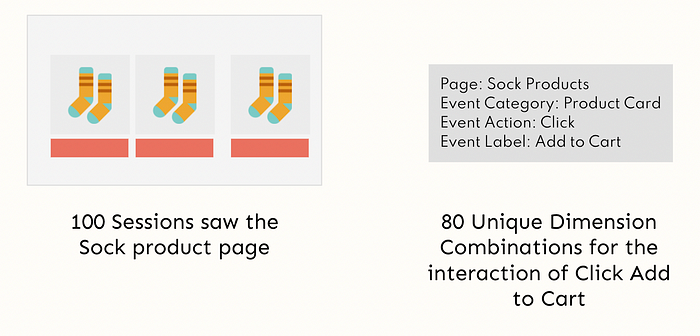
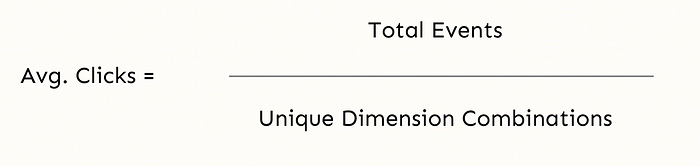
Another useful measure is the average number of times an element is interacted with, within a session. (Avg Clicks) This is used to understand pain points.
If an element that should only be clicked once or twice has a high number of avg. clicks this can be an indication of either the user becoming stuck or clicking out of frustration.
Let’s Recap
What is interaction?
The analysis of behavioral events captured using tags on a website.
Where can I find events in Google Analytics?
In a custom report or stored under Behaviour > Events in the interface.
Main metrics
- Total Events
- Unique Events
- Unique Dimension Combinations
What are Unique Dimension Combinations and when should I use them?
The unique number of sessions that have interacted with a combination of events.
Best practice — use all the time when measuring unique interaction.
Happy analyzing!👩🏽💻📈