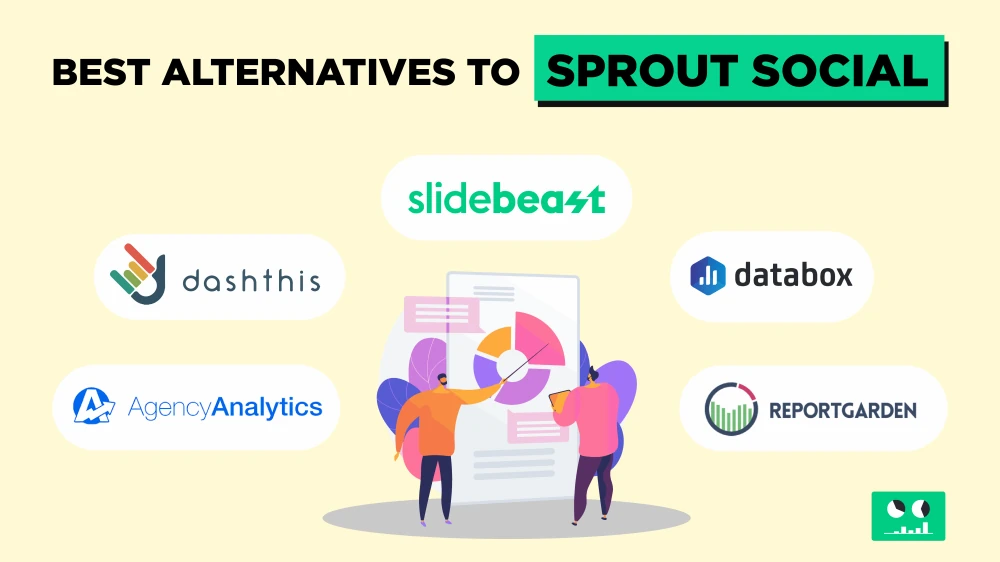
When it comes to social media analytics and reporting, Sprout Social is a well-known name, offering a comprehensive suite of features for managing and analyzing social media performance. However, it might not be the perfect fit for everyone, especially if you're looking for specific features or more cost-effective solutions. In this post, we'll explore some top alternatives to Sprout Social, focusing on tools that excel in social media reporting and highlighting where they stand out.
Before we start, feel free to jump right in:
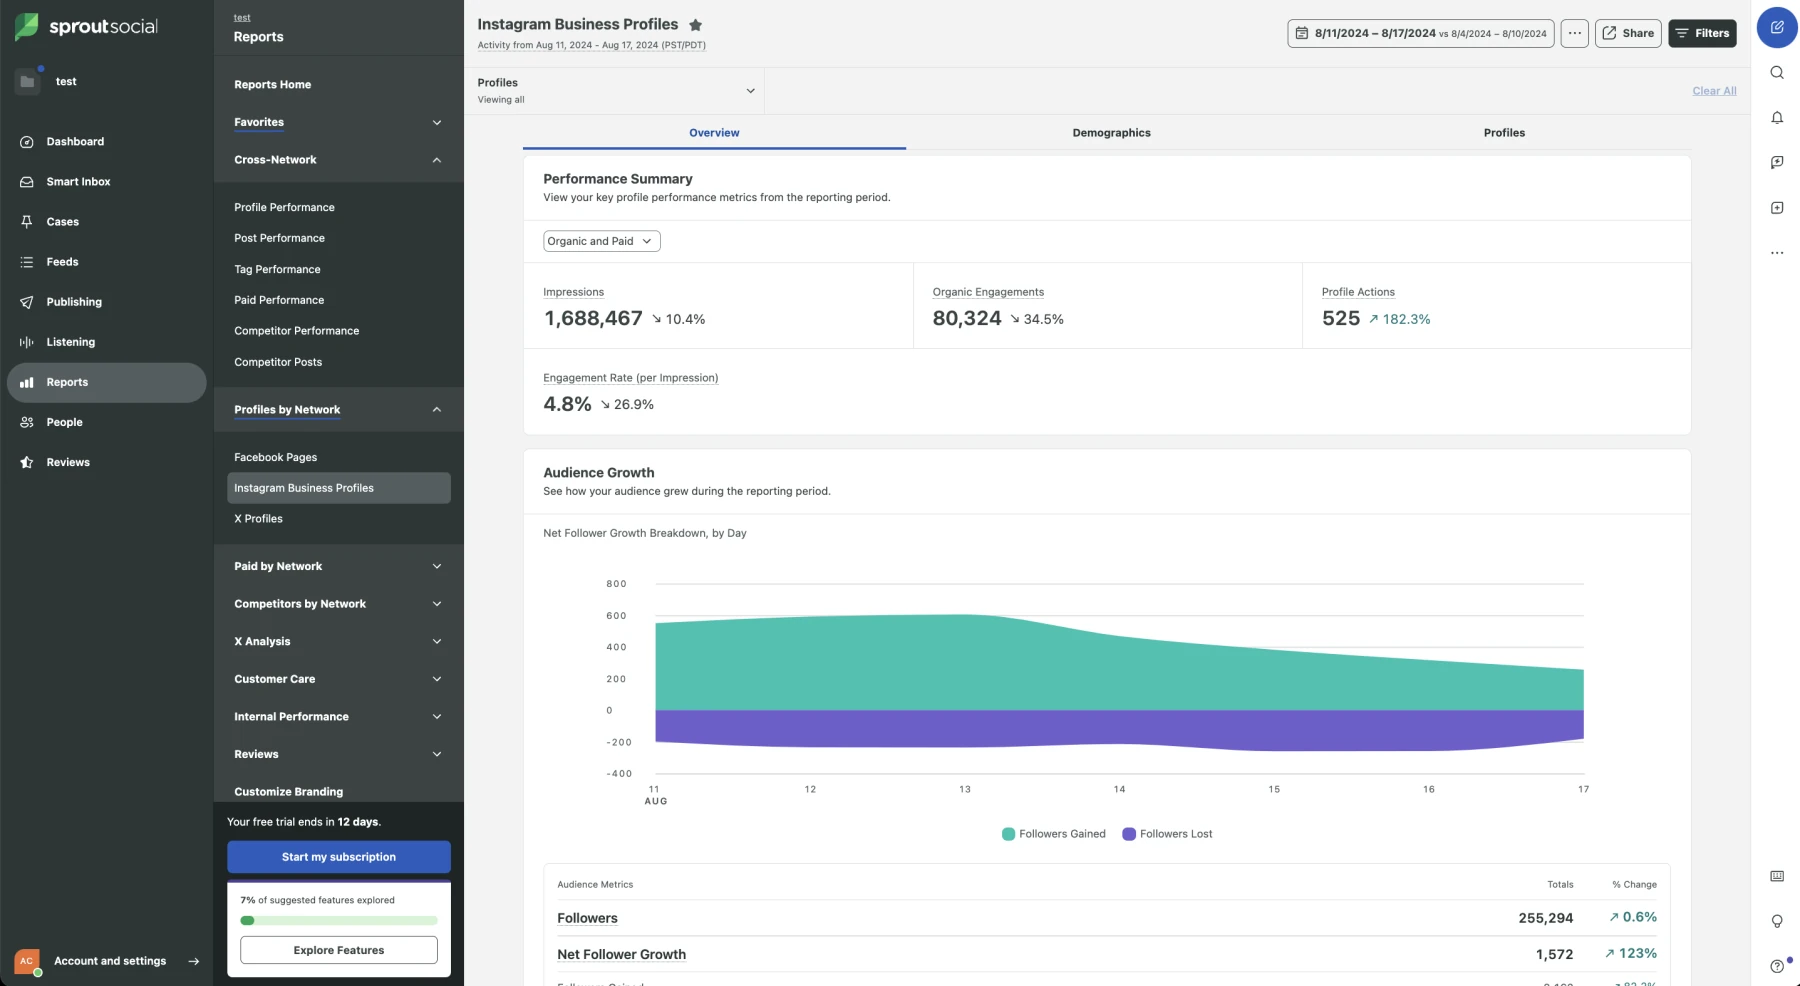
1. Sprout Social
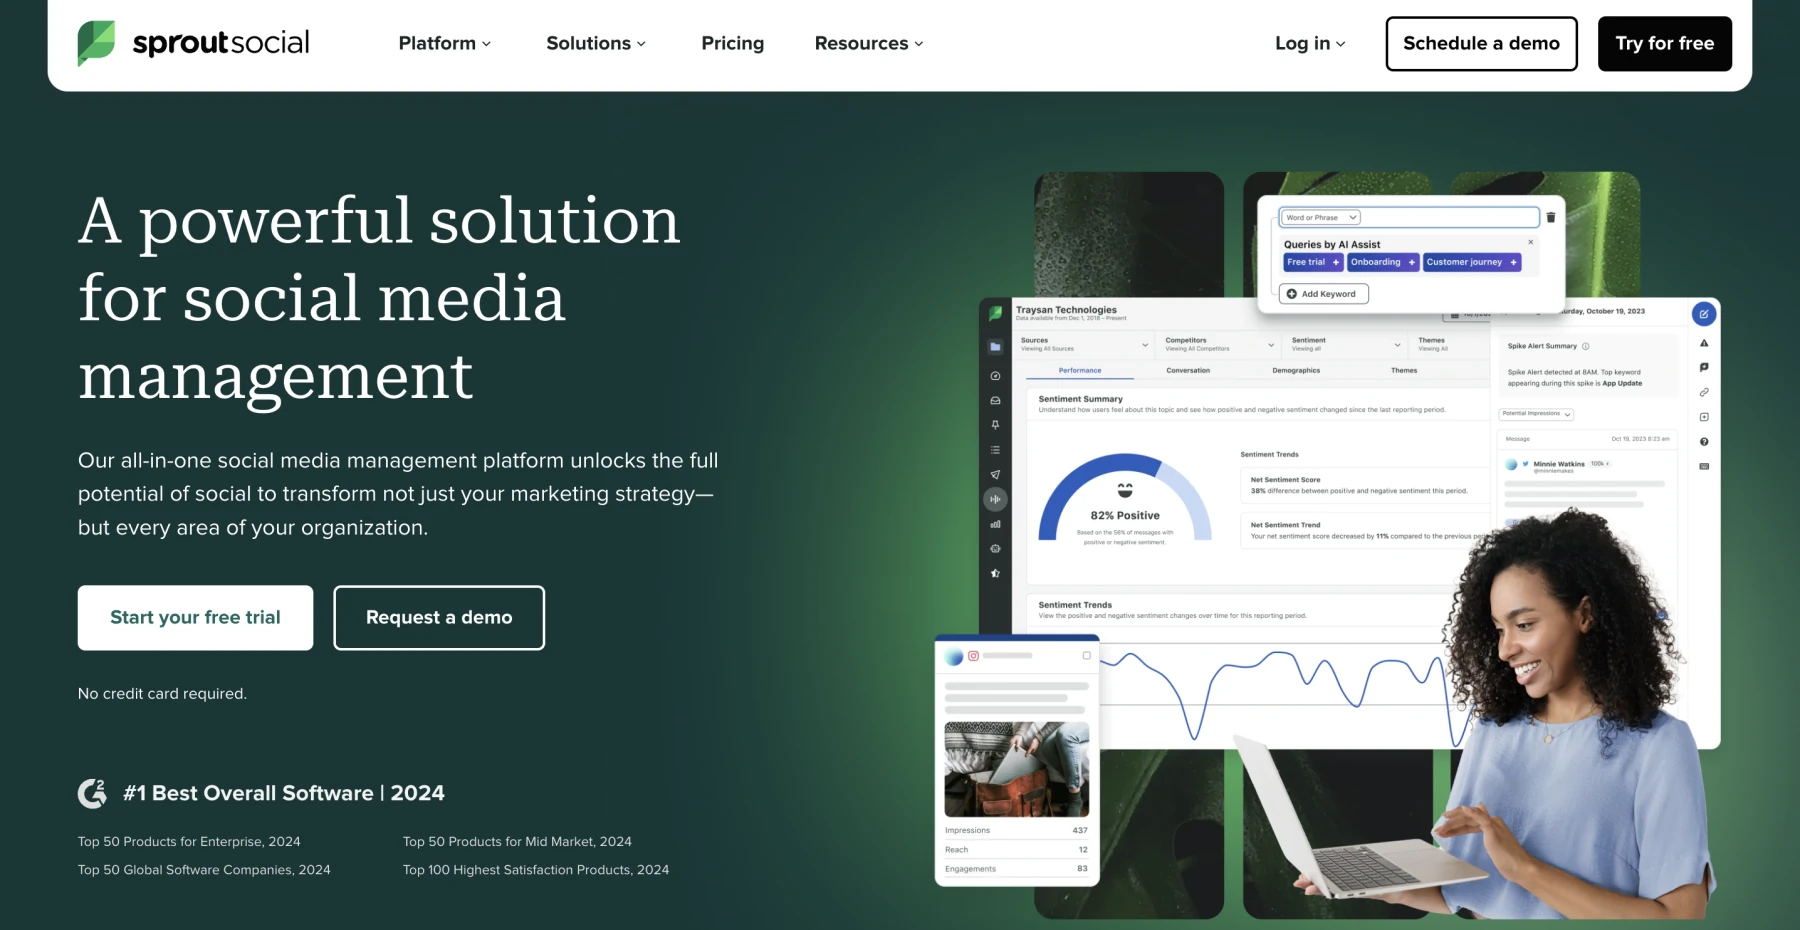
To start, let’s take a closer look at Sprout Social, a comprehensive social media management tool known for its powerful integration capabilities.
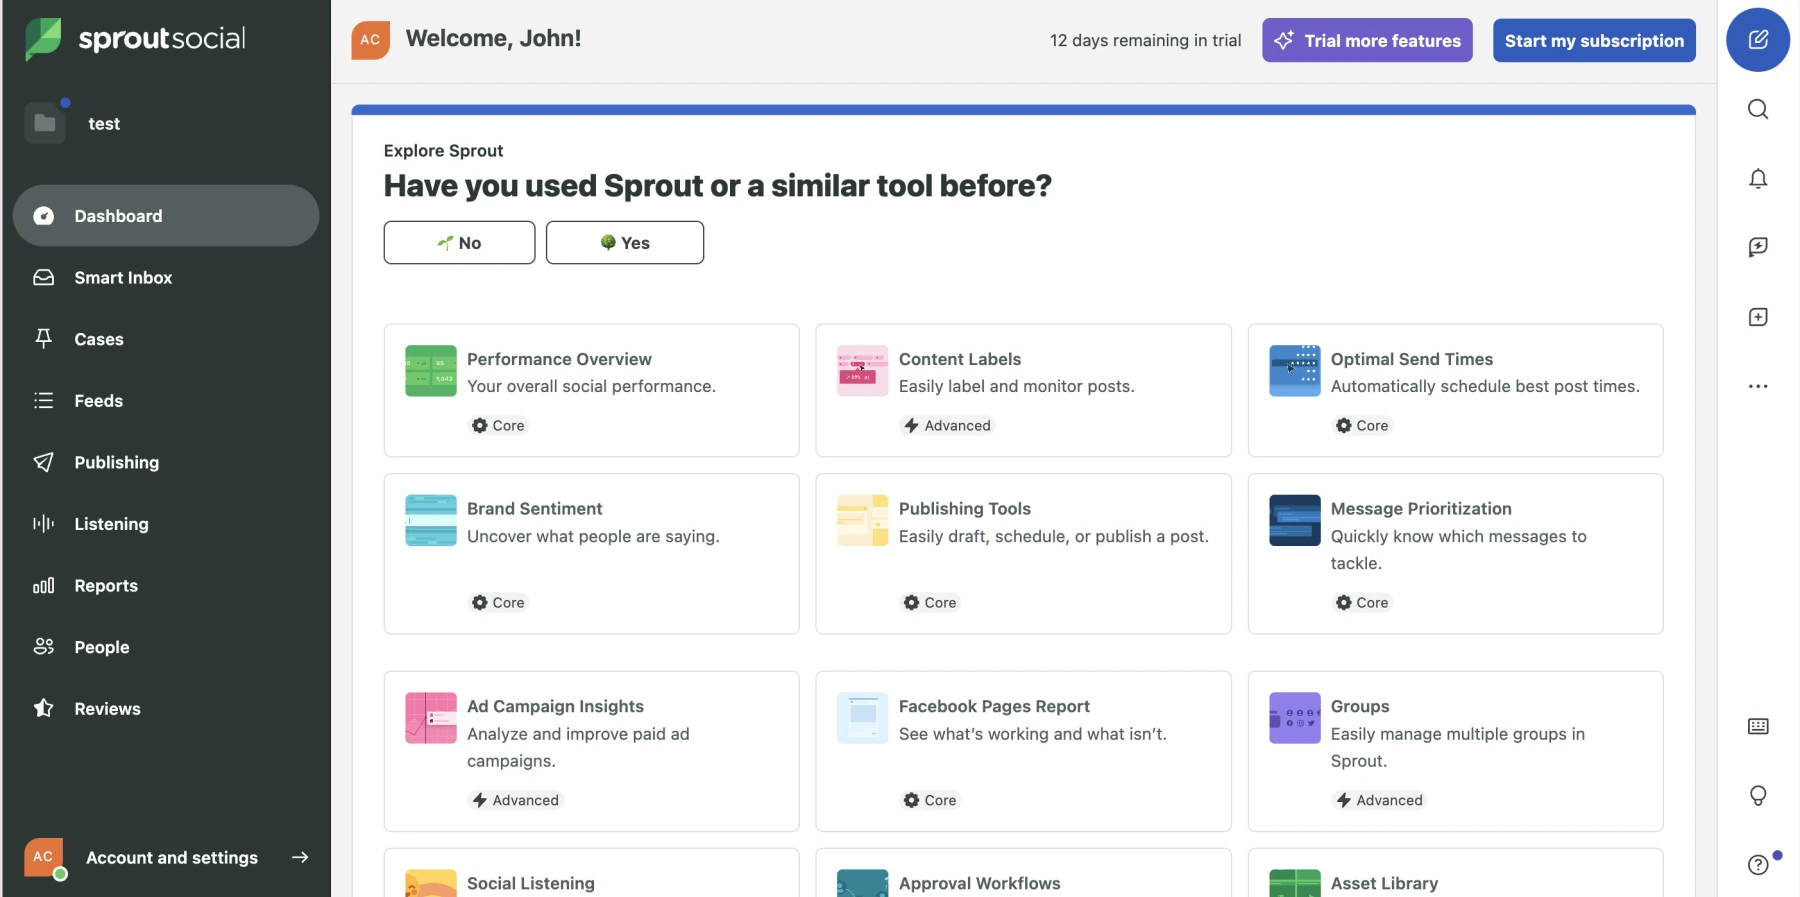
Sprout Social excels in integrating messages across multiple social platforms, allowing users to manage interactions from a unified inbox. Additionally, Sprout Social provides robust features for keyword tracking and competitive listening, helping brands stay informed about industry trends and their rivals.
However, while Sprout Social offers a wide range of features, its analytics capabilities can be somewhat limited. The analytics provided are generally basic and may not offer the deep customization that some users require. This can be a drawback for those seeking more detailed insights and tailored reporting options.
Strengths:
- Comprehensive Social Media Management: Integrates messages from various social platforms into a unified inbox, simplifying interaction management.
- Keyword Tracking & Competitive Listening: Provides tools for monitoring relevant keywords and staying updated on industry trends and competitor activities.
Weaknesses:
- Limited Analytics Customization: Analytics features are basic and may not offer the deep customization needed for more detailed reporting and insights.
- Price: Higher cost compared to some other tools, which may be a barrier for smaller businesses.
- Complexity: The broad range of features can be overwhelming for users who need a simpler solution.
Sources:
2. AgencyAnalytics
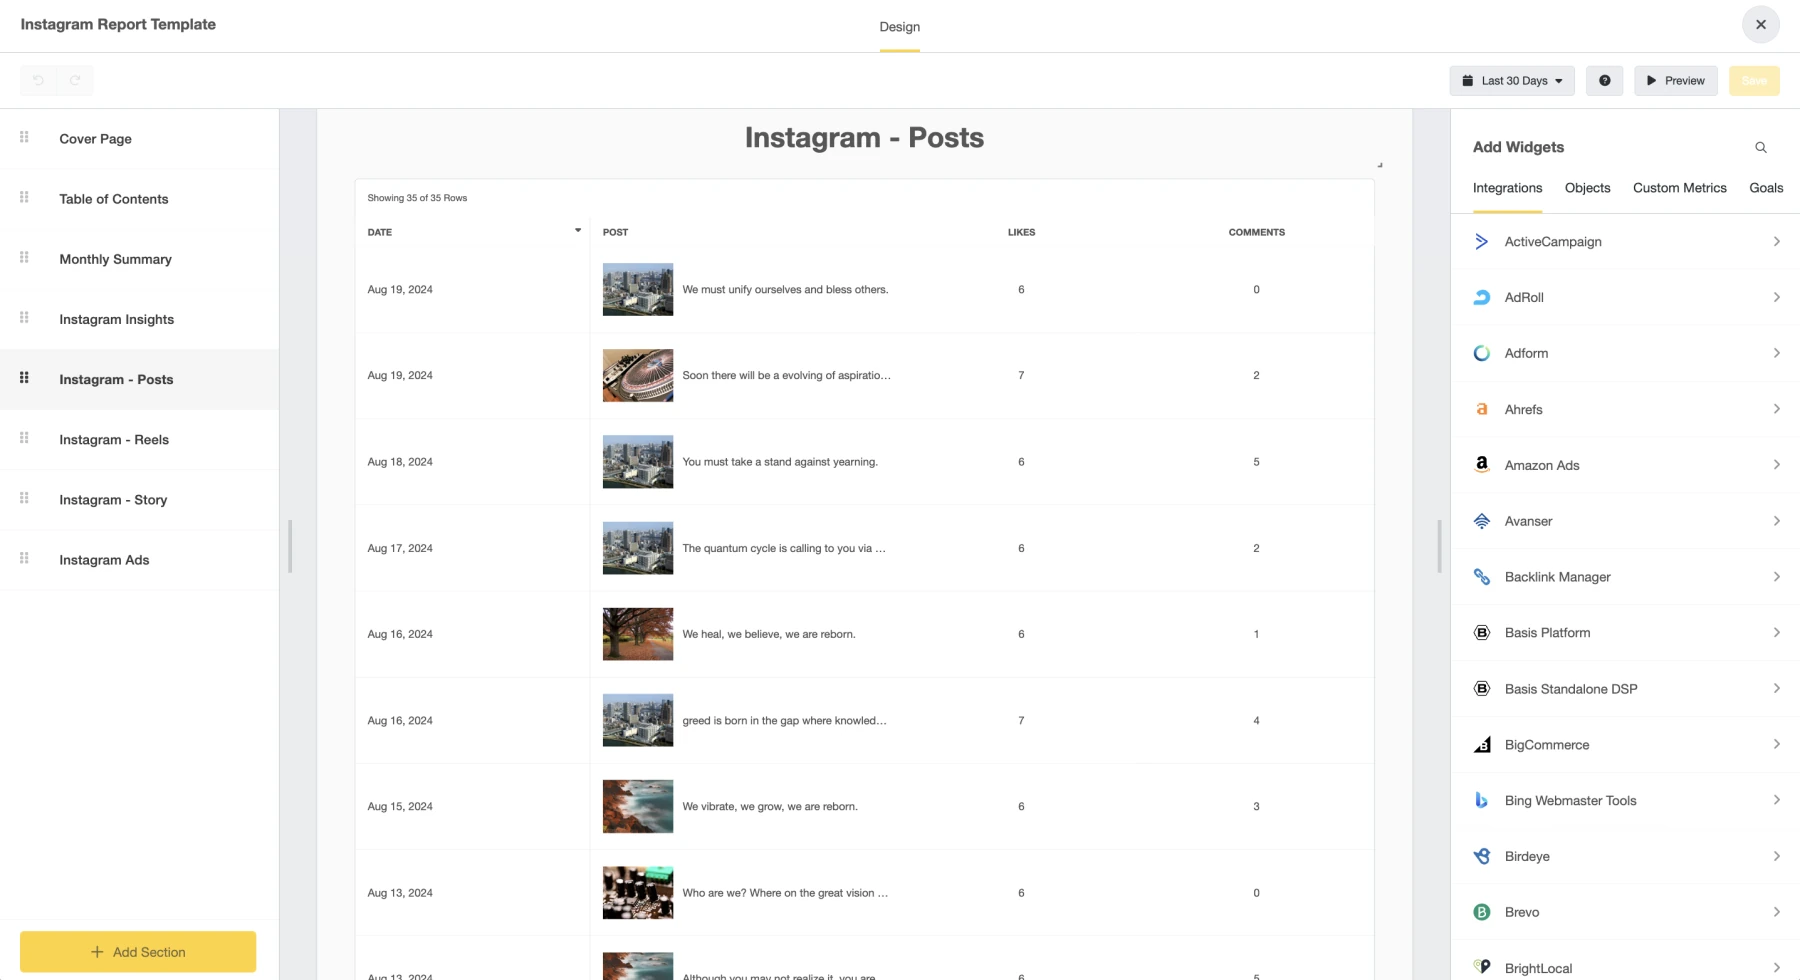
 AgencyAnalytics is a dashboard-centric tool that excels in integrating data from various marketing and SEO sources, offering users a centralized view of their metrics. Its extensive range of integrations supports diverse reporting needs and provides a broad spectrum of data insights. Additionally, the platform is known for its fast performance, which can be a significant advantage for users who need quick access to data and reports. However, its focus on dashboards means that reporting capabilities can be somewhat limited, especially for key platforms like Facebook, Instagram, and GA4, where only one pre-made report template is available. This limitation often forces users to start with blank reports, requiring significant time and effort to build customized reports from scratch.
Strengths:
- Varied Integrations: Extensive integration options for marketing and SEO tools.
- Fast Performance: Quick access to data and reports enhances usability.
Weaknesses:
- Limited Reporting Templates: Only one pre-made report template for major platforms, leading to time-consuming report customization.
- Basic Visuals: Reports resemble standard A4 paper with limited customization options.
- Navigation Complexity: The extensive range of data sources can make the platform challenging to navigate.
- Price: Can be relatively expensive compared to some other reporting tools.
Sources:
3. Databox
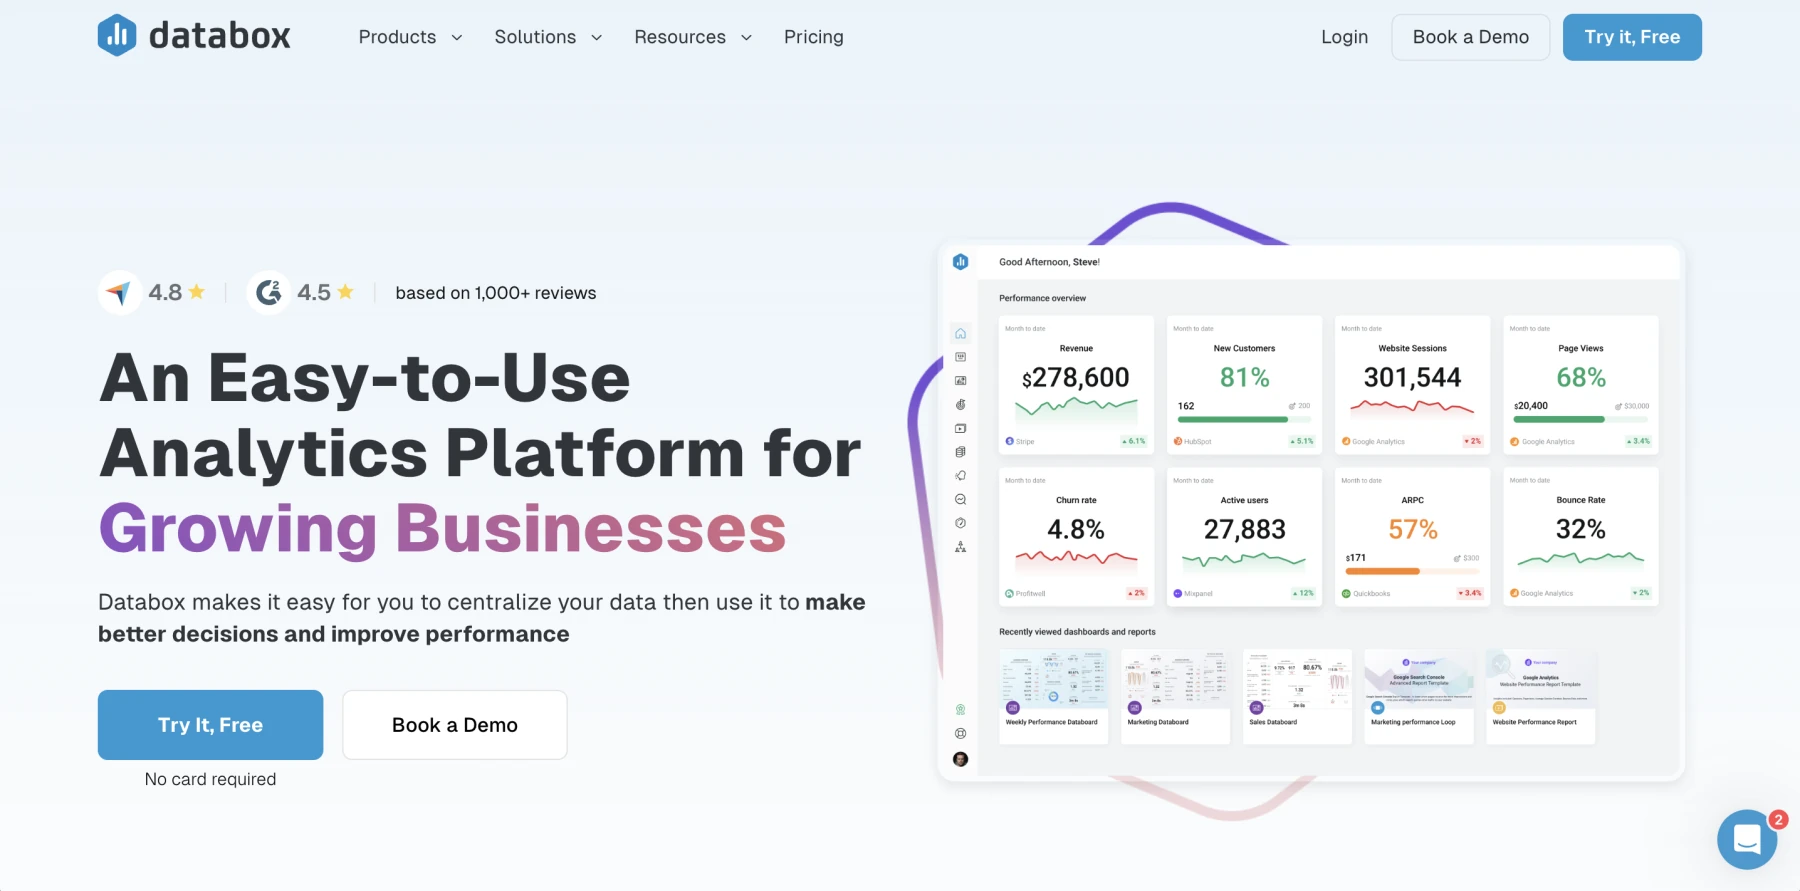
Databox is known for its strong data visualization capabilities and ability to integrate with a variety of data sources. The platform offers a visually appealing interface that stands out compared to other tools, providing users with an engaging way to view their metrics.
Databox supports numerous data source integrations, similar to its rivals, allowing users to pull data from various platforms for comprehensive reporting. However, like other tools, it provides only one pre-made template for each data source connection, such as Instagram, Facebook, or GA4. This can result in users having to create custom reports from scratch, which can be time-consuming.
Strengths:
- Effective Data Visualization: Offers visually appealing reports that make data easy to interpret.
- Varied Integrations: Supports numerous data source integrations for a broad reporting scope.
- Concise Reporting: Reports are compact, fitting multiple metrics per page.
Weaknesses:
- Limited Templates: Only one pre-made report template per data source connection, leading to more manual report creation.
- Complex Panel: The extensive range of integrations and metrics can make the platform's panel complicated to navigate.
- Complicated Reports: While visually appealing, reports can look complex due to the inclusion of many metrics per page.
Sources:
4. ReportGarden

ReportGarden offers a range of pre-made templates, providing users with more options compared to some of its competitors. However, like other tools, it supports numerous data source connections, which can dilute focus on the most critical data sources.
The reports produced are similar to vertical A4 pages and often feel a bit empty in terms of metric content. While the platform allows for the addition of widgets, the overall reporting format resembles a dashboard presented in a vertical layout, with minimal customization beyond adding your logo.

Strengths:
- More Pre-Made Templates: Offers a broader selection of report templates.
- Decent Visualization: Provides adequate visual representation of data.
- Widget Integration: Allows for the addition of widgets to reports.
Weaknesses:
- Limited Focus: Extensive data source connections can lead to a lack of emphasis on key data sources.
- A4-Like Reports: Reports resemble vertical A4 pages and can appear sparse in terms of metric content.
- Basic Customization: Mainly offers vertical A4 formats with limited options for enhancement beyond logo addition.
Sources:
5. DashThis

DashThis excels in multichannel reporting, allowing users to integrate and analyze data from multiple sources in a single, unified report. This feature is particularly useful for those who need to track and compare performance across various platforms.
The tool supports custom CSV data importing, enabling users to upload their own data and have it visualized within the platform. Despite offering pre-made templates for Instagram and Facebook, these templates are limited in terms of metrics provided. Additionally, the visual presentation of reports is relatively basic compared to other data visualization solutions.

Strengths:
- Multichannel Reporting: Facilitates the integration and analysis of data from multiple sources in one report.
- Custom CSV Importing: Allows users to upload their own CSV data for visualization.
- Pre-Made Templates: Includes templates for platforms like Instagram and Facebook.
Weaknesses:
- Limited Metrics: Pre-made templates offer fewer metrics compared to other solutions.
- Basic Visuals: The visual presentation of reports is less advanced, lacking the engaging design found in other tools.
Sources:
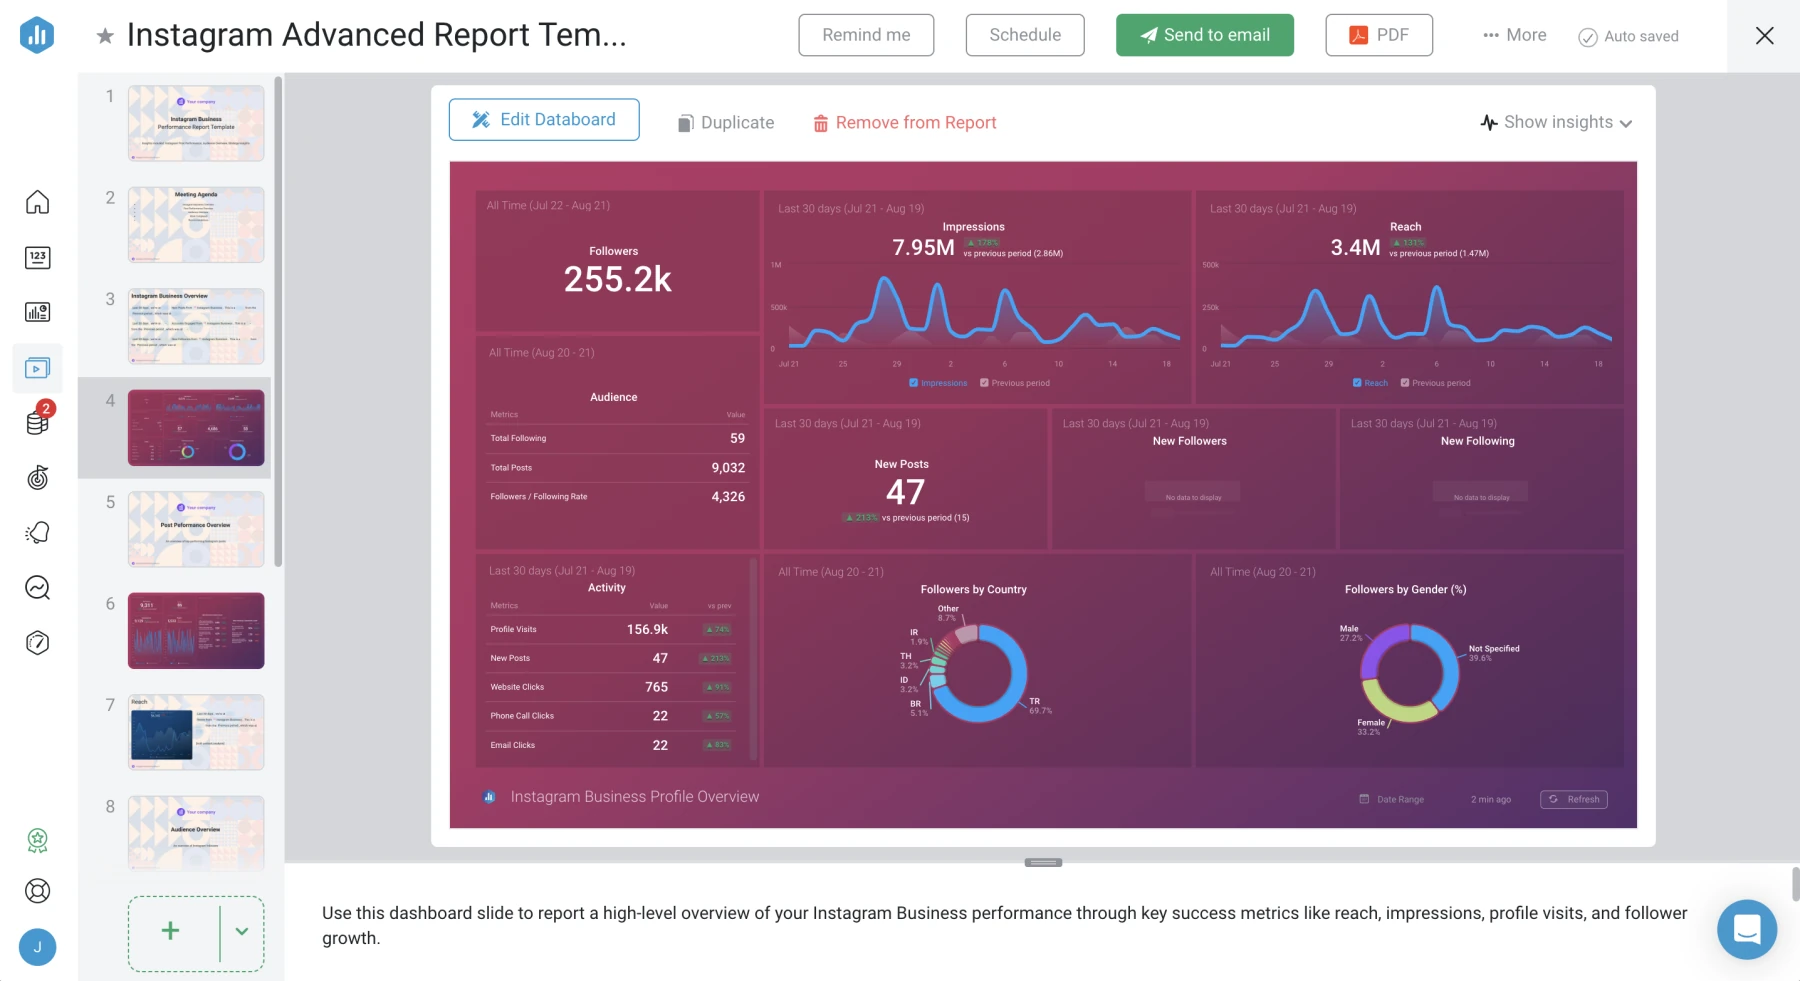
6. Slidebeast

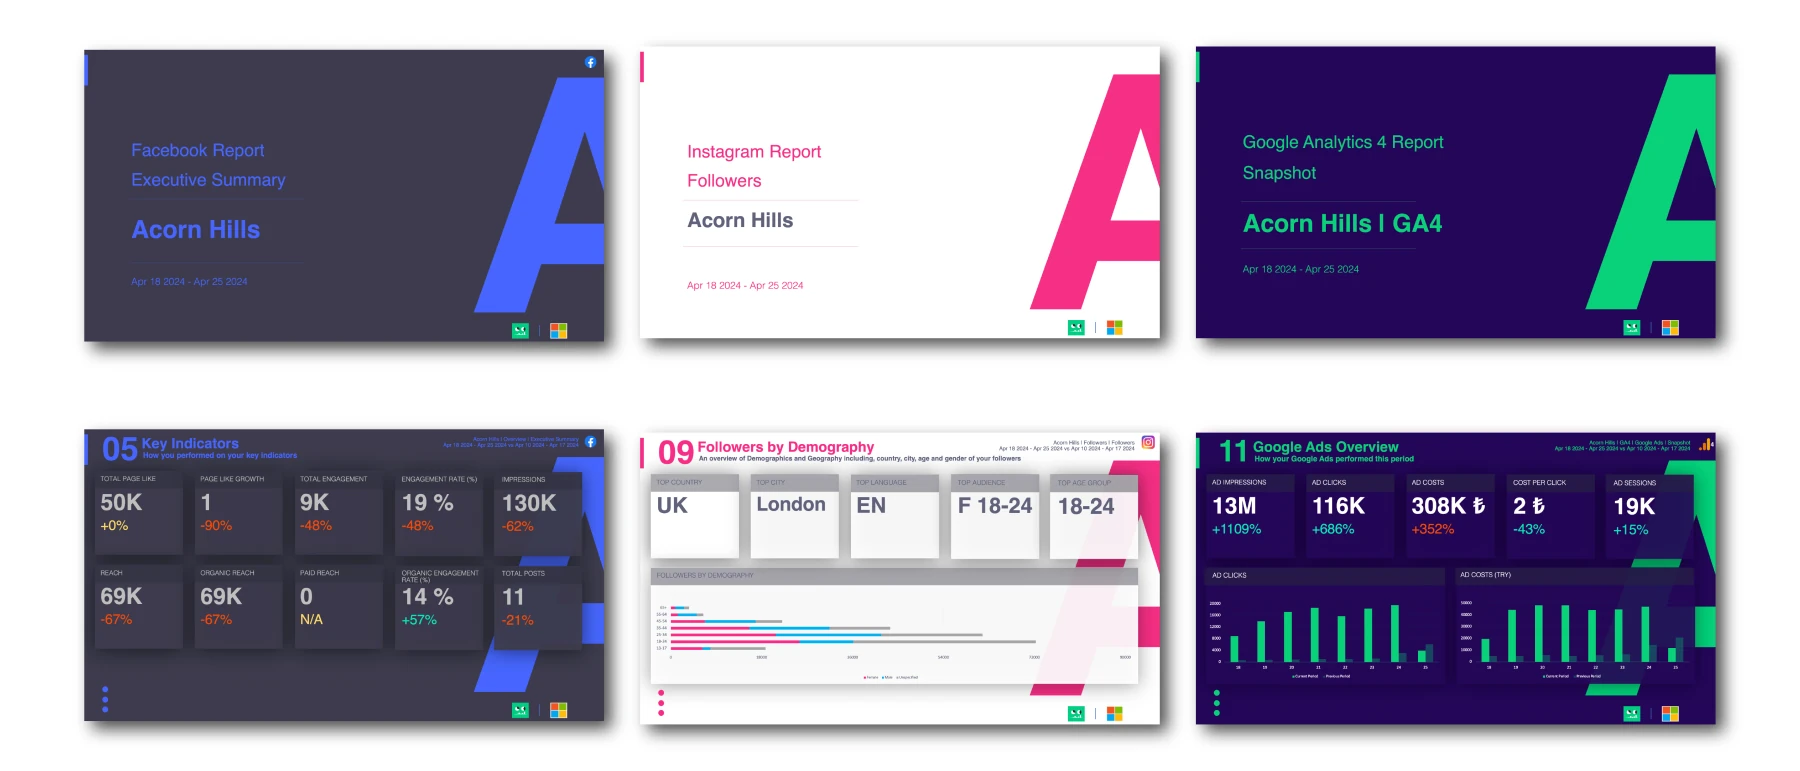
Slidebeast offers a powerful suite of features designed for efficient marketing report automation and brand customization. The platform excels in white labeling, providing three customizable color themes—dark, light, and glowing blue—as well as options to add your own brand colors and logos, including your customer's logo.
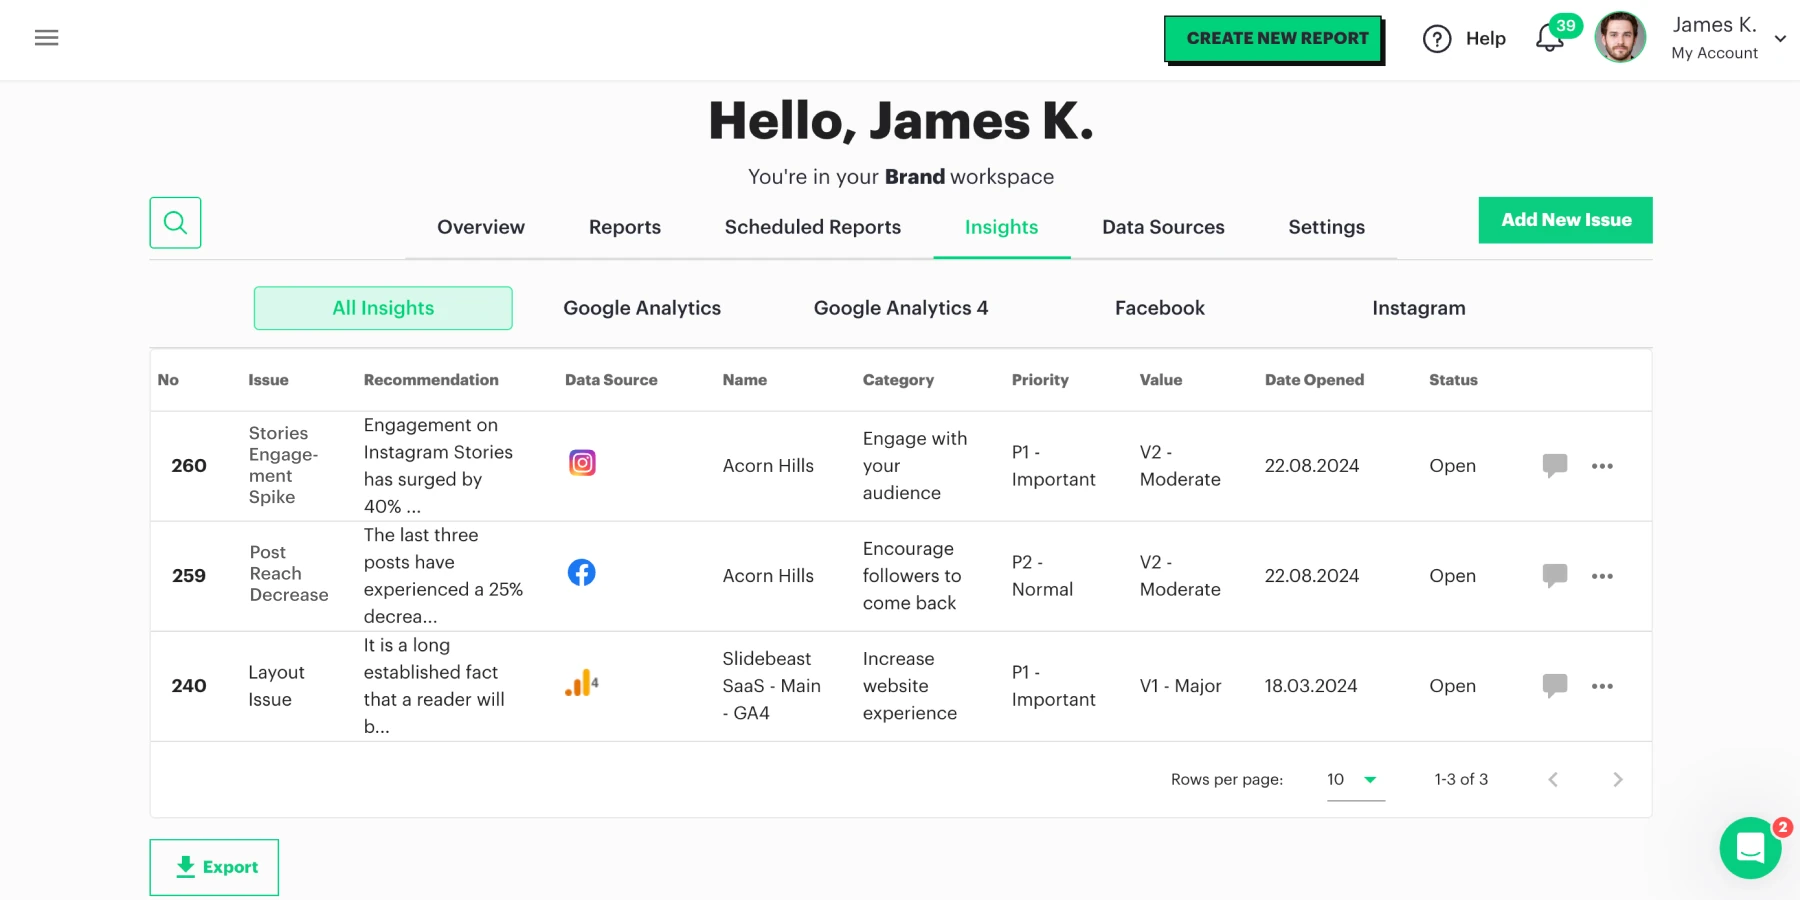
Slidebeast also features advanced insights tracking, where users can assign tasks, set priorities, and assess impact, all integrated into the reports:
Unlike some competitors, Slidebeast focuses on high-quality PPTX report exports and avoids dashboards and widgets, offering a straightforward reporting experience. The multi-brand management capability is enhanced by the workspace feature, which allows users to configure settings for each brand or workspace and reuse them as needed.
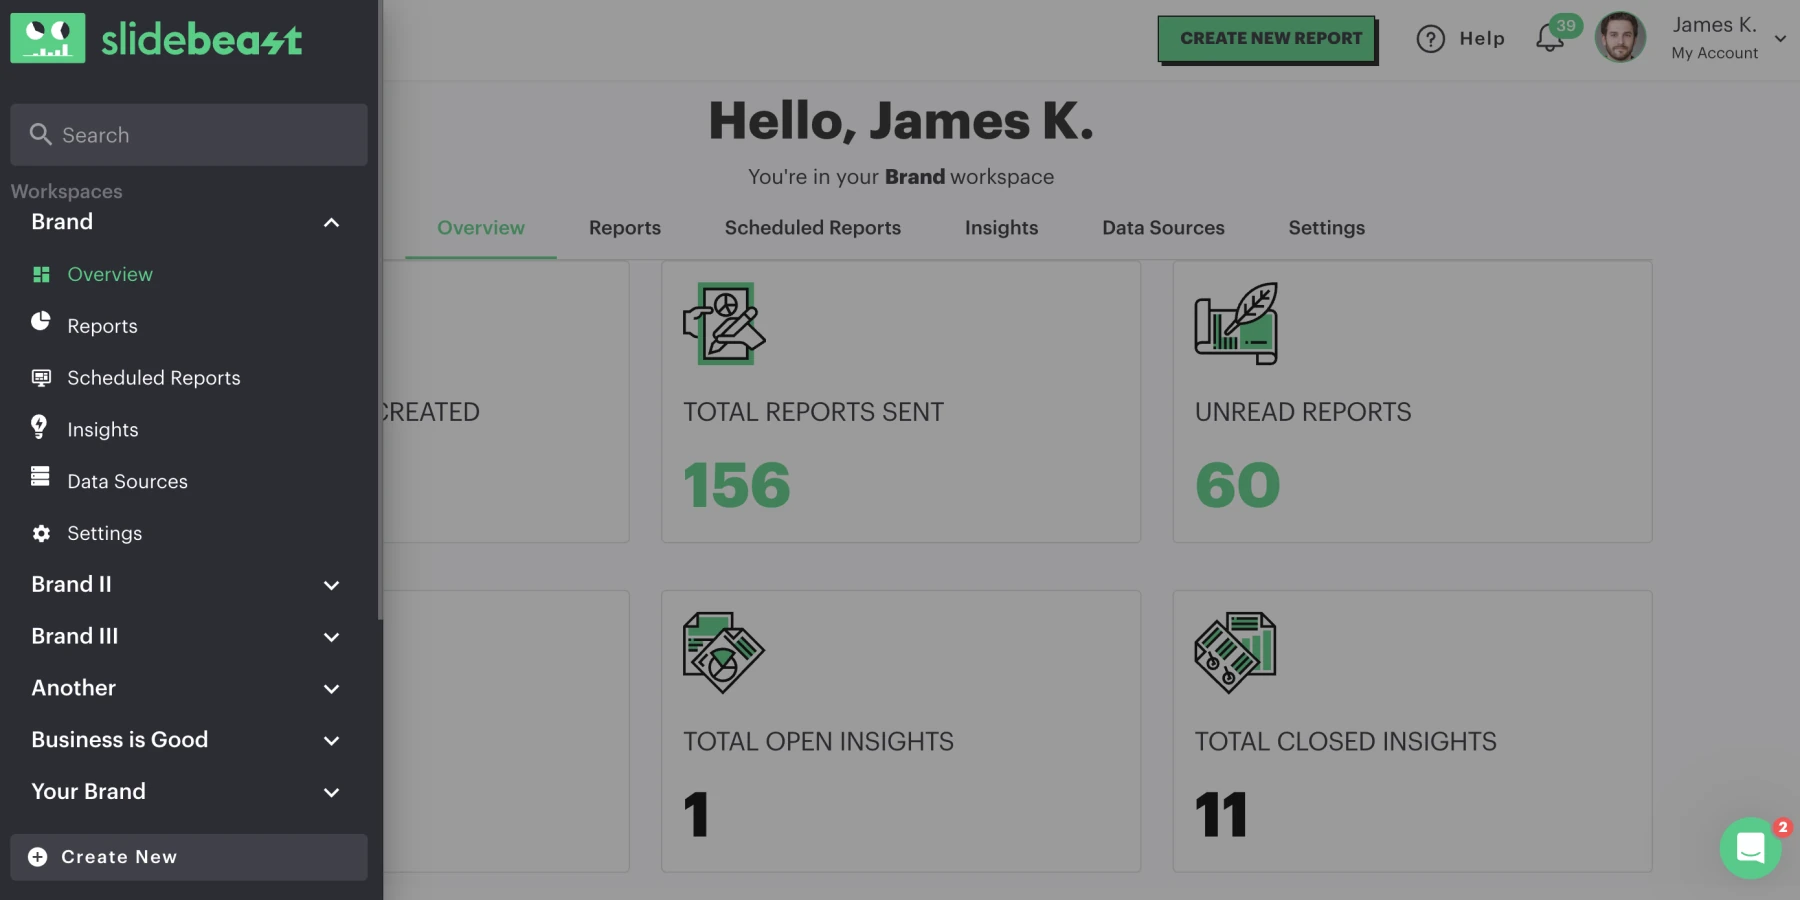
Additionally, Slidebeast provides a broad range of pre-made templates for various reporting needs, including E-commerce, Google Ads, Post Performance, SEO, and Engagement. Pricing is notably more affordable compared to other tools.

Strengths:
- White Labeling: Customizable color themes, logos, and brand-specific color options.
- Insights Tracking: Advanced tracking with task assignment, priorities, and impact evaluation.
- PPTX Reports: High-quality report exports with no dashboards or widgets.
- Multi-Brand Management: Workspace feature for easy management of multiple brands with reusable settings.
- Pre-Made Templates: Extensive range of templates for different reporting needs.
- Affordability: Significantly cheaper pricing compared to other reporting tools.
Weaknesses:
- Limited Integrations: Fewer data source integrations compared to some competitors, focusing on essential platforms like GA4, Facebook, Instagram, and LinkedIn.
Sources for Slidebeast:
Choosing the right marketing report automation tool is key to effectively presenting your data and managing your brand. Slidebeast offers high-quality PPTX reports and customizable options that let you personalize your reports with your own colors and logos. With a wide range of pre-made templates and user-friendly insights tracking, it simplifies the reporting process. Although it might not have as many integrations as some competitors, its affordability and tailored features provide excellent value. By considering these strengths and how they align with your needs, you can select the tool that best supports your reporting and branding objectives.
Ready to see how Slidebeast can enhance your reporting? Start your free trial today—no credit card needed!