As modern users bounce between phones, tablets, and desktops like digital trapeze artists, understanding their journeys across multiple devices has become crucial for businesses. Google Analytics 4 (GA4) equips marketers with the tools needed to unravel these complex paths, enabling smarter strategies and better user experiences. Let’s dive into the process of mastering cross-device tracking in GA4 and extracting actionable insights.
Understanding Cross-Device Tracking in GA4
Cross-device tracking allows you to follow a user’s journey, regardless of whether they switch from a smartphone to a laptop or even make a pitstop on a tablet. GA4 makes this possible by prioritizing event-based tracking and leveraging Google Signals for users who are signed into their Google accounts.
1.webp)
Here’s why this is a game-changer:
-
Unified User ID: By assigning unique identifiers to users, GA4 stitches together their activities across devices.
-
Google Signals: GA4 can recognize users logged into Google accounts, linking their behavior across sessions and devices.
-
Event-Centric Reporting: Instead of being session-dependent, GA4’s event-based model captures touchpoints regardless of the platform.
A Quick Example
Imagine a customer discovers your product on their phone during a lunch break, revisits your site on a desktop later, and completes the purchase on a tablet. With GA4’s cross-device tracking, you’ll see the entire journey in one cohesive timeline, not as isolated fragments.
Setting Up GA4 for Multi-Device Analysis
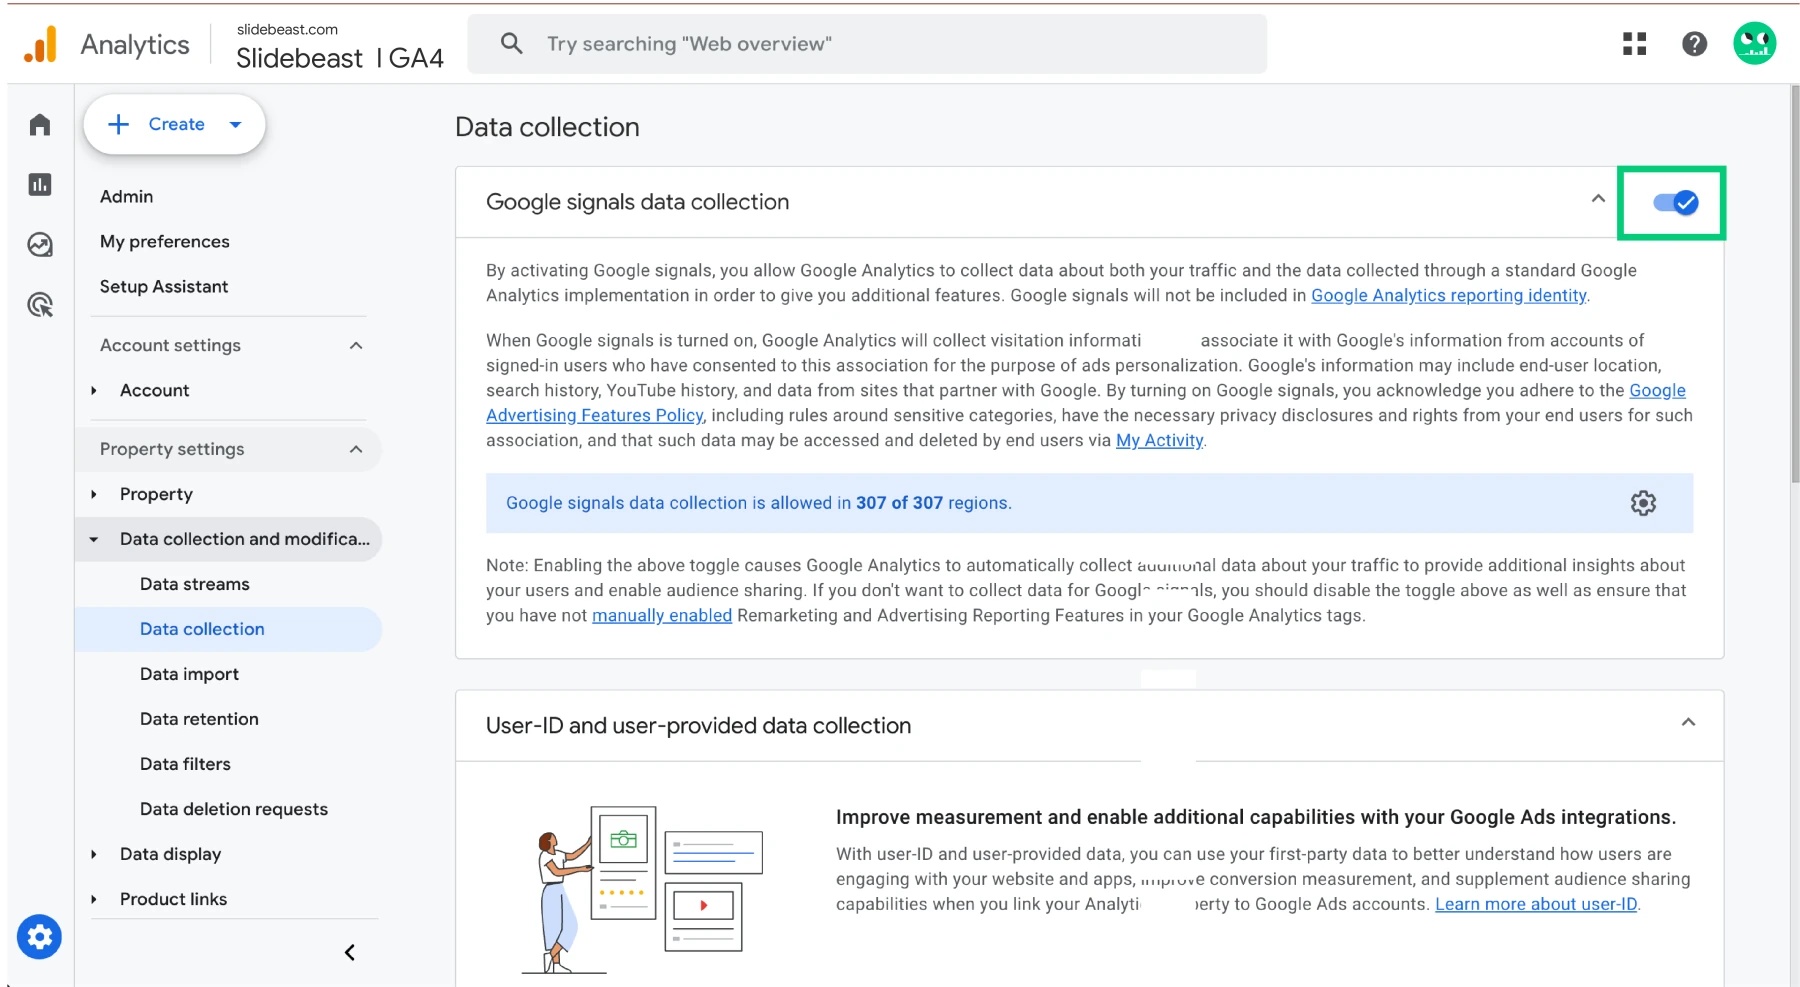
Getting started with cross-device tracking in GA4 is straightforward but requires a few essential steps:
-
Enable Google Signals Data Collection:
-
Go to Admin in your GA4 property.
-
Under Data Settings, click on Data Collection.
-
Turn on Google Signals and follow the prompts to enable enhanced data collection. This feature powers cross-device reports using aggregated and anonymized data from signed-in users.
-
-
Implement User ID Tracking:
-
Work with your development team to set up a User ID. This involves:
-
Generating a unique identifier for users on your site or app.
-
Sending this User ID as a parameter with every logged-in user event to GA4.
-
-
Navigate to Admin > Setup Assistant (feel free to use the search bar), and enable User-ID Reporting in the User-ID section to activate this feature in your reports.
-
For detailed guidance, refer to Google’s User ID implementation documentation.
-
-
Link Platforms:
-
If applicable, link your GA4 property with tools like Firebase (for app data) or BigQuery to analyze cross-platform behaviors more effectively.
-
-
Verify Data Collection:
-
Use the DebugView feature in GA4 to ensure events are firing correctly and User IDs are being captured.
-
Key Metrics for Analyzing User Journeys Across Devices
Once your setup is complete, GA4 opens up a wealth of metrics that reveal cross-device behavior. Here are some of the key ones to monitor:
Active Users: Segment active users by device categories (e.g., mobile, desktop, tablet) to understand platform preferences.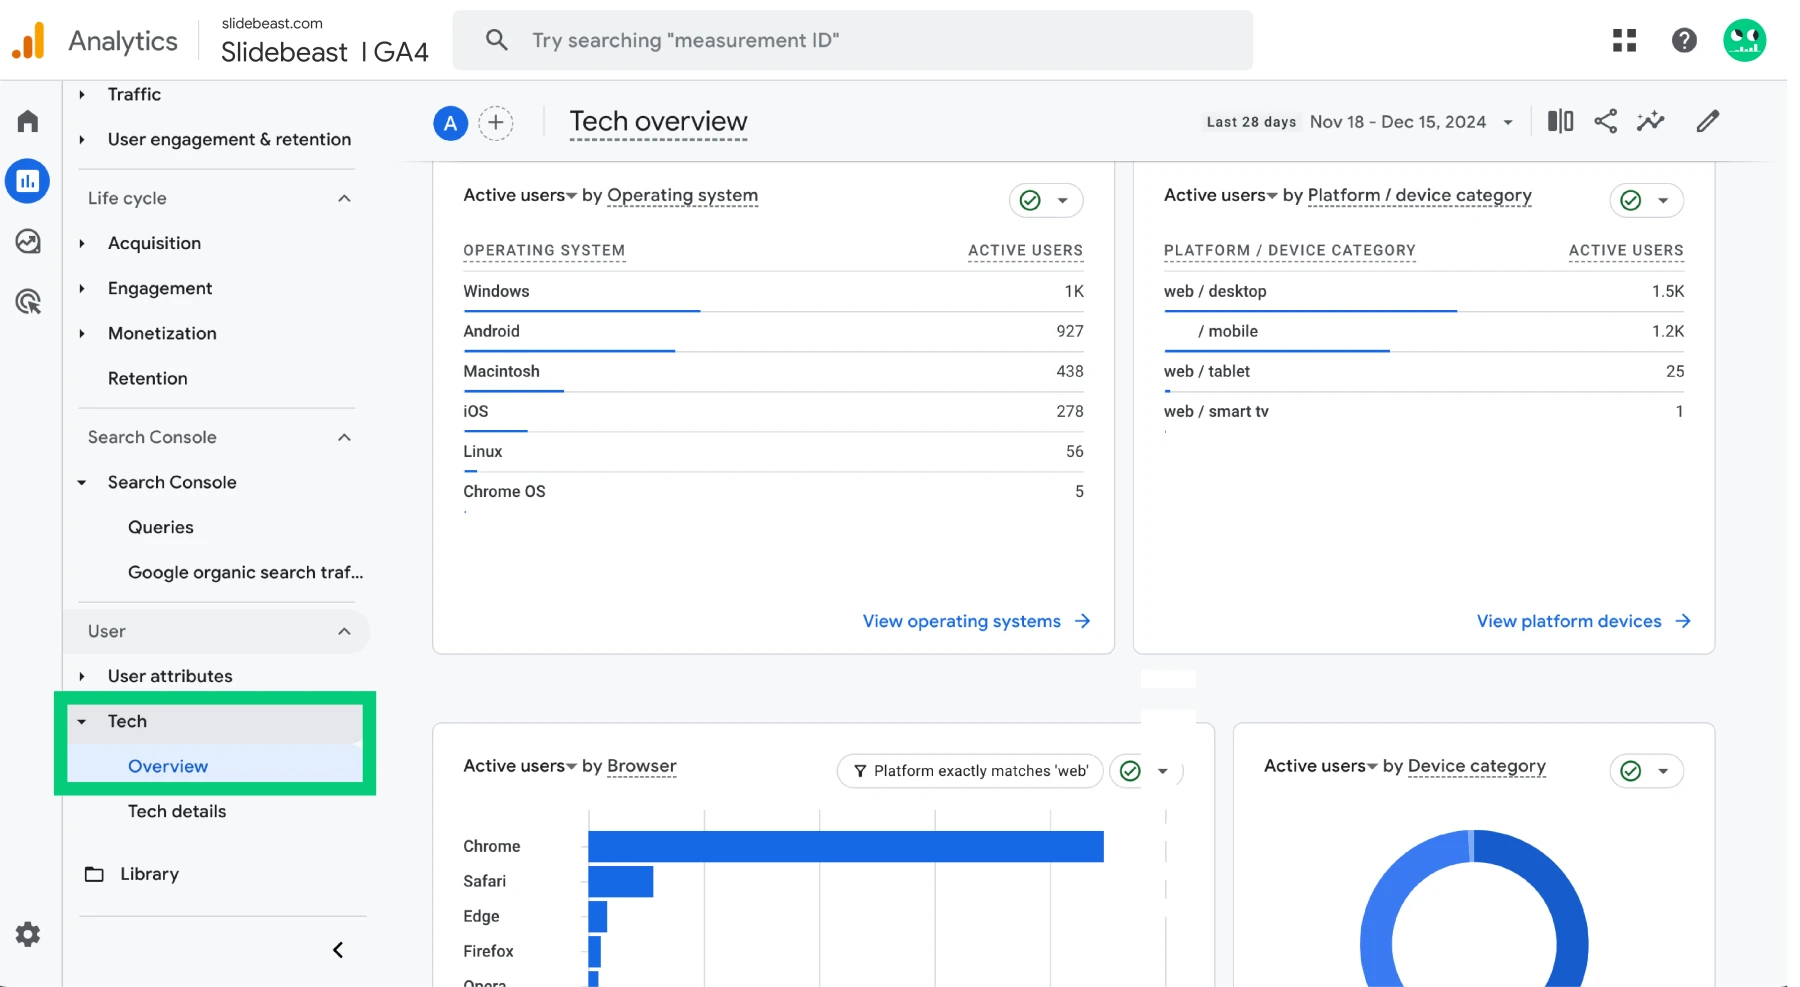
-
Device Overlap:
-
Go to Reports > User > Tech Details.
-
Analyze the Device Overlap Report, which shows how many users interact with your site/app using multiple devices.
-
-
Path Exploration:
-
Use the Explore feature and create a Path Exploration.
-
Track sequences like "App open > Website visit > Purchase" to uncover device-switching patterns.
-
-
Conversion Rates by Device:
-
Add a custom comparison in any report to measure conversions across device categories.
-
Understand which devices contribute the most (or least) to your goals.
-
-
Engagement Metrics:
-
Metrics like Average Engagement Time and Event Count per User can help assess how users interact across devices.
-
Pro Tip:
Create audience segments based on users who switch devices. For example, define an audience of users who start on mobile but complete a purchase on desktop. Use this segment to tailor your ad campaigns or email flows.
Optimizing User Experience Based on Cross-Device Insights
The data you gather isn’t just for show—it’s your roadmap to a better user experience. Here are some actionable ways to use your insights:
-
Streamline the Funnel:
-
If users frequently drop off on mobile but complete actions on desktop, optimize your mobile experience. For instance, simplify forms or improve load speeds.
-
-
Tailor Content by Device:
-
Identify device-specific preferences. For example, mobile users might prefer quick reads, while desktop users spend time on in-depth resources.
-
-
Improve Retargeting Campaigns:
-
Use cross-device insights to retarget users where they’re most likely to convert. Example: Serve desktop retargeting ads to users who visited your site on mobile but didn’t convert.
-
-
A/B Test Device-Specific Features:
-
Experiment with features like mobile-friendly checkout flows or desktop-exclusive offers to see what resonates.
-
Creating Custom Reports to Visualize Multi-Device Behavior
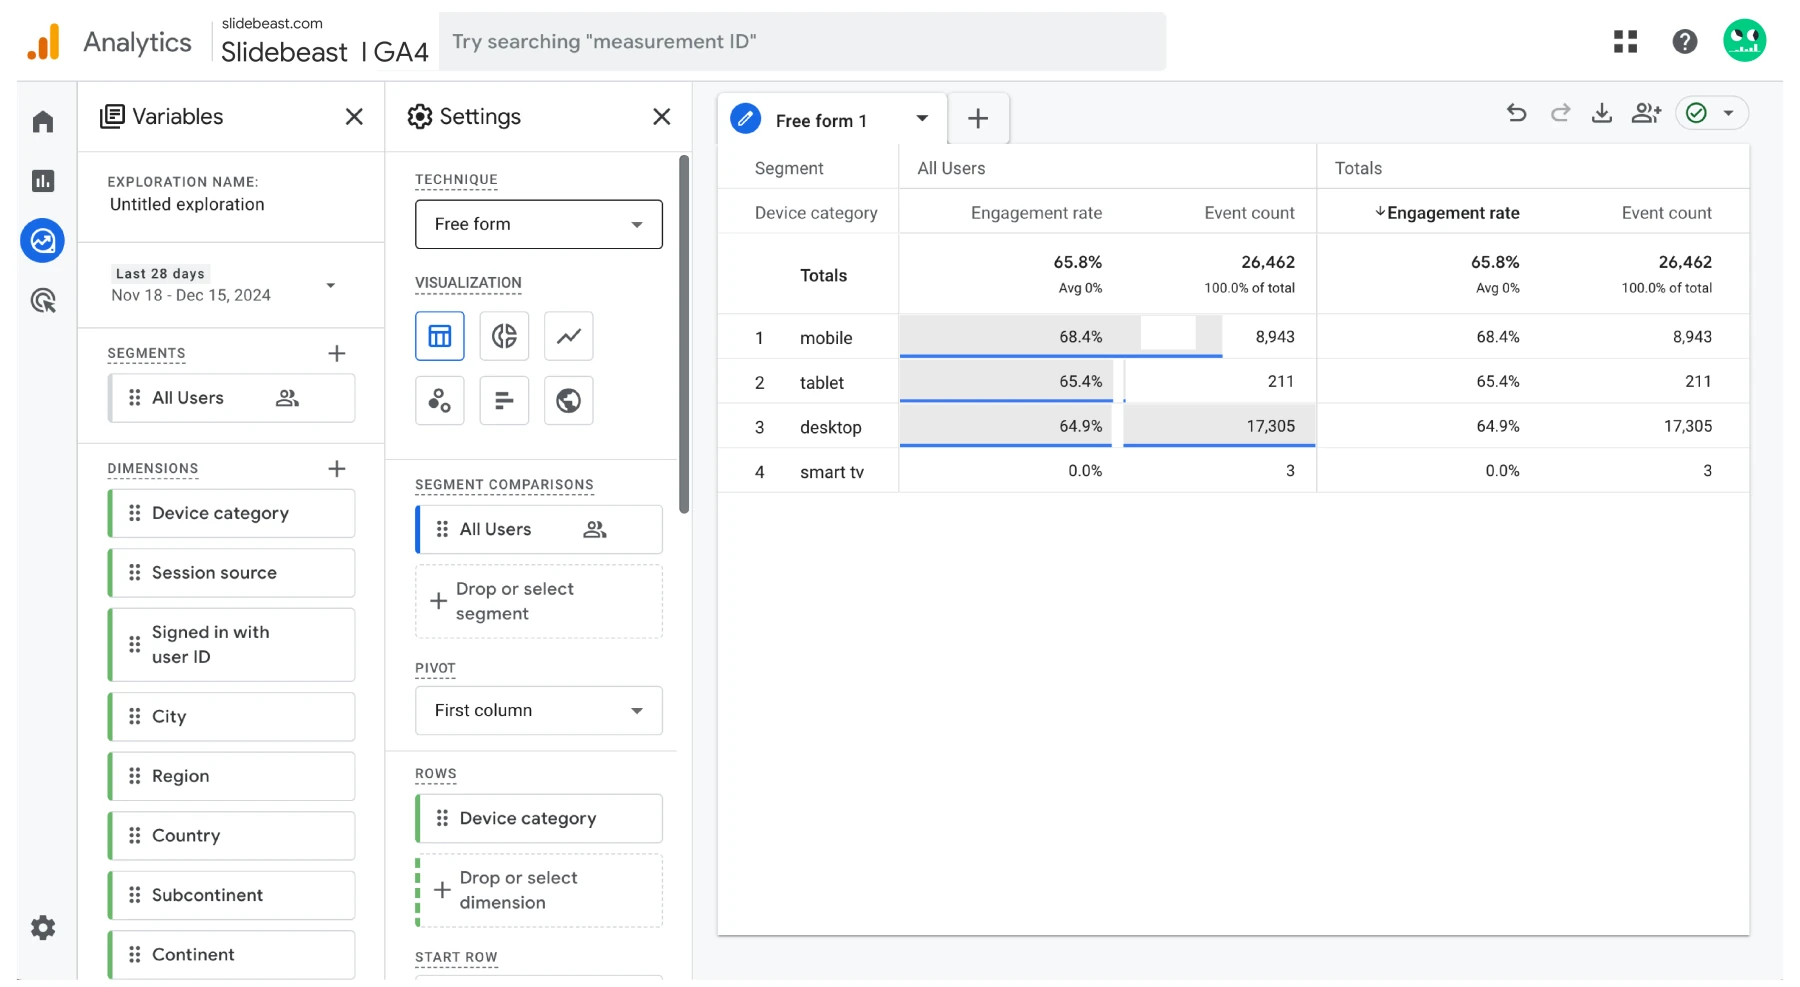
Custom reports are your best friend when tracking multi-device journeys. In GA4, you can create these using the Explore feature:
-
Open Explore:
-
Go to Explore in the left-hand menu.
-
Choose Blank or a relevant template.
-
-
Set Dimensions and Metrics:
-
Add dimensions like Device Category, Session Source, or User ID.
-
Pair them with metrics like Conversions, Engagement Time, and Revenue.
-
-
Use Segments:
-
Create segments to compare behaviors, such as "Users who switched devices" vs. "Single-device users."
-
Creating Custom Reports to Visualize Multi-Device Behavior
The Explore feature in GA4 is your gateway to custom reports, allowing you to dig deeper into user journeys across devices. But let’s be real: while Explore is powerful, it can also be overwhelming and time-consuming. That’s where Slidebeast comes in to save the day, offering an intuitive, efficient way to create and share insightful reports.
Why Slidebeast is a Game-Changer
-
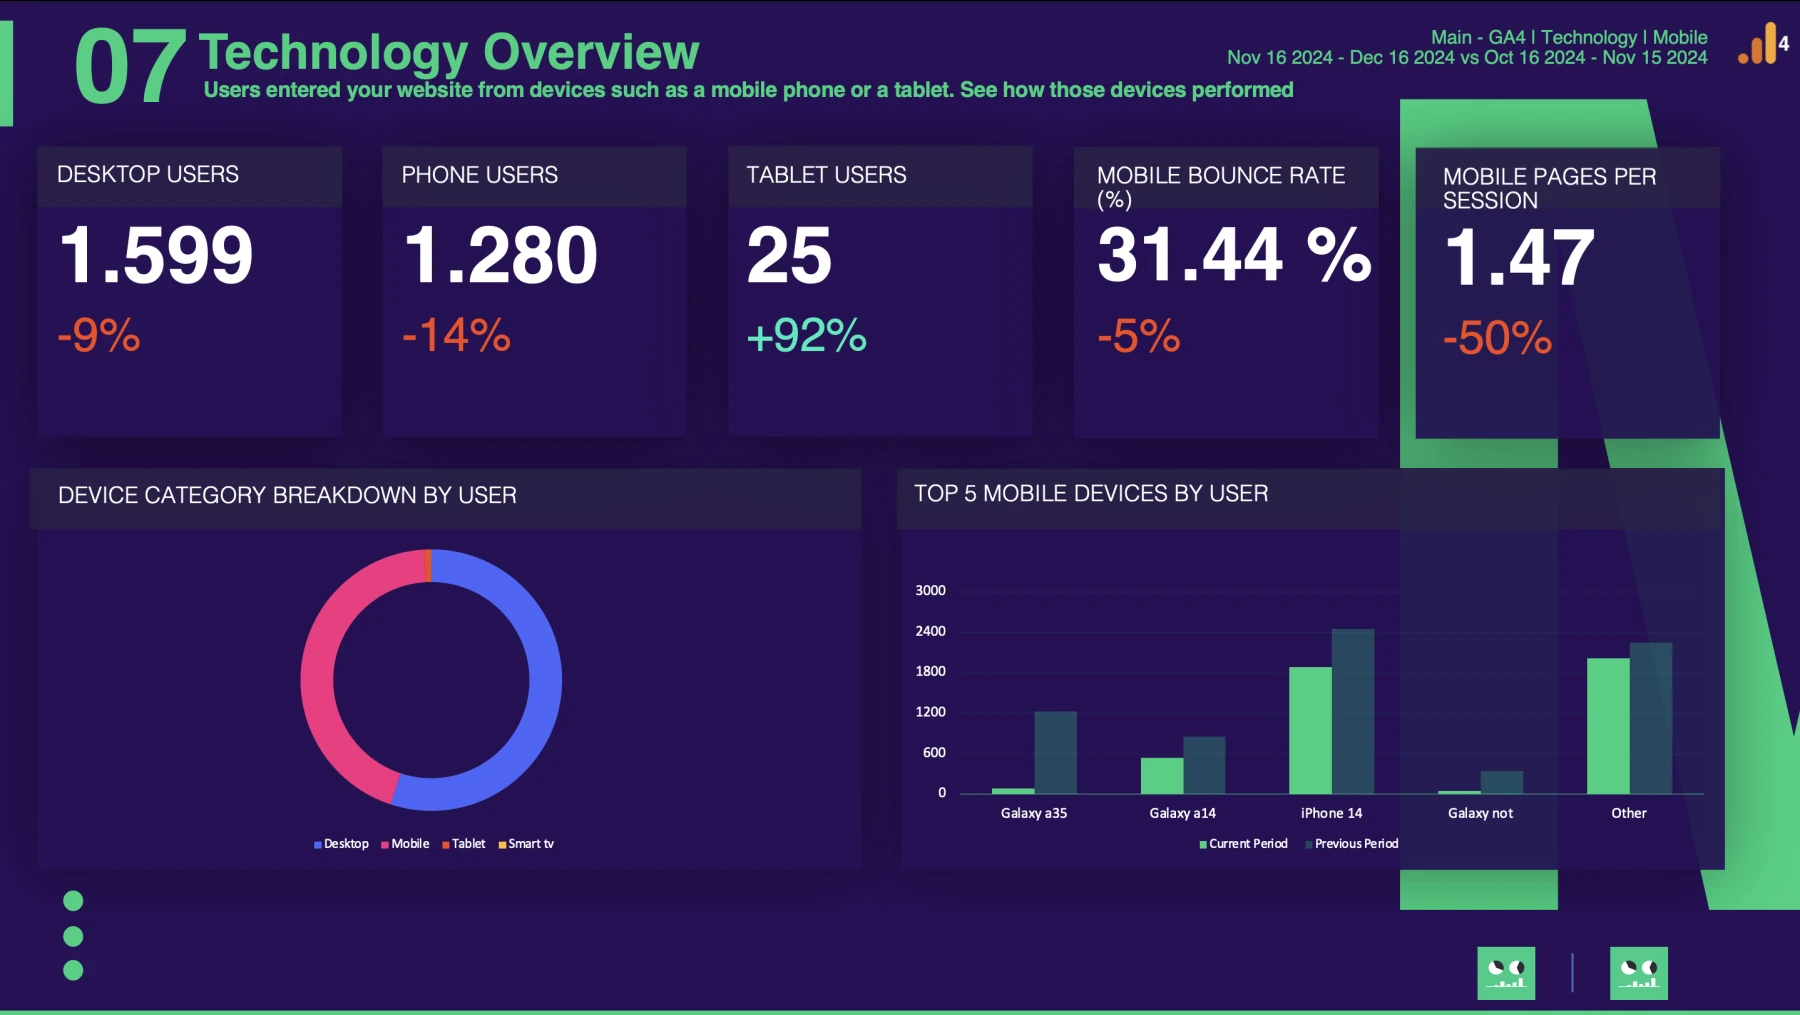
Professional Pre-Built Templates: No need to start from scratch! The GA4 Mobile Report Template includes everything from Key Indicators to Top 10 URLs by device category. It doesn’t just focus on mobile—it gives you insights into desktop, mobile, and tablet performance, along with conversion data and browser usage.
-
Custom Branding with White Labeling: Impress your clients with fully customized reports. Add your logo, your client’s logo, and choose from sleek pre-made themes—light, dark, or glowing blue—or create your own custom color palette.
-
Automated Scheduling: Say goodbye to manual reporting. Schedule reports to be delivered straight to your inbox or your client’s inbox—daily, weekly, or monthly.
-
Export to PPTX: Need to share insights in a presentation? Slidebeast exports your reports into PowerPoint files, giving you flexibility to make additional edits or present them as-is.
How Slidebeast Saves You Time
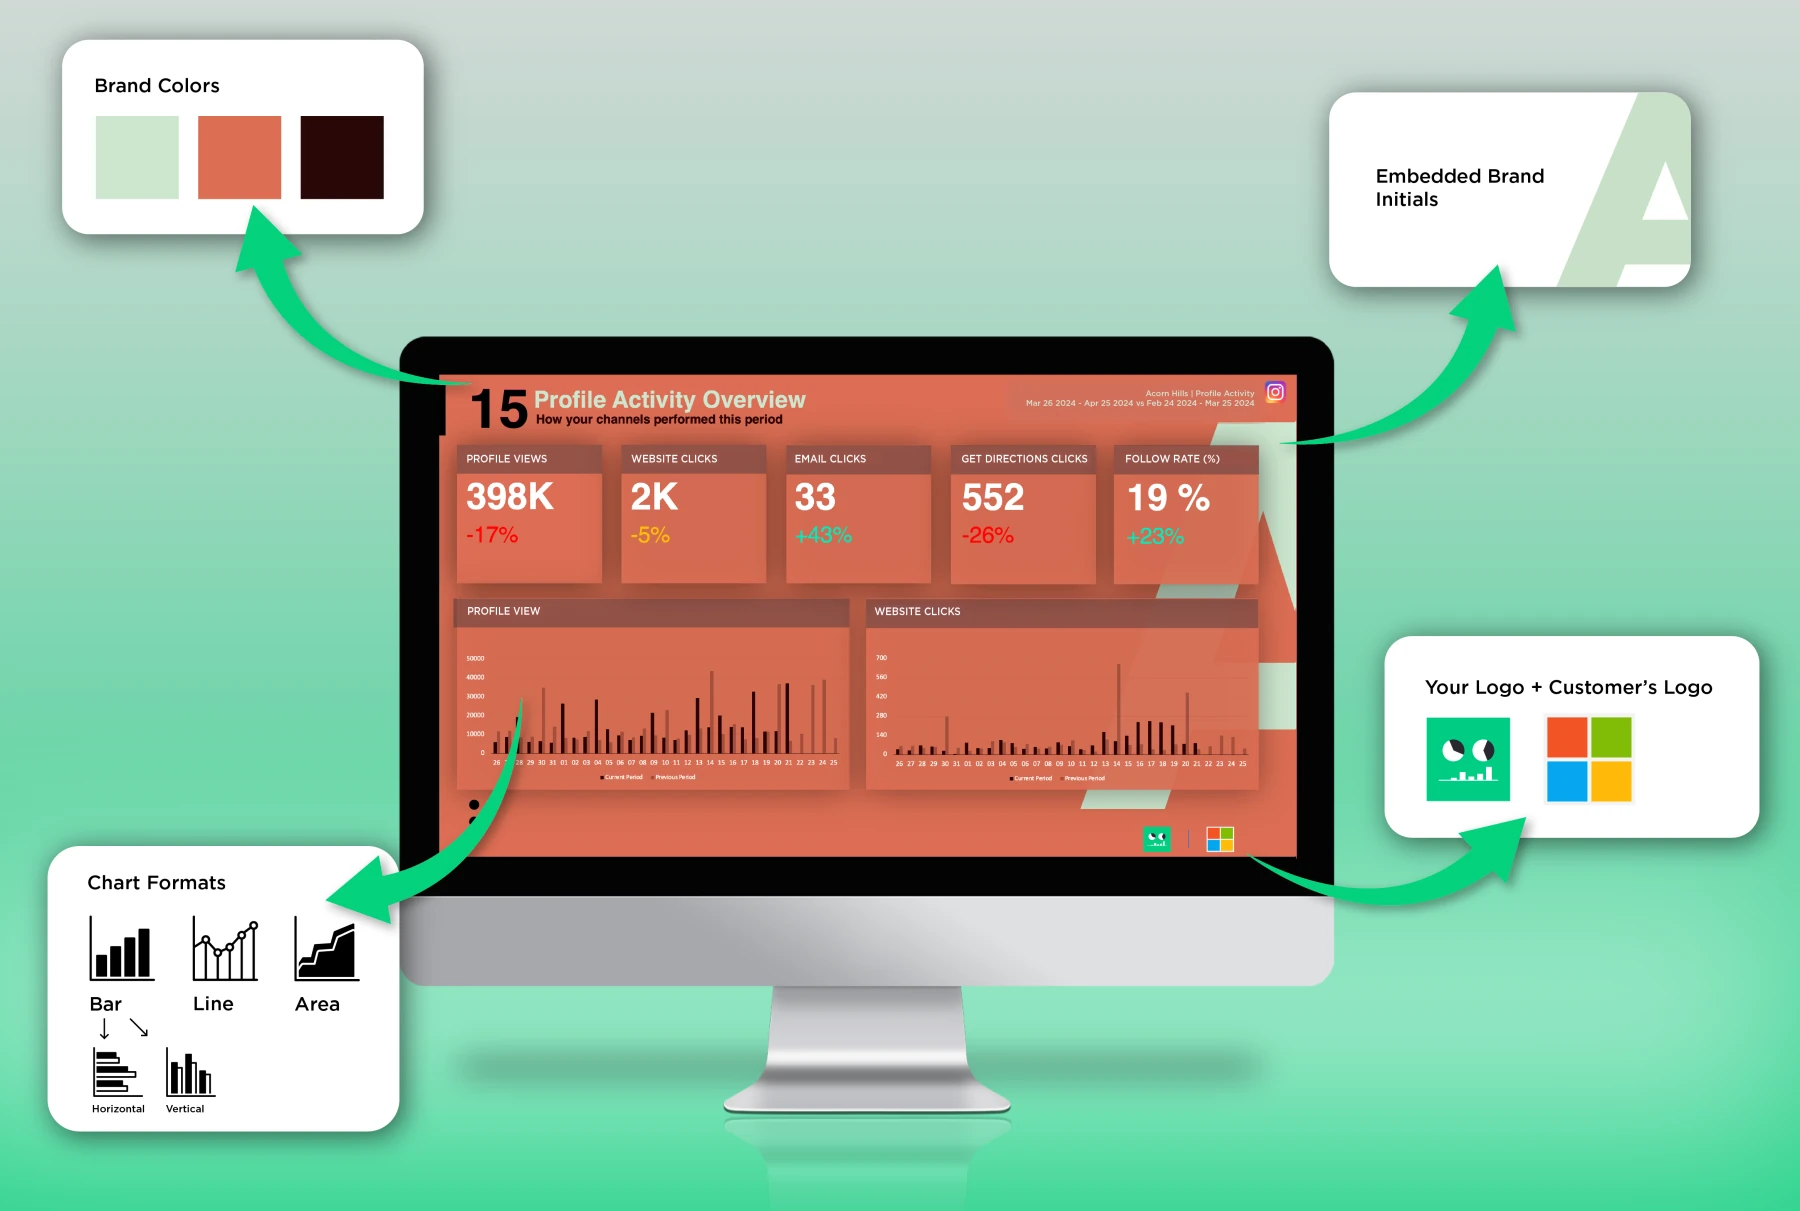
Instead of navigating the complexities of GA4’s Explore feature, Slidebeast simplifies the process. In just minutes, you can generate polished, detailed reports that highlight cross-device behaviors, saving you hours of setup and troubleshooting. Slidebeast helps you focus on strategy and insights—not on struggling with data visualization tools.
For anyone serious about delivering impactful, professional reports, Slidebeast is the ultimate ally. Try it today for free and experience the difference for yourself!


